
Beverage Packaging Market
Beverage Packaging Market Forecasts to 2028 - Global Analysis By Product (Pouches, Cans, Bottles, Cartons and Other Products), Material (Glass, Plastic, Paperboard, Metal and Other Materials), Application and By Geography

|
Years Covered |
2020-2028 |
|
Estimated Year Value (2022) |
US $158.46 BN |
|
Projected Year Value (2028) |
US $237.81 BN |
|
CAGR (2022 - 2028) |
7.0% |
|
Regions Covered |
North America, Europe, Asia Pacific, South America, and Middle East & Africa |
|
Countries Covered |
US, Canada, Mexico, Germany, UK, Italy, France, Spain, Japan, China, India, Australia, New Zealand, South Korea, Rest of Asia Pacific, South America, Argentina, Brazil, Chile, Middle East & Africa, Saudi Arabia, UAE, Qatar, and South Africa |
|
Largest Market |
Asia Pacific |
|
Highest Growing Market |
North America |
According to Stratistics MRC, the Global Beverage Packaging Market is accounted for $158.46 billion in 2022 and is expected to reach $237.81 billion by 2028 growing at a CAGR of 7.0% during the forecast period. Beverage packaging is used to store, preserve, and transport beverages without altering their taste or quality. It entails the use of various materials, such as metal, glass, plastic, and paperboard, to assist avoids spillage and preserves the quality of the drink. Carbonated energy drinks, milk, bottled water, alcohol, and fruit and vegetable juices are some of the most popular beverages. Aside from that, beverage packaging protects the content from moisture and heat, allows for simple mobility, retains aroma, and prevents contamination and loss of key nutrients.
According to a study published in the Lancet journal, alcohol consumption in India increased by 38% from 4.3 to 5.9 liters per capita during 2010 - 2017.
Market Dynamics:
Driver:
Ease & flexibility in transportation offered by different packaging solutions
By designing smart packaging solutions to maximise carrier space and move items efficiently without harm, ease of transportation has always been a priority. Instead of shipping beverages in bulk capacity containers such as drums, single-serve packaging solutions make it easier for customers as well as beverage manufacturers to transport and preserve their products ready to enjoy. As a result, the ease and flexibility in transportation provided by various beverage packaging solutions drives market growth.
Restraint:
Stringent environmental legislation
Packaging waste is harmful to the environment since it takes decades to degrade. Governments around the world are tackling this issue by implementing tough standards that the beverage packaging sector must follow. For instance, governments in Europe take a number of measures to address recycling and packaging waste issues. 'European Parliament and Council Directive 94/62/EC of 20 December 1994 on Packaging and Packaging Waste' is one example of European Commission regulation. This directive includes efforts to reduce packaging waste generation while also encouraging recycling, reuse, and other types of waste recovery.
Opportunity:
Increasing use of biodegradable and renewable raw materials
The growing consumer awareness of environmental safety and the increasing acceptance of eco-friendly products present enormous prospects for beverage packaging product makers. According to a National Retail Federation study, 69% of North American participants are willing to pay a premium for recycled products, while 80% want to know the origin of the products they buy. Bioplastics are polymers made from renewable materials such as corn starch, wood chips, vegetables, and fatty oils.
Threat:
High cost of sustainable packaging
Customers demand sustainable beverage packaging that addresses the health and environmental concerns associated with the usage of synthetic polymers. Beverage packaging firms use their available resources to assure product quality and safety, however the sustainability aspect raises the overall cost of production and consequently affects overall profitability. The rising cost of final packaging may have an impact on sales. As a result, this two-way problem forces businesses to identify a middle road that balances various aspects of sustainability and cost management.
Covid-19 Impact
The COVID-19 pandemic spreads all over the world and increases the number of deaths and long-term health impacts. To overcome this, government-imposed full or partial lockdowns that impact all aspects of the economy. Due to spread of Covid-19, there has been a huge impact on the food supply chain. Due to growing number of deaths, the government had imposed strict regulations and lockdown which affected a lot of economies. The government also developed various policies for these impacts to avoid supply chain disruptions, higher prices for raw materials, and severe economic fallout for employees.
The cartons segment is expected to be the largest during the forecast period
The cartons segment is estimated to have a lucrative growth. Cartons are largely comprised of paperboard, with a thin layer of aluminium and plastic added to help preserve beverages for an extended amount of time. Cartons are in high demand for milk, juice, and other non-alcoholic beverage packaging because they retain the food without the need for a significant amount of preservatives. This packaging allows perishable beverages to be transported to regions without refrigeration or other methods of preservation.
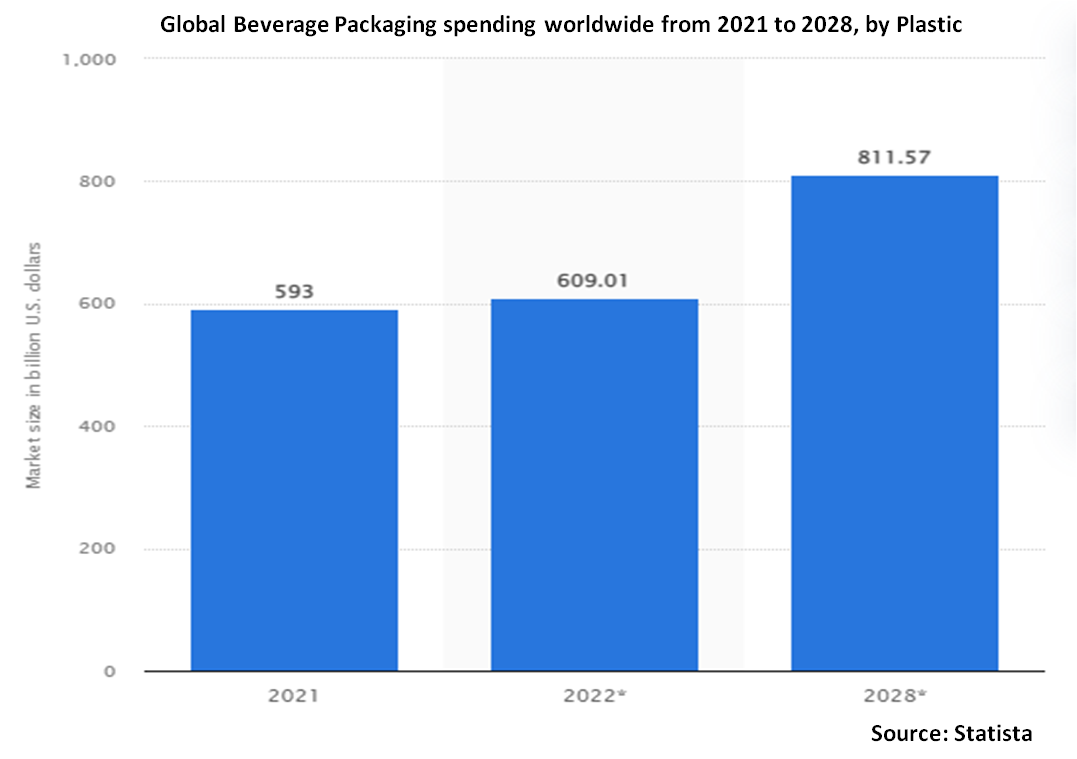
The plastic segment is expected to have the highest CAGR during the forecast period
The plastic segment is anticipated to witness the fastest CAGR growth during the forecast period. The market is experiencing an increase in interest in environmentally friendly and water-soluble plastics. Furthermore, customers are increasingly turning to recycled plastics these days. Increasing environmental awareness is one of the primary elements driving the adoption of recycled plastics for beverage packaging. Plastic packaging has advantages such as container variety, less raw material required, ease of disposal, and lightweight.
Region with highest share:
Asia Pacific is projected to hold the largest market share during the forecast period. The expansion of beverage packaging is mostly linked to the region's expanding need for plastic packaging due to low cost and growing end-user industries. Because of cheap pricing and thriving end-user sectors such as RTD juices, tea and coffee, and bottled water, beverage cans and bottles manufactured of PET are in high demand in the region. The region also has enormous potential due to increased demand for beverage packaging from emerging nations like India and China.
Region with highest CAGR:
North America is projected to have the highest CAGR over the forecast period. The solid manufacturing base of major companies such as Tyson Foods Inc., PepsiCo Inc., Nestle, Coca-Cola Company, Kraft Heinz Co., JBS USA, and Anheuser-Busch InBev in the United States is expected to boost demand for plastic packaging. Furthermore, the rapid expansion of the beverage business in North America as a result of consumers' 'on-the-go' lifestyle is expected to boost regional market growth in the future years.

Key players in the market
Some of the key players profiled in the Beverage Packaging Market include Stora Enso Oyj, Amcor plc, Ball Corporation, Tetra Laval International S.A., Crown Holdings, Inc, Smurfit Kappa Group plc, Mondi plc, Reynolds Group Holdings Limited, Orora Limited, SIG Combibloc Group AG, Toyo Seikan, Ball Corporation, Berry Global Group, Inc, Saint Gobain, Ardagh Group and WestPack.
Key Developments:
In March 2021, Ardagh Group S.A. and Bragg Live Food Products partnered to introduce a new 16oz glass bottle for its line of apple cider vinegar beverages.
In December 2020, Amcor Group GmbH commenced a new venture with Nutrea to deliver its rupro protein juice in a hot-fill (PET) bottle. The new orange juice from Nutrea/Frudelca was available in recyclable bottles in 300ml and 440ml sizes. Amcor was regarded as a critical partner in delivering an innovative packaging solution that met the performance requirements of this new functional venture.
Products Covered:
• Pouches
• Cans
• Bottles
• Cartons
• Other Products
Materials Covered:
• Glass
• Plastic
• Paperboard
• Metal
• Other Materials
Raw Materials Covered:
• Non-Alcoholic Beverages
• Alcoholic Beverages
Regions Covered:
• North America
o US
o Canada
o Mexico
• Europe
o Germany
o UK
o Italy
o France
o Spain
o Rest of Europe
• Asia Pacific
o Japan
o China
o India
o Australia
o New Zealand
o South Korea
o Rest of Asia Pacific
• South America
o Argentina
o Brazil
o Chile
o Rest of South America
• Middle East & Africa
o Saudi Arabia
o UAE
o Qatar
o South Africa
o Rest of Middle East & Africa
What our report offers:
- Market share assessments for the regional and country-level segments
- Strategic recommendations for the new entrants
- Covers Market data for the years 2020, 2021, 2022, 2025, and 2028
- Market Trends (Drivers, Constraints, Opportunities, Threats, Challenges, Investment Opportunities, and recommendations)
- Strategic recommendations in key business segments based on the market estimations
- Competitive landscaping mapping the key common trends
- Company profiling with detailed strategies, financials, and recent developments
- Supply chain trends mapping the latest technological advancements
Free Customization Offerings:
All the customers of this report will be entitled to receive one of the following free customization options:
• Company Profiling
o Comprehensive profiling of additional market players (up to 3)
o SWOT Analysis of key players (up to 3)
• Regional Segmentation
o Market estimations, Forecasts and CAGR of any prominent country as per the client's interest (Note: Depends on feasibility check)
• Competitive Benchmarking
o Benchmarking of key players based on product portfolio, geographical presence, and strategic alliances
Table of Contents
1 Executive Summary
2 Preface
2.1 Abstract
2.2 Stake Holders
2.3 Research Scope
2.4 Research Methodology
2.4.1 Data Mining
2.4.2 Data Analysis
2.4.3 Data Validation
2.4.4 Research Approach
2.5 Research Sources
2.5.1 Primary Research Sources
2.5.2 Secondary Research Sources
2.5.3 Assumptions
3 Market Trend Analysis
3.1 Introduction
3.2 Drivers
3.3 Restraints
3.4 Opportunities
3.5 Threats
3.6 Product Analysis
3.7 Application Analysis
3.8 Emerging Markets
3.9 Impact of Covid-19
4 Porters Five Force Analysis
4.1 Bargaining power of suppliers
4.2 Bargaining power of buyers
4.3 Threat of substitutes
4.4 Threat of new entrants
4.5 Competitive rivalry
5 Global Beverage Packaging Market, By Product
5.1 Introduction
5.2 Pouches
5.3 Cans
5.4 Bottles
5.5 Cartons
5.6 Other Products
6 Global Beverage Packaging Market, By Material
6.1 Introduction
6.2 Glass
6.3 Plastic
6.4 Paperboard
6.5 Metal
6.6 Other Materials
7 Global Beverage Packaging Market, By Application
7.1 Introduction
7.2 Non-Alcoholic Beverages
7.2.1 Energy Drinks
7.2.2 Fruit and Vegetable Juices
7.2.3 Carbonated Drinks
7.2.4 Bottled Water
7.2.5 Plant-based Drinks
7.2.6 Milk
7.2.7 Other Non-Alcoholic Beverages
7.3 Alcoholic Beverages
8 Global Beverage Packaging Market, By Geography
8.1 Introduction
8.2 North America
8.2.1 US
8.2.2 Canada
8.2.3 Mexico
8.3 Europe
8.3.1 Germany
8.3.2 UK
8.3.3 Italy
8.3.4 France
8.3.5 Spain
8.3.6 Rest of Europe
8.4 Asia Pacific
8.4.1 Japan
8.4.2 China
8.4.3 India
8.4.4 Australia
8.4.5 New Zealand
8.4.6 South Korea
8.4.7 Rest of Asia Pacific
8.5 South America
8.5.1 Argentina
8.5.2 Brazil
8.5.3 Chile
8.5.4 Rest of South America
8.6 Middle East & Africa
8.6.1 Saudi Arabia
8.6.2 UAE
8.6.3 Qatar
8.6.4 South Africa
8.6.5 Rest of Middle East & Africa
9 Key Developments
9.1 Agreements, Partnerships, Collaborations and Joint Ventures
9.2 Acquisitions & Mergers
9.3 New Product Launch
9.4 Expansions
9.5 Other Key Strategies
10 Company Profiling
10.1 Stora Enso Oyj
10.2 Amcor plc, Ball Corporation
10.3 Tetra Laval International S.A.
10.4 Crown Holdings, Inc
10.5 Smurfit Kappa Group plc
10.6 Mondi plc
10.7 Reynolds Group Holdings Limited
10.8 Orora Limited
10.9 SIG Combibloc Group AG
10.10 Toyo Seikan
10.11 Ball Corporation
10.12 Berry Global Group, Inc
10.13 Saint Gobain
10.14 Ardagh Group
10.15 WestPack
List of Tables
1 Global Beverage Packaging Market Outlook, By Region (2020-2028) ($MN)
2 Global Beverage Packaging Market Outlook, By Product (2020-2028) ($MN)
3 Global Beverage Packaging Market Outlook, By Pouches (2020-2028) ($MN)
4 Global Beverage Packaging Market Outlook, By Cans (2020-2028) ($MN)
5 Global Beverage Packaging Market Outlook, By Bottles (2020-2028) ($MN)
6 Global Beverage Packaging Market Outlook, By Cartons (2020-2028) ($MN)
7 Global Beverage Packaging Market Outlook, By Other Products (2020-2028) ($MN)
8 Global Beverage Packaging Market Outlook, By Material (2020-2028) ($MN)
9 Global Beverage Packaging Market Outlook, By Glass (2020-2028) ($MN)
10 Global Beverage Packaging Market Outlook, By Plastic (2020-2028) ($MN)
11 Global Beverage Packaging Market Outlook, By Paperboard (2020-2028) ($MN)
12 Global Beverage Packaging Market Outlook, By Metal (2020-2028) ($MN)
13 Global Beverage Packaging Market Outlook, By Other Materials (2020-2028) ($MN)
14 Global Beverage Packaging Market Outlook, By Application (2020-2028) ($MN)
15 Global Beverage Packaging Market Outlook, By Non-Alcoholic Beverages (2020-2028) ($MN)
16 Global Beverage Packaging Market Outlook, By Energy Drinks (2020-2028) ($MN)
17 Global Beverage Packaging Market Outlook, By Fruit and Vegetable Juices (2020-2028) ($MN)
18 Global Beverage Packaging Market Outlook, By Carbonated Drinks (2020-2028) ($MN)
19 Global Beverage Packaging Market Outlook, By Bottled Water (2020-2028) ($MN)
20 Global Beverage Packaging Market Outlook, By Plant-based Drinks (2020-2028) ($MN)
21 Global Beverage Packaging Market Outlook, By Milk (2020-2028) ($MN)
22 Global Beverage Packaging Market Outlook, By Other Non-Alcoholic Beverages (2020-2028) ($MN)
23 Global Beverage Packaging Market Outlook, By Alcoholic Beverages (2020-2028) ($MN)
24 North America Beverage Packaging Market Outlook, By Country (2020-2028) ($MN)
25 North America Beverage Packaging Market Outlook, By Product (2020-2028) ($MN)
26 North America Beverage Packaging Market Outlook, By Pouches (2020-2028) ($MN)
27 North America Beverage Packaging Market Outlook, By Cans (2020-2028) ($MN)
28 North America Beverage Packaging Market Outlook, By Bottles (2020-2028) ($MN)
29 North America Beverage Packaging Market Outlook, By Cartons (2020-2028) ($MN)
30 North America Beverage Packaging Market Outlook, By Other Products (2020-2028) ($MN)
31 North America Beverage Packaging Market Outlook, By Material (2020-2028) ($MN)
32 North America Beverage Packaging Market Outlook, By Glass (2020-2028) ($MN)
33 North America Beverage Packaging Market Outlook, By Plastic (2020-2028) ($MN)
34 North America Beverage Packaging Market Outlook, By Paperboard (2020-2028) ($MN)
35 North America Beverage Packaging Market Outlook, By Metal (2020-2028) ($MN)
36 North America Beverage Packaging Market Outlook, By Other Materials (2020-2028) ($MN)
37 North America Beverage Packaging Market Outlook, By Application (2020-2028) ($MN)
38 North America Beverage Packaging Market Outlook, By Non-Alcoholic Beverages (2020-2028) ($MN)
39 North America Beverage Packaging Market Outlook, By Energy Drinks (2020-2028) ($MN)
40 North America Beverage Packaging Market Outlook, By Fruit and Vegetable Juices (2020-2028) ($MN)
41 North America Beverage Packaging Market Outlook, By Carbonated Drinks (2020-2028) ($MN)
42 North America Beverage Packaging Market Outlook, By Bottled Water (2020-2028) ($MN)
43 North America Beverage Packaging Market Outlook, By Plant-based Drinks (2020-2028) ($MN)
44 North America Beverage Packaging Market Outlook, By Milk (2020-2028) ($MN)
45 North America Beverage Packaging Market Outlook, By Other Non-Alcoholic Beverages (2020-2028) ($MN)
46 North America Beverage Packaging Market Outlook, By Alcoholic Beverages (2020-2028) ($MN)
47 Europe Beverage Packaging Market Outlook, By Country (2020-2028) ($MN)
48 Europe Beverage Packaging Market Outlook, By Product (2020-2028) ($MN)
49 Europe Beverage Packaging Market Outlook, By Pouches (2020-2028) ($MN)
50 Europe Beverage Packaging Market Outlook, By Cans (2020-2028) ($MN)
51 Europe Beverage Packaging Market Outlook, By Bottles (2020-2028) ($MN)
52 Europe Beverage Packaging Market Outlook, By Cartons (2020-2028) ($MN)
53 Europe Beverage Packaging Market Outlook, By Other Products (2020-2028) ($MN)
54 Europe Beverage Packaging Market Outlook, By Material (2020-2028) ($MN)
55 Europe Beverage Packaging Market Outlook, By Glass (2020-2028) ($MN)
56 Europe Beverage Packaging Market Outlook, By Plastic (2020-2028) ($MN)
57 Europe Beverage Packaging Market Outlook, By Paperboard (2020-2028) ($MN)
58 Europe Beverage Packaging Market Outlook, By Metal (2020-2028) ($MN)
59 Europe Beverage Packaging Market Outlook, By Other Materials (2020-2028) ($MN)
60 Europe Beverage Packaging Market Outlook, By Application (2020-2028) ($MN)
61 Europe Beverage Packaging Market Outlook, By Non-Alcoholic Beverages (2020-2028) ($MN)
62 Europe Beverage Packaging Market Outlook, By Energy Drinks (2020-2028) ($MN)
63 Europe Beverage Packaging Market Outlook, By Fruit and Vegetable Juices (2020-2028) ($MN)
64 Europe Beverage Packaging Market Outlook, By Carbonated Drinks (2020-2028) ($MN)
65 Europe Beverage Packaging Market Outlook, By Bottled Water (2020-2028) ($MN)
66 Europe Beverage Packaging Market Outlook, By Plant-based Drinks (2020-2028) ($MN)
67 Europe Beverage Packaging Market Outlook, By Milk (2020-2028) ($MN)
68 Europe Beverage Packaging Market Outlook, By Other Non-Alcoholic Beverages (2020-2028) ($MN)
69 Europe Beverage Packaging Market Outlook, By Alcoholic Beverages (2020-2028) ($MN)
70 Asia Pacific Beverage Packaging Market Outlook, By Country (2020-2028) ($MN)
71 Asia Pacific Beverage Packaging Market Outlook, By Product (2020-2028) ($MN)
72 Asia Pacific Beverage Packaging Market Outlook, By Pouches (2020-2028) ($MN)
73 Asia Pacific Beverage Packaging Market Outlook, By Cans (2020-2028) ($MN)
74 Asia Pacific Beverage Packaging Market Outlook, By Bottles (2020-2028) ($MN)
75 Asia Pacific Beverage Packaging Market Outlook, By Cartons (2020-2028) ($MN)
76 Asia Pacific Beverage Packaging Market Outlook, By Other Products (2020-2028) ($MN)
77 Asia Pacific Beverage Packaging Market Outlook, By Material (2020-2028) ($MN)
78 Asia Pacific Beverage Packaging Market Outlook, By Glass (2020-2028) ($MN)
79 Asia Pacific Beverage Packaging Market Outlook, By Plastic (2020-2028) ($MN)
80 Asia Pacific Beverage Packaging Market Outlook, By Paperboard (2020-2028) ($MN)
81 Asia Pacific Beverage Packaging Market Outlook, By Metal (2020-2028) ($MN)
82 Asia Pacific Beverage Packaging Market Outlook, By Other Materials (2020-2028) ($MN)
83 Asia Pacific Beverage Packaging Market Outlook, By Application (2020-2028) ($MN)
84 Asia Pacific Beverage Packaging Market Outlook, By Non-Alcoholic Beverages (2020-2028) ($MN)
85 Asia Pacific Beverage Packaging Market Outlook, By Energy Drinks (2020-2028) ($MN)
86 Asia Pacific Beverage Packaging Market Outlook, By Fruit and Vegetable Juices (2020-2028) ($MN)
87 Asia Pacific Beverage Packaging Market Outlook, By Carbonated Drinks (2020-2028) ($MN)
88 Asia Pacific Beverage Packaging Market Outlook, By Bottled Water (2020-2028) ($MN)
89 Asia Pacific Beverage Packaging Market Outlook, By Plant-based Drinks (2020-2028) ($MN)
90 Asia Pacific Beverage Packaging Market Outlook, By Milk (2020-2028) ($MN)
91 Asia Pacific Beverage Packaging Market Outlook, By Other Non-Alcoholic Beverages (2020-2028) ($MN)
92 Asia Pacific Beverage Packaging Market Outlook, By Alcoholic Beverages (2020-2028) ($MN)
93 South America Beverage Packaging Market Outlook, By Country (2020-2028) ($MN)
94 South America Beverage Packaging Market Outlook, By Product (2020-2028) ($MN)
95 South America Beverage Packaging Market Outlook, By Pouches (2020-2028) ($MN)
96 South America Beverage Packaging Market Outlook, By Cans (2020-2028) ($MN)
97 South America Beverage Packaging Market Outlook, By Bottles (2020-2028) ($MN)
98 South America Beverage Packaging Market Outlook, By Cartons (2020-2028) ($MN)
99 South America Beverage Packaging Market Outlook, By Other Products (2020-2028) ($MN)
100 South America Beverage Packaging Market Outlook, By Material (2020-2028) ($MN)
101 South America Beverage Packaging Market Outlook, By Glass (2020-2028) ($MN)
102 South America Beverage Packaging Market Outlook, By Plastic (2020-2028) ($MN)
103 South America Beverage Packaging Market Outlook, By Paperboard (2020-2028) ($MN)
104 South America Beverage Packaging Market Outlook, By Metal (2020-2028) ($MN)
105 South America Beverage Packaging Market Outlook, By Other Materials (2020-2028) ($MN)
106 South America Beverage Packaging Market Outlook, By Application (2020-2028) ($MN)
107 South America Beverage Packaging Market Outlook, By Non-Alcoholic Beverages (2020-2028) ($MN)
108 South America Beverage Packaging Market Outlook, By Energy Drinks (2020-2028) ($MN)
109 South America Beverage Packaging Market Outlook, By Fruit and Vegetable Juices (2020-2028) ($MN)
110 South America Beverage Packaging Market Outlook, By Carbonated Drinks (2020-2028) ($MN)
111 South America Beverage Packaging Market Outlook, By Bottled Water (2020-2028) ($MN)
112 South America Beverage Packaging Market Outlook, By Plant-based Drinks (2020-2028) ($MN)
113 South America Beverage Packaging Market Outlook, By Milk (2020-2028) ($MN)
114 South America Beverage Packaging Market Outlook, By Other Non-Alcoholic Beverages (2020-2028) ($MN)
115 South America Beverage Packaging Market Outlook, By Alcoholic Beverages (2020-2028) ($MN)
116 Middle East & Africa Beverage Packaging Market Outlook, By Country (2020-2028) ($MN)
117 Middle East & Africa Beverage Packaging Market Outlook, By Product (2020-2028) ($MN)
118 Middle East & Africa Beverage Packaging Market Outlook, By Pouches (2020-2028) ($MN)
119 Middle East & Africa Beverage Packaging Market Outlook, By Cans (2020-2028) ($MN)
120 Middle East & Africa Beverage Packaging Market Outlook, By Bottles (2020-2028) ($MN)
121 Middle East & Africa Beverage Packaging Market Outlook, By Cartons (2020-2028) ($MN)
122 Middle East & Africa Beverage Packaging Market Outlook, By Other Products (2020-2028) ($MN)
123 Middle East & Africa Beverage Packaging Market Outlook, By Material (2020-2028) ($MN)
124 Middle East & Africa Beverage Packaging Market Outlook, By Glass (2020-2028) ($MN)
125 Middle East & Africa Beverage Packaging Market Outlook, By Plastic (2020-2028) ($MN)
126 Middle East & Africa Beverage Packaging Market Outlook, By Paperboard (2020-2028) ($MN)
127 Middle East & Africa Beverage Packaging Market Outlook, By Metal (2020-2028) ($MN)
128 Middle East & Africa Beverage Packaging Market Outlook, By Other Materials (2020-2028) ($MN)
129 Middle East & Africa Beverage Packaging Market Outlook, By Application (2020-2028) ($MN)
130 Middle East & Africa Beverage Packaging Market Outlook, By Non-Alcoholic Beverages (2020-2028) ($MN)
131 Middle East & Africa Beverage Packaging Market Outlook, By Energy Drinks (2020-2028) ($MN)
132 Middle East & Africa Beverage Packaging Market Outlook, By Fruit and Vegetable Juices (2020-2028) ($MN)
133 Middle East & Africa Beverage Packaging Market Outlook, By Carbonated Drinks (2020-2028) ($MN)
134 Middle East & Africa Beverage Packaging Market Outlook, By Bottled Water (2020-2028) ($MN)
135 Middle East & Africa Beverage Packaging Market Outlook, By Plant-based Drinks (2020-2028) ($MN)
136 Middle East & Africa Beverage Packaging Market Outlook, By Milk (2020-2028) ($MN)
137 Middle East & Africa Beverage Packaging Market Outlook, By Other Non-Alcoholic Beverages (2020-2028) ($MN)
138 Middle East & Africa Beverage Packaging Market Outlook, By Alcoholic Beverages (2020-2028) ($MN)
List of Figures
RESEARCH METHODOLOGY

We at ‘Stratistics’ opt for an extensive research approach which involves data mining, data validation, and data analysis. The various research sources include in-house repository, secondary research, competitor’s sources, social media research, client internal data, and primary research.
Our team of analysts prefers the most reliable and authenticated data sources in order to perform the comprehensive literature search. With access to most of the authenticated data bases our team highly considers the best mix of information through various sources to obtain extensive and accurate analysis.
Each report takes an average time of a month and a team of 4 industry analysts. The time may vary depending on the scope and data availability of the desired market report. The various parameters used in the market assessment are standardized in order to enhance the data accuracy.
Data Mining
The data is collected from several authenticated, reliable, paid and unpaid sources and is filtered depending on the scope & objective of the research. Our reports repository acts as an added advantage in this procedure. Data gathering from the raw material suppliers, distributors and the manufacturers is performed on a regular basis, this helps in the comprehensive understanding of the products value chain. Apart from the above mentioned sources the data is also collected from the industry consultants to ensure the objective of the study is in the right direction.
Market trends such as technological advancements, regulatory affairs, market dynamics (Drivers, Restraints, Opportunities and Challenges) are obtained from scientific journals, market related national & international associations and organizations.
Data Analysis
From the data that is collected depending on the scope & objective of the research the data is subjected for the analysis. The critical steps that we follow for the data analysis include:
- Product Lifecycle Analysis
- Competitor analysis
- Risk analysis
- Porters Analysis
- PESTEL Analysis
- SWOT Analysis
The data engineering is performed by the core industry experts considering both the Marketing Mix Modeling and the Demand Forecasting. The marketing mix modeling makes use of multiple-regression techniques to predict the optimal mix of marketing variables. Regression factor is based on a number of variables and how they relate to an outcome such as sales or profits.
Data Validation
The data validation is performed by the exhaustive primary research from the expert interviews. This includes telephonic interviews, focus groups, face to face interviews, and questionnaires to validate our research from all aspects. The industry experts we approach come from the leading firms, involved in the supply chain ranging from the suppliers, distributors to the manufacturers and consumers so as to ensure an unbiased analysis.
We are in touch with more than 15,000 industry experts with the right mix of consultants, CEO's, presidents, vice presidents, managers, experts from both supply side and demand side, executives and so on.
The data validation involves the primary research from the industry experts belonging to:
- Leading Companies
- Suppliers & Distributors
- Manufacturers
- Consumers
- Industry/Strategic Consultants
Apart from the data validation the primary research also helps in performing the fill gap research, i.e. providing solutions for the unmet needs of the research which helps in enhancing the reports quality.
For more details about research methodology, kindly write to us at info@strategymrc.com
Frequently Asked Questions
In case of any queries regarding this report, you can contact the customer service by filing the “Inquiry Before Buy” form available on the right hand side. You may also contact us through email: info@strategymrc.com or phone: +1-301-202-5929
Yes, the samples are available for all the published reports. You can request them by filling the “Request Sample” option available in this page.
Yes, you can request a sample with your specific requirements. All the customized samples will be provided as per the requirement with the real data masked.
All our reports are available in Digital PDF format. In case if you require them in any other formats, such as PPT, Excel etc you can submit a request through “Inquiry Before Buy” form available on the right hand side. You may also contact us through email: info@strategymrc.com or phone: +1-301-202-5929
We offer a free 15% customization with every purchase. This requirement can be fulfilled for both pre and post sale. You may send your customization requirements through email at info@strategymrc.com or call us on +1-301-202-5929.
We have 3 different licensing options available in electronic format.
- Single User Licence: Allows one person, typically the buyer, to have access to the ordered product. The ordered product cannot be distributed to anyone else.
- 2-5 User Licence: Allows the ordered product to be shared among a maximum of 5 people within your organisation.
- Corporate License: Allows the product to be shared among all employees of your organisation regardless of their geographical location.
All our reports are typically be emailed to you as an attachment.
To order any available report you need to register on our website. The payment can be made either through CCAvenue or PayPal payments gateways which accept all international cards.
We extend our support to 6 months post sale. A post sale customization is also provided to cover your unmet needs in the report.
Request Customization
We provide a free 15% customization on every purchase. This requirement can be fulfilled for both pre and post sale. You may send your customization requirements through email at info@strategymrc.com or call us on +1-301-202-5929.
Note: This customization is absolutely free until it falls under the 15% bracket. If your requirement exceeds this a feasibility check will be performed. Post that, a quote will be provided along with the timelines.
WHY CHOOSE US ?

Assured Quality
Best in class reports with high standard of research integrity

24X7 Research Support
Continuous support to ensure the best customer experience.

Free Customization
Adding more values to your product of interest.

Safe & Secure Access
Providing a secured environment for all online transactions.

Trusted by 600+ Brands
Serving the most reputed brands across the world.