
Lecithin And Phospholipids Market
Lecithin & Phospholipids Market Forecasts to 2028 – Global Analysis By Type (De-Oiled, Modified), Source (Sunflower, Rapeseed & Canola, Egg), Application, and By Geography

|
Years Covered |
2020-2028 |
|
Estimated Year Value (2021) |
US $5.17 BN |
|
Projected Year Value (2028) |
US $9.03 BN |
|
CAGR (2021 - 2028) |
8.3% |
|
Regions Covered |
North America, Europe, Asia Pacific, South America, and Middle East & Africa |
|
Countries Covered |
US, Canada, Mexico, Germany, UK, Italy, France, Spain, Japan, China, India, Australia, New Zealand, South Korea, Rest of Asia Pacific, South America, Argentina, Brazil, Chile, Middle East & Africa, Saudi Arabia, UAE, Qatar, and South Africa |
|
Largest Market |
Asia Pacific |
|
Highest Growing Market |
North America |
According to Stratistics MRC, the Global Lecithin & Phospholipids Market is accounted for $5.17 billion in 2021 and is expected to reach $9.03 billion by 2028 growing at a CAGR of 8.3% during the forecast period. Lecithin is a fat that is essential for the cells in the body. Phospholipids are a class of lipids that are essential parts of the cell membrane.
Market Dynamics:
Driver:
Increasing consumer awareness
Rising consumer awareness regarding the ill effects of the consumption of chemical ingredients and the presence of natural or organic ingredients as alternatives in the market drive the demand for natural food additives. The demand for natural food additives is increasing, due to which manufacturers are launching various products with natural ingredients that can provide an advantage to drive consumption. As lecithin, a type of food emulsifier is of natural origin, it is poised to witness an increase in adoption by the industry, thereby driving its market growth.
Restraint:
Replicability of lecithin & phospholipids
In spite of their significant role in food safety and shelf-life extension, the preference for synthetic emulsifiers over natural emulsifiers such as lecithin & phospholipid is proving to be a challenge for the market. There is limited availability of natural sources. Natural emulsifiers such as lecithin & phospholipids are yet to be manufactured on a larger scale; the commercialization of manufacturing processes of lecithin & phospholipids is also yet to happen.
Opportunity:
Changing consumer lifestyles
The trend of consumer preference for low-fat products is rapidly increasing, and marketing campaigns are planned around highlighting their use and health benefit claims. The demand for low-fat products may be driven by the increase in processed food production and innovation in almost all segments. The demand for the usage of lecithin is likely to grow continually in early adopting countries and exponential growth is projected in new and emerging markets.
Threat:
Fluctuating raw materials prices
Manufacturers of lecithin & phospholipids use egg and plant sources for the production of lecithin & phospholipids. These raw materials are available in large quantities. But, the fluctuating prices of raw materials obstruct the manufacturers’ profit margin. End-use manufacturers, especially food manufacturers, demand high-quality lecithin that can be sourced at low prices. The increase in prices of raw materials subsequently increases the processing cost of lecithin, resulting in a higher selling price.
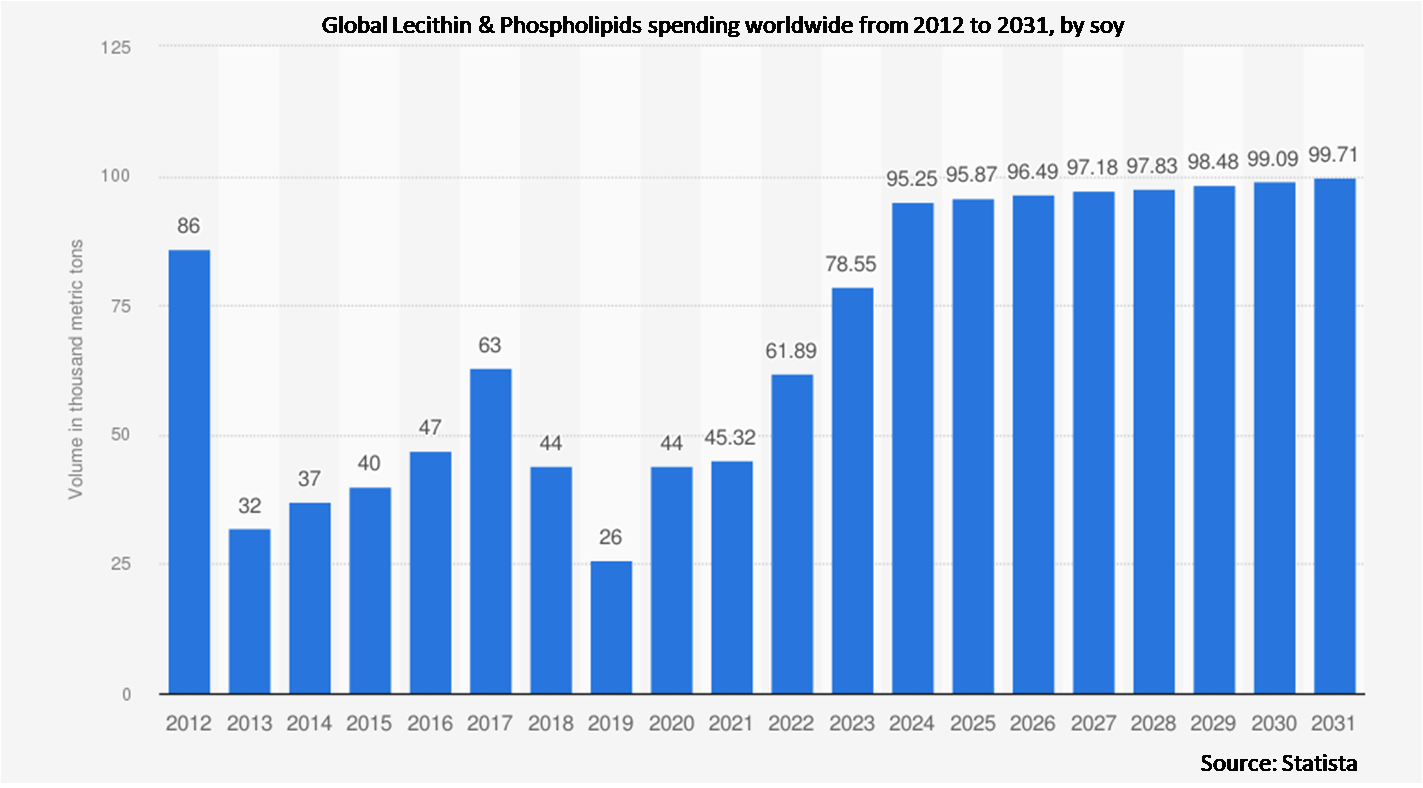
The soy segment is expected to be the largest during the forecast period
The soy segment is estimated to have a lucrative growth as soy is extensively chosen among manufacturers due to the sufficient availability of soybean and the cheap extraction process and it is also used as a replacement for cocoa butter in the chocolate industry, owing to the rising prices of cocoa butter.
The fluid segment is expected to have the highest CAGR during the forecast period
The fluid segment is anticipated to witness the fastest CAGR growth during the forecast period owing to the growing demand for fluid lecithin from the feed industry and industrial applications. Apart from this, fluid lecithin is used in paints, varnishes, and textiles.
Region with highest share:
Asia Pacific is projected to hold the largest market share during the forecast period due to busy lifestyles, urging consumers to opt for on-the-go and RTE products, growing population, and increasing per-capita income of consumers.
Region with highest CAGR:
North America is projected to have the highest CAGR over the forecast period owing to rising demand for cosmetic items and increasing disposable income, which will be complemented by increased demand for skincare and hair care products.

Key players in the market
Some of the key players profiled in the Lecithin & Phospholipids Market include Wilmar International Ltd., VAV Life Sciences Pvt. Ltd., Sun Nutrafoods, American Lecithin Company, DuPont, Sime Darby Oils, Lipoid GmbH, Avril Group, Lasenor Emul, S.L., Kewpie Corporation, IMCD Group B.V., Fismer Lecithin, Sodrugestvo Group, Cargill, Bunge Limited, Sonic Biochem, Lecital, ADM and STERN-WYWIOL GRUPPE.
Key Developments:
In December 2021, IMCD Group B.V. acquired Polychem Handelsges.m.b.H. to serve customers and partners throughout Southeast Europe (SEE). Besides broadening its global network of technical centers by establishing the first laboratory in this region, it provides the opportunity for further regional development in SEE emerging markets.
In November 2021, ADM acquired SOJA PROTEIN. The addition represents a significant expansion of ADM’s global alternative protein capabilities and its ability to meet the growing demand for plant-based foods and beverages.
Types Covered:
• De-Oiled
• Fluid
• Modified
Sources Covered:
• Sunflower
• Soy
• Rapeseed & Canola
• Egg
• Other sources
Natures Covered:
• Non-Genetically Modified Organisms (GMOs)
• Genetically Modified Organisms (GMOs)
Applications Covered:
• Food & Beverages
• Pharmaceuticals
• Nutrition & Supplements
• Industrial
• Healthcare
• Feed
• Other Applications
Regions Covered:
• North America
o US
o Canada
o Mexico
• Europe
o Germany
o UK
o Italy
o France
o Spain
o Rest of Europe
• Asia Pacific
o Japan
o China
o India
o Australia
o New Zealand
o South Korea
o Rest of Asia Pacific
• South America
o Argentina
o Brazil
o Chile
o Rest of South America
• Middle East & Africa
o Saudi Arabia
o UAE
o Qatar
o South Africa
o Rest of Middle East & Africa
What our report offers:
- Market share assessments for the regional and country-level segments
- Strategic recommendations for the new entrants
- Covers Market data for the years 2020, 2021, 2022, 2025, and 2028
- Market Trends (Drivers, Constraints, Opportunities, Threats, Challenges, Investment Opportunities, and recommendations)
- Strategic recommendations in key business segments based on the market estimations
- Competitive landscaping mapping the key common trends
- Company profiling with detailed strategies, financials, and recent developments
- Supply chain trends mapping the latest technological advancements
Free Customization Offerings:
All the customers of this report will be entitled to receive one of the following free customization options:
• Company Profiling
o Comprehensive profiling of additional market players (up to 3)
o SWOT Analysis of key players (up to 3)
• Regional Segmentation
o Market estimations, Forecasts and CAGR of any prominent country as per the client's interest (Note: Depends on feasibility check)
• Competitive Benchmarking
o Benchmarking of key players based on product portfolio, geographical presence, and strategic alliances
Table of Contents
1 Executive Summary
2 Preface
2.1 Abstract
2.2 Stake Holders
2.3 Research Scope
2.4 Research Methodology
2.4.1 Data Mining
2.4.2 Data Analysis
2.4.3 Data Validation
2.4.4 Research Approach
2.5 Research Sources
2.5.1 Primary Research Sources
2.5.2 Secondary Research Sources
2.5.3 Assumptions
3 Market Trend Analysis
3.1 Introduction
3.2 Drivers
3.3 Restraints
3.4 Opportunities
3.5 Threats
3.6 Application Analysis
3.7 Emerging Markets
3.8 Impact of Covid-19
4 Porters Five Force Analysis
4.1 Bargaining power of suppliers
4.2 Bargaining power of buyers
4.3 Threat of substitutes
4.4 Threat of new entrants
4.5 Competitive rivalry
5 Global Lecithin & Phospholipids Market, By Type
5.1 Introduction
5.2 De-Oiled
5.3 Fluid
5.4 Modified
5.4.1 Enzymatic Hydrolysis
5.4.2 Chemical Modification
6 Global Lecithin & Phospholipids Market, By Source
6.1 Introduction
6.2 Sunflower
6.3 Soy
6.4 Rapeseed & Canola
6.5 Egg
6.6 Other sources
6.6.1 Milk
6.6.2 Krill
6.6.3 Corn
7 Global Lecithin & Phospholipids Market, By Nature
7.1 Introduction
7.2 Non-Genetically Modified Organisms (GMOs)
7.3 Genetically Modified Organisms (GMOs)
8 Global Lecithin & Phospholipids Market, By Application
8.1 Introduction
8.2 Food & Beverages
8.2.1 Spreads & Margarine
8.2.2 Convenience Foods
8.2.3 Sauces
8.2.4 Gravies
8.2.5 Fish & Meat
8.2.6 Dairy
8.2.7 Soups
8.2.8 Confectioneries
8.2.9 Bakery Products
8.3 Pharmaceuticals
8.4 Nutrition & Supplements
8.5 Industrial
8.6 Healthcare
8.7 Feed
8.8 Other Applications
8.8.1 Cosmeceuticals
8.8.2 Personal Care Products
9 Global Lecithin & Phospholipids Market, By Geography
9.1 Introduction
9.2 North America
9.2.1 US
9.2.2 Canada
9.2.3 Mexico
9.3 Europe
9.3.1 Germany
9.3.2 UK
9.3.3 Italy
9.3.4 France
9.3.5 Spain
9.3.6 Rest of Europe
9.4 Asia Pacific
9.4.1 Japan
9.4.2 China
9.4.3 India
9.4.4 Australia
9.4.5 New Zealand
9.4.6 South Korea
9.4.7 Rest of Asia Pacific
9.5 South America
9.5.1 Argentina
9.5.2 Brazil
9.5.3 Chile
9.5.4 Rest of South America
9.6 Middle East & Africa
9.6.1 Saudi Arabia
9.6.2 UAE
9.6.3 Qatar
9.6.4 South Africa
9.6.5 Rest of Middle East & Africa
10 Key Developments
10.1 Agreements, Partnerships, Collaborations and Joint Ventures
10.2 Acquisitions & Mergers
10.3 New Product Launch
10.4 Expansions
10.5 Other Key Strategies
13 Company Profiling
13.1 Wilmar International Ltd.
13.2 VAV Life Sciences Pvt. Ltd.
13.3 Sun Nutrafoods
13.4 American Lecithin Company
13.5 DuPont
13.6 Sime Darby Oils
13.7 Lipoid GmbH
13.8 Avril Group
13.9 Lasenor Emul, S.L.,
13.10 Kewpie Corporation
13.11 IMCD Group B.V.
13.12 Fismer Lecithin
13.13 Sodrugestvo Group
13.14 Cargill
13.15 Bunge Limited
13.16 Sonic Biochem
13.17 Lecital
13.18 ADM
13.19 STERN-WYWIOL GRUPPE
List of Tables
1 Global Lecithin & Phospholipids Market Outlook, By Region (2020-2028) ($MN)
2 Global Lecithin & Phospholipids Market Outlook, By Type (2020-2028) ($MN)
3 Global Lecithin & Phospholipids Market Outlook, By De-Oiled (2020-2028) ($MN)
4 Global Lecithin & Phospholipids Market Outlook, By Fluid (2020-2028) ($MN)
5 Global Lecithin & Phospholipids Market Outlook, By Modified (2020-2028) ($MN)
6 Global Lecithin & Phospholipids Market Outlook, By Enzymatic Hydrolysis (2020-2028) ($MN)
7 Global Lecithin & Phospholipids Market Outlook, By Chemical Modification (2020-2028) ($MN)
8 Global Lecithin & Phospholipids Market Outlook, By Source (2020-2028) ($MN)
9 Global Lecithin & Phospholipids Market Outlook, By Sunflower (2020-2028) ($MN)
10 Global Lecithin & Phospholipids Market Outlook, By Soy (2020-2028) ($MN)
11 Global Lecithin & Phospholipids Market Outlook, By Rapeseed & Canola (2020-2028) ($MN)
12 Global Lecithin & Phospholipids Market Outlook, By Egg (2020-2028) ($MN)
13 Global Lecithin & Phospholipids Market Outlook, By Other sources (2020-2028) ($MN)
14 Global Lecithin & Phospholipids Market Outlook, By Milk (2020-2028) ($MN)
15 Global Lecithin & Phospholipids Market Outlook, By Krill (2020-2028) ($MN)
16 Global Lecithin & Phospholipids Market Outlook, By Corn (2020-2028) ($MN)
17 Global Lecithin & Phospholipids Market Outlook, By Nature (2020-2028) ($MN)
18 Global Lecithin & Phospholipids Market Outlook, By Non-Genetically Modified Organisms (GMOs) (2020-2028) ($MN)
19 Global Lecithin & Phospholipids Market Outlook, By Genetically Modified Organisms (GMOs) (2020-2028) ($MN)
20 Global Lecithin & Phospholipids Market Outlook, By Application (2020-2028) ($MN)
21 Global Lecithin & Phospholipids Market Outlook, By Food & Beverages (2020-2028) ($MN)
22 Global Lecithin & Phospholipids Market Outlook, By Spreads & Margarine (2020-2028) ($MN)
23 Global Lecithin & Phospholipids Market Outlook, By Convenience Foods (2020-2028) ($MN)
24 Global Lecithin & Phospholipids Market Outlook, By Sauces (2020-2028) ($MN)
25 Global Lecithin & Phospholipids Market Outlook, By Gravies (2020-2028) ($MN)
26 Global Lecithin & Phospholipids Market Outlook, By Fish & Meat (2020-2028) ($MN)
27 Global Lecithin & Phospholipids Market Outlook, By Dairy (2020-2028) ($MN)
28 Global Lecithin & Phospholipids Market Outlook, By Soups (2020-2028) ($MN)
29 Global Lecithin & Phospholipids Market Outlook, By Confectioneries (2020-2028) ($MN)
30 Global Lecithin & Phospholipids Market Outlook, By Bakery Products (2020-2028) ($MN)
31 Global Lecithin & Phospholipids Market Outlook, By Pharmaceuticals (2020-2028) ($MN)
32 Global Lecithin & Phospholipids Market Outlook, By Nutrition & Supplements (2020-2028) ($MN)
33 Global Lecithin & Phospholipids Market Outlook, By Industrial (2020-2028) ($MN)
34 Global Lecithin & Phospholipids Market Outlook, By Healthcare (2020-2028) ($MN)
35 Global Lecithin & Phospholipids Market Outlook, By Feed (2020-2028) ($MN)
36 Global Lecithin & Phospholipids Market Outlook, By Other Applications (2020-2028) ($MN)
37 Global Lecithin & Phospholipids Market Outlook, By Cosmeceuticals (2020-2028) ($MN)
38 Global Lecithin & Phospholipids Market Outlook, By Personal Care Products (2020-2028) ($MN)
Note: Tables for North America, Europe, APAC, South America, and Middle East & Africa Regions are also represented in the same manner as above.
List of Figures
RESEARCH METHODOLOGY

We at ‘Stratistics’ opt for an extensive research approach which involves data mining, data validation, and data analysis. The various research sources include in-house repository, secondary research, competitor’s sources, social media research, client internal data, and primary research.
Our team of analysts prefers the most reliable and authenticated data sources in order to perform the comprehensive literature search. With access to most of the authenticated data bases our team highly considers the best mix of information through various sources to obtain extensive and accurate analysis.
Each report takes an average time of a month and a team of 4 industry analysts. The time may vary depending on the scope and data availability of the desired market report. The various parameters used in the market assessment are standardized in order to enhance the data accuracy.
Data Mining
The data is collected from several authenticated, reliable, paid and unpaid sources and is filtered depending on the scope & objective of the research. Our reports repository acts as an added advantage in this procedure. Data gathering from the raw material suppliers, distributors and the manufacturers is performed on a regular basis, this helps in the comprehensive understanding of the products value chain. Apart from the above mentioned sources the data is also collected from the industry consultants to ensure the objective of the study is in the right direction.
Market trends such as technological advancements, regulatory affairs, market dynamics (Drivers, Restraints, Opportunities and Challenges) are obtained from scientific journals, market related national & international associations and organizations.
Data Analysis
From the data that is collected depending on the scope & objective of the research the data is subjected for the analysis. The critical steps that we follow for the data analysis include:
- Product Lifecycle Analysis
- Competitor analysis
- Risk analysis
- Porters Analysis
- PESTEL Analysis
- SWOT Analysis
The data engineering is performed by the core industry experts considering both the Marketing Mix Modeling and the Demand Forecasting. The marketing mix modeling makes use of multiple-regression techniques to predict the optimal mix of marketing variables. Regression factor is based on a number of variables and how they relate to an outcome such as sales or profits.
Data Validation
The data validation is performed by the exhaustive primary research from the expert interviews. This includes telephonic interviews, focus groups, face to face interviews, and questionnaires to validate our research from all aspects. The industry experts we approach come from the leading firms, involved in the supply chain ranging from the suppliers, distributors to the manufacturers and consumers so as to ensure an unbiased analysis.
We are in touch with more than 15,000 industry experts with the right mix of consultants, CEO's, presidents, vice presidents, managers, experts from both supply side and demand side, executives and so on.
The data validation involves the primary research from the industry experts belonging to:
- Leading Companies
- Suppliers & Distributors
- Manufacturers
- Consumers
- Industry/Strategic Consultants
Apart from the data validation the primary research also helps in performing the fill gap research, i.e. providing solutions for the unmet needs of the research which helps in enhancing the reports quality.
For more details about research methodology, kindly write to us at info@strategymrc.com
Frequently Asked Questions
In case of any queries regarding this report, you can contact the customer service by filing the “Inquiry Before Buy” form available on the right hand side. You may also contact us through email: info@strategymrc.com or phone: +1-301-202-5929
Yes, the samples are available for all the published reports. You can request them by filling the “Request Sample” option available in this page.
Yes, you can request a sample with your specific requirements. All the customized samples will be provided as per the requirement with the real data masked.
All our reports are available in Digital PDF format. In case if you require them in any other formats, such as PPT, Excel etc you can submit a request through “Inquiry Before Buy” form available on the right hand side. You may also contact us through email: info@strategymrc.com or phone: +1-301-202-5929
We offer a free 15% customization with every purchase. This requirement can be fulfilled for both pre and post sale. You may send your customization requirements through email at info@strategymrc.com or call us on +1-301-202-5929.
We have 3 different licensing options available in electronic format.
- Single User Licence: Allows one person, typically the buyer, to have access to the ordered product. The ordered product cannot be distributed to anyone else.
- 2-5 User Licence: Allows the ordered product to be shared among a maximum of 5 people within your organisation.
- Corporate License: Allows the product to be shared among all employees of your organisation regardless of their geographical location.
All our reports are typically be emailed to you as an attachment.
To order any available report you need to register on our website. The payment can be made either through CCAvenue or PayPal payments gateways which accept all international cards.
We extend our support to 6 months post sale. A post sale customization is also provided to cover your unmet needs in the report.
Request Customization
We provide a free 15% customization on every purchase. This requirement can be fulfilled for both pre and post sale. You may send your customization requirements through email at info@strategymrc.com or call us on +1-301-202-5929.
Note: This customization is absolutely free until it falls under the 15% bracket. If your requirement exceeds this a feasibility check will be performed. Post that, a quote will be provided along with the timelines.
WHY CHOOSE US ?

Assured Quality
Best in class reports with high standard of research integrity

24X7 Research Support
Continuous support to ensure the best customer experience.

Free Customization
Adding more values to your product of interest.

Safe & Secure Access
Providing a secured environment for all online transactions.

Trusted by 600+ Brands
Serving the most reputed brands across the world.