
Active Electronic Components Market
Active Electronic Components Market Forecasts to 2028 - Global Analysis By Product (Semiconductor Devices, Vacuum Tubes, Display Devices and Other Products), End User (Networking & Telecommunication, Consumer Electronics and Other End Users) and Geography

|
Years Covered |
2020-2028 |
|
Estimated Year Value (2022) |
US $338.44 BN |
|
Projected Year Value (2028) |
US $639.90 BN |
|
CAGR (2022 - 2028) |
11.2% |
|
Regions Covered |
North America, Europe, Asia Pacific, South America, and Middle East & Africa |
|
Countries Covered |
US, Canada, Mexico, Germany, UK, Italy, France, Spain, Japan, China, India, Australia, New Zealand, South Korea, Rest of Asia Pacific, South America, Argentina, Brazil, Chile, Middle East & Africa, Saudi Arabia, UAE, Qatar, and South Africa |
|
Largest Market |
North America |
|
Highest Growing Market |
Asia Pacific |
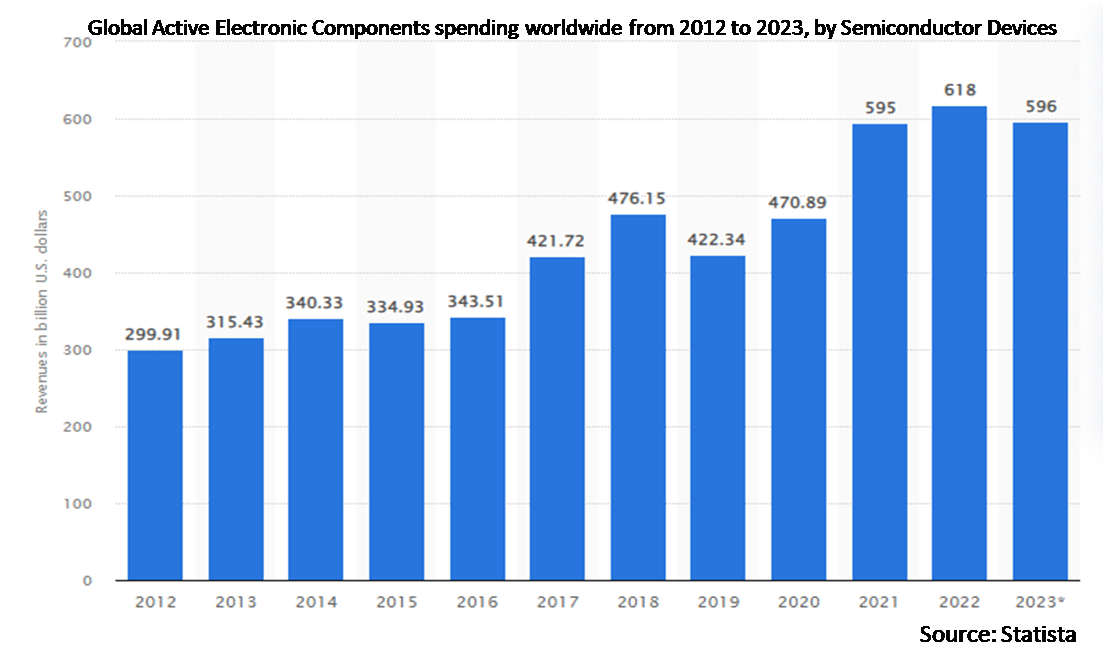
According to Stratistics MRC, the Global Active Electronic Components Market is accounted for $338.44 billion in 2022 and is expected to reach $639.90 billion by 2028 growing at a CAGR of 11.2% during the forecast period. Active electronic components are essential parts of networking and telecom equipment that require an energy source to carry out a specific purpose. Consumer demand for high bandwidth and low latency has increased, which has allowed telecom operators, particularly in developing nations like India, to roll out next-generation 5G network infrastructure. This will increase consumer demand for new IT and telecom equipment and boost product uptake. The main driver of the industry is the constantly expanding demand for consumer electronics devices like smartphones and laptops.
According to the Semiconductor Industry Association, the global semiconductor sales decreased by 3.6% in the first quarter of 2020 due to disruption in supply-chain activities due to COVID-19 pandemic. According to GSMA, there will be approximately 13 billion new IoT connections around the globe in 2025, majorly driven by smart home and smart building verticals. According to the GSM Association, the total number of global 5G connections is projected to surpass 1.8 billion by 2025.
Market Dynamics:
Driver:
Surge in demand for active electronic components in various sectors
Active electronic components were originally only employed in printed circuit boards and consumer devices. However, there has been a surge in the employment of these devices in the military, space & satellite technologies, and automobile applications. Due to rising demand for electric and hybrid vehicles as well as increased usage of renewable energy sources, the market for active electronic components is expanding. Solar turbines, panels, UPSs, and inverters are only a few examples of renewable energy devices or machinery.
Restraint:
Fluctuation in prices
The biggest challenge for these manufacturers is figuring out how to create more electric energy at lower costs than they are presently, taking into account how much raw material prices fluctuate. The costs of the raw resources required to produce this energy fluctuate. They vary greatly during the day and even from day to day. This is a significant barrier to the market for active electronic components' expansion.
Opportunity:
Growing penetration of smartphones
The need for active electronic components has increased as a result of smartphones, other wearable technology, industrial automation, and other factors. Growing demand for active electronic components from the automotive and healthcare sectors, as well as increased technology usage, are driving the market for active electronic components. As vehicles have become more complex and there is a greater demand for high-tech cars, the use of active electronic components has expanded. The industry is expanding as a result of both the rising use of renewable energy sources and active electronic components in consumer goods and wearables. The global use of active electronic components is being fueled by their increasing application in connected devices.
Threat:
High cost of raw materials
The price of the raw materials needed to produce this energy is unstable. They fluctuate significantly during the day as well as from one day to the next. The price of labour is also included in the final price of the item. This is a significant barrier to the growth of the market for active electronic components.
Covid-19 Impact
The production of passive and connected electronic components has been significantly impacted by the COVID-19 outbreak all over the world. Numerous COVID-19 incidents in nations like China, Germany, the U.S., Japan, and South Korea forced the governments to enact restrictions like lockdowns in badly impacted cities, the closing of international trade borders, and allowing businesses to give employees work-from-home options. Due to the temporary closure of production facilities and international borders, a decline in production and exports of electronics components had a substantial negative impact on the market's growth in Q1 and Q2 of 2020.
The semiconductor devices segment is expected to be the largest during the forecast period
The semiconductor devices segment is estimated to have a lucrative growth, due to demand for energy-efficient products and ongoing product innovation are the key drivers of the segment's growth. Transistors, diodes, optoelectronic components, and integrated circuits are further divided under the semiconductor devices category. Out of these, integrated circuits brought in the most money, over USD 90 billion, thanks to the sharp increase in demand for integrated circuits used in cutting-edge products like network devices, laptops, and car automation systems, among others. The growth of the market is attributed to the widespread usage of semiconductor devices in a range of products, including home appliances, personal computers, mobile phones, and network equipment.
The consumer electronics segment is expected to have the highest CAGR during the forecast period
The consumer electronics segment is anticipated to witness the fastest CAGR growth during the forecast period, due to the rising demand for semiconductor devices for different consumer products, including mobile phones, digital cameras, Set-Top Boxes (STB), wearable technology, gaming systems, and others. Additionally, there is a growing need for networking hardware, particularly in the office automation and home application segments. This includes routers, modems, gateways, and repeaters. Thus, during the course of the forecast period, more active electronics components will be used as a result of the rising demand for network devices and other IT hardware.
Region with highest share:
North America is projected to hold the largest market share during the forecast period owing to that U.S. federal government is making significant investments in the development of smart cities all around the nation. Micro-electromechanical systems (MEMS) and renewable energy sources are largely to blame for the rise. Additionally, the region's rising demand for portable electronics serves as the primary driver of the market for active electronic components. In addition to this, the growing U.S. trend toward smart homes and linked cars has created new opportunities for regional telecom operators to invest significantly in the construction of 5G network infrastructure.
Region with highest CAGR:
Asia Pacific is projected to have the highest CAGR over the forecast period, owing to the presence of a sizable consumer electronics industry in the area is credited with driving market expansion in APAC. It is home to well-known producers of consumer electronics, including Xiaomi Corp., BBK electronics (which includes brands like Vivo, Oppo, and Realme), and Samsung Electronics Co., Ltd. Additionally, growing nations like India, China, and South Africa are experiencing a sharp rise in demand for a number of industrial automation systems, including SCADA and Programmable Logic Controllers (PLCs) that are built with electronic systems. The demand for the products in the area will then be driven by this.

Key players in the market
Some of the key players profiled in the Active Electronic Components Market include Microchip Technology, Inc., Qualcomm, Inc., NXP Semiconductors NV, Infineon Technologies AG, Toshiba Corp., Intel Corp., Maxim Integrated, Texas Instruments, Inc., Analog Devices, Inc., Broadcom, Inc., Advanced Micro Devices, Monolithic Power Systems, Inc., Fairchild Semiconductor International, Inc., ST Microelectronics NV, Diotec Semiconductor AG, ON Semiconductor, Everlight Electronics Co., Ltd., Panasonic Corporation, Vishay Intertechnology, Inc. and Renesas Electric Corporation.
Key Developments:
In September 2019, NXP Semiconductors N.V. presented a protected fine-going chipset, 'SR100T'. This chipset is principally intended for cutting edge Ultra-Wide Band (UWB)- empowered cell phones to give profoundly exact situating execution. Nonetheless, a few players are zeroing in on consolidations and acquisitions to reinforce their general market presence.
In June 2019, Infineon Technologies AG gained Cypress Semiconductor Corp. to reinforce its item offering and market position.
In July 2016, Infineon Technologies AG declared to get R.F. power and Wolf speed Power divisions of Cree Inc. The arrangement assisted Infineon with reinforcing its impression in the semiconductor industry. With this obtaining, the Company has gone into the rundown of driving providers of force and R.F. power arrangements in developing business sectors, for example, renewables, electro-versatility, and cutting edge 5G framework pertinent for IoT.
Products Covered:
• Semiconductor Devices
• Vacuum Tubes
• Display Devices
• Other Products
End Users Covered:
• Networking & Telecommunication
• Consumer Electronics
• Aerospace & Defense
• Automotive
• Healthcare
• Manufacturing
• Other End Users
Regions Covered:
• North America
o US
o Canada
o Mexico
• Europe
o Germany
o UK
o Italy
o France
o Spain
o Rest of Europe
• Asia Pacific
o Japan
o China
o India
o Australia
o New Zealand
o South Korea
o Rest of Asia Pacific
• South America
o Argentina
o Brazil
o Chile
o Rest of South America
• Middle East & Africa
o Saudi Arabia
o UAE
o Qatar
o South Africa
o Rest of Middle East & Africa
What our report offers:
- Market share assessments for the regional and country-level segments
- Strategic recommendations for the new entrants
- Covers Market data for the years 2020, 2021, 2022, 2025, and 2028
- Market Trends (Drivers, Constraints, Opportunities, Threats, Challenges, Investment Opportunities, and recommendations)
- Strategic recommendations in key business segments based on the market estimations
- Competitive landscaping mapping the key common trends
- Company profiling with detailed strategies, financials, and recent developments
- Supply chain trends mapping the latest technological advancements
Free Customization Offerings:
All the customers of this report will be entitled to receive one of the following free customization options:
• Company Profiling
o Comprehensive profiling of additional market players (up to 3)
o SWOT Analysis of key players (up to 3)
• Regional Segmentation
o Market estimations, Forecasts and CAGR of any prominent country as per the client's interest (Note: Depends on feasibility check)
• Competitive Benchmarking
o Benchmarking of key players based on product portfolio, geographical presence, and strategic alliances
Table of Contents
1 Executive Summary
2 Preface
2.1 Abstract
2.2 Stake Holders
2.3 Research Scope
2.4 Research Methodology
2.4.1 Data Mining
2.4.2 Data Analysis
2.4.3 Data Validation
2.4.4 Research Approach
2.5 Research Sources
2.5.1 Primary Research Sources
2.5.2 Secondary Research Sources
2.5.3 Assumptions
3 Market Trend Analysis
3.1 Introduction
3.2 Drivers
3.3 Restraints
3.4 Opportunities
3.5 Threats
3.6 Product Analysis
3.7 End User Analysis
3.8 Emerging Markets
3.9 Impact of Covid-19
4 Porters Five Force Analysis
4.1 Bargaining power of suppliers
4.2 Bargaining power of buyers
4.3 Threat of substitutes
4.4 Threat of new entrants
4.5 Competitive rivalry
5 Global Active Electronic Components Market, By Product
5.1 Introduction
5.2 Semiconductor Devices
5.2.1 Diodes
5.2.2 Optoelectronics
5.2.3 Transistors
5.2.4 Integrated Circuits (ICs)
5.3 Vacuum Tubes
5.4 Display Devices
5.4.1 Microwave Tubes
5.4.2 X-ray Tubes
5.4.3 Cathode-ray Tubes
5.4.4 Triodes
5.4.5 Photoelectric Tubes
5.5 Other Products
6 Global Active Electronic Components Market, By End User
6.1 Introduction
6.2 Networking & Telecommunication
6.3 Consumer Electronics
6.4 Aerospace & Defense
6.5 Automotive
6.6 Healthcare
6.7 Manufacturing
6.8 Other End Users
7 Global Active Electronic Components Market, By Geography
7.1 Introduction
7.2 North America
7.2.1 US
7.2.2 Canada
7.2.3 Mexico
7.3 Europe
7.3.1 Germany
7.3.2 UK
7.3.3 Italy
7.3.4 France
7.3.5 Spain
7.3.6 Rest of Europe
7.4 Asia Pacific
7.4.1 Japan
7.4.2 China
7.4.3 India
7.4.4 Australia
7.4.5 New Zealand
7.4.6 South Korea
7.4.7 Rest of Asia Pacific
7.5 South America
7.5.1 Argentina
7.5.2 Brazil
7.5.3 Chile
7.5.4 Rest of South America
7.6 Middle East & Africa
7.6.1 Saudi Arabia
7.6.2 UAE
7.6.3 Qatar
7.6.4 South Africa
7.6.5 Rest of Middle East & Africa
8 Key Developments
8.1 Agreements, Partnerships, Collaborations and Joint Ventures
8.2 Acquisitions & Mergers
8.3 New Product Launch
8.4 Expansions
8.5 Other Key Strategies
9 Company Profiling
9.1 Microchip Technology, Inc.
9.2 Qualcomm, Inc.
9.3 NXP Semiconductors NV
9.4 Infineon Technologies AG
9.5 Toshiba Corp.
9.6 Intel Corp.
9.7 Maxim Integrated
9.8 Texas Instruments, Inc.
9.9 Analog Devices, Inc.
9.10 Broadcom, Inc.
9.11 Advanced Micro Devices
9.12 Monolithic Power Systems, Inc.
9.13 Fairchild Semiconductor International, Inc.
9.14 ST Microelectronics NV
9.15 Diotec Semiconductor AG
9.16 ON Semiconductor
9.17 Everlight Electronics Co., Ltd.
9.18 Panasonic Corporation
9.19 Vishay Intertechnology, Inc.
9.20 Renesas Electric Corporation
List of Tables
1 Global Active Electronic Components Market Outlook, By Region (2020-2028) ($MN)
2 Global Active Electronic Components Market Outlook, By Product (2020-2028) ($MN)
3 Global Active Electronic Components Market Outlook, By Semiconductor Devices (2020-2028) ($MN)
4 Global Active Electronic Components Market Outlook, By Diodes (2020-2028) ($MN)
5 Global Active Electronic Components Market Outlook, By Optoelectronics (2020-2028) ($MN)
6 Global Active Electronic Components Market Outlook, By Transistors (2020-2028) ($MN)
7 Global Active Electronic Components Market Outlook, By Integrated Circuits (ICs) (2020-2028) ($MN)
8 Global Active Electronic Components Market Outlook, By Vacuum Tubes (2020-2028) ($MN)
9 Global Active Electronic Components Market Outlook, By Display Devices (2020-2028) ($MN)
10 Global Active Electronic Components Market Outlook, By Microwave Tubes (2020-2028) ($MN)
11 Global Active Electronic Components Market Outlook, By X-ray Tubes (2020-2028) ($MN)
12 Global Active Electronic Components Market Outlook, By Cathode-ray Tubes (2020-2028) ($MN)
13 Global Active Electronic Components Market Outlook, By Triodes (2020-2028) ($MN)
14 Global Active Electronic Components Market Outlook, By Photoelectric Tubes (2020-2028) ($MN)
15 Global Active Electronic Components Market Outlook, By Other Products (2020-2028) ($MN)
16 Global Active Electronic Components Market Outlook, By End User (2020-2028) ($MN)
17 Global Active Electronic Components Market Outlook, By Networking & Telecommunication (2020-2028) ($MN)
18 Global Active Electronic Components Market Outlook, By Consumer Electronics (2020-2028) ($MN)
19 Global Active Electronic Components Market Outlook, By Aerospace & Defense (2020-2028) ($MN)
20 Global Active Electronic Components Market Outlook, By Automotive (2020-2028) ($MN)
21 Global Active Electronic Components Market Outlook, By Healthcare (2020-2028) ($MN)
22 Global Active Electronic Components Market Outlook, By Manufacturing (2020-2028) ($MN)
23 Global Active Electronic Components Market Outlook, By Other End Users (2020-2028) ($MN)
24 North America Active Electronic Components Market Outlook, By Country (2020-2028) ($MN)
25 North America Active Electronic Components Market Outlook, By Product (2020-2028) ($MN)
26 North America Active Electronic Components Market Outlook, By Semiconductor Devices (2020-2028) ($MN)
27 North America Active Electronic Components Market Outlook, By Diodes (2020-2028) ($MN)
28 North America Active Electronic Components Market Outlook, By Optoelectronics (2020-2028) ($MN)
29 North America Active Electronic Components Market Outlook, By Transistors (2020-2028) ($MN)
30 North America Active Electronic Components Market Outlook, By Integrated Circuits (ICs) (2020-2028) ($MN)
31 North America Active Electronic Components Market Outlook, By Vacuum Tubes (2020-2028) ($MN)
32 North America Active Electronic Components Market Outlook, By Display Devices (2020-2028) ($MN)
33 North America Active Electronic Components Market Outlook, By Microwave Tubes (2020-2028) ($MN)
34 North America Active Electronic Components Market Outlook, By X-ray Tubes (2020-2028) ($MN)
35 North America Active Electronic Components Market Outlook, By Cathode-ray Tubes (2020-2028) ($MN)
36 North America Active Electronic Components Market Outlook, By Triodes (2020-2028) ($MN)
37 North America Active Electronic Components Market Outlook, By Photoelectric Tubes (2020-2028) ($MN)
38 North America Active Electronic Components Market Outlook, By Other Products (2020-2028) ($MN)
39 North America Active Electronic Components Market Outlook, By End User (2020-2028) ($MN)
40 North America Active Electronic Components Market Outlook, By Networking & Telecommunication (2020-2028) ($MN)
41 North America Active Electronic Components Market Outlook, By Consumer Electronics (2020-2028) ($MN)
42 North America Active Electronic Components Market Outlook, By Aerospace & Defense (2020-2028) ($MN)
43 North America Active Electronic Components Market Outlook, By Automotive (2020-2028) ($MN)
44 North America Active Electronic Components Market Outlook, By Healthcare (2020-2028) ($MN)
45 North America Active Electronic Components Market Outlook, By Manufacturing (2020-2028) ($MN)
46 North America Active Electronic Components Market Outlook, By Other End Users (2020-2028) ($MN)
47 Europe Active Electronic Components Market Outlook, By Country (2020-2028) ($MN)
48 Europe Active Electronic Components Market Outlook, By Product (2020-2028) ($MN)
49 Europe Active Electronic Components Market Outlook, By Semiconductor Devices (2020-2028) ($MN)
50 Europe Active Electronic Components Market Outlook, By Diodes (2020-2028) ($MN)
51 Europe Active Electronic Components Market Outlook, By Optoelectronics (2020-2028) ($MN)
52 Europe Active Electronic Components Market Outlook, By Transistors (2020-2028) ($MN)
53 Europe Active Electronic Components Market Outlook, By Integrated Circuits (ICs) (2020-2028) ($MN)
54 Europe Active Electronic Components Market Outlook, By Vacuum Tubes (2020-2028) ($MN)
55 Europe Active Electronic Components Market Outlook, By Display Devices (2020-2028) ($MN)
56 Europe Active Electronic Components Market Outlook, By Microwave Tubes (2020-2028) ($MN)
57 Europe Active Electronic Components Market Outlook, By X-ray Tubes (2020-2028) ($MN)
58 Europe Active Electronic Components Market Outlook, By Cathode-ray Tubes (2020-2028) ($MN)
59 Europe Active Electronic Components Market Outlook, By Triodes (2020-2028) ($MN)
60 Europe Active Electronic Components Market Outlook, By Photoelectric Tubes (2020-2028) ($MN)
61 Europe Active Electronic Components Market Outlook, By Other Products (2020-2028) ($MN)
62 Europe Active Electronic Components Market Outlook, By End User (2020-2028) ($MN)
63 Europe Active Electronic Components Market Outlook, By Networking & Telecommunication (2020-2028) ($MN)
64 Europe Active Electronic Components Market Outlook, By Consumer Electronics (2020-2028) ($MN)
65 Europe Active Electronic Components Market Outlook, By Aerospace & Defense (2020-2028) ($MN)
66 Europe Active Electronic Components Market Outlook, By Automotive (2020-2028) ($MN)
67 Europe Active Electronic Components Market Outlook, By Healthcare (2020-2028) ($MN)
68 Europe Active Electronic Components Market Outlook, By Manufacturing (2020-2028) ($MN)
69 Europe Active Electronic Components Market Outlook, By Other End Users (2020-2028) ($MN)
70 Asia Pacific Active Electronic Components Market Outlook, By Country (2020-2028) ($MN)
71 Asia Pacific Active Electronic Components Market Outlook, By Product (2020-2028) ($MN)
72 Asia Pacific Active Electronic Components Market Outlook, By Semiconductor Devices (2020-2028) ($MN)
73 Asia Pacific Active Electronic Components Market Outlook, By Diodes (2020-2028) ($MN)
74 Asia Pacific Active Electronic Components Market Outlook, By Optoelectronics (2020-2028) ($MN)
75 Asia Pacific Active Electronic Components Market Outlook, By Transistors (2020-2028) ($MN)
76 Asia Pacific Active Electronic Components Market Outlook, By Integrated Circuits (ICs) (2020-2028) ($MN)
77 Asia Pacific Active Electronic Components Market Outlook, By Vacuum Tubes (2020-2028) ($MN)
78 Asia Pacific Active Electronic Components Market Outlook, By Display Devices (2020-2028) ($MN)
79 Asia Pacific Active Electronic Components Market Outlook, By Microwave Tubes (2020-2028) ($MN)
80 Asia Pacific Active Electronic Components Market Outlook, By X-ray Tubes (2020-2028) ($MN)
81 Asia Pacific Active Electronic Components Market Outlook, By Cathode-ray Tubes (2020-2028) ($MN)
82 Asia Pacific Active Electronic Components Market Outlook, By Triodes (2020-2028) ($MN)
83 Asia Pacific Active Electronic Components Market Outlook, By Photoelectric Tubes (2020-2028) ($MN)
84 Asia Pacific Active Electronic Components Market Outlook, By Other Products (2020-2028) ($MN)
85 Asia Pacific Active Electronic Components Market Outlook, By End User (2020-2028) ($MN)
86 Asia Pacific Active Electronic Components Market Outlook, By Networking & Telecommunication (2020-2028) ($MN)
87 Asia Pacific Active Electronic Components Market Outlook, By Consumer Electronics (2020-2028) ($MN)
88 Asia Pacific Active Electronic Components Market Outlook, By Aerospace & Defense (2020-2028) ($MN)
89 Asia Pacific Active Electronic Components Market Outlook, By Automotive (2020-2028) ($MN)
90 Asia Pacific Active Electronic Components Market Outlook, By Healthcare (2020-2028) ($MN)
91 Asia Pacific Active Electronic Components Market Outlook, By Manufacturing (2020-2028) ($MN)
92 Asia Pacific Active Electronic Components Market Outlook, By Other End Users (2020-2028) ($MN)
93 South America Active Electronic Components Market Outlook, By Country (2020-2028) ($MN)
94 South America Active Electronic Components Market Outlook, By Product (2020-2028) ($MN)
95 South America Active Electronic Components Market Outlook, By Semiconductor Devices (2020-2028) ($MN)
96 South America Active Electronic Components Market Outlook, By Diodes (2020-2028) ($MN)
97 South America Active Electronic Components Market Outlook, By Optoelectronics (2020-2028) ($MN)
98 South America Active Electronic Components Market Outlook, By Transistors (2020-2028) ($MN)
99 South America Active Electronic Components Market Outlook, By Integrated Circuits (ICs) (2020-2028) ($MN)
100 South America Active Electronic Components Market Outlook, By Vacuum Tubes (2020-2028) ($MN)
101 South America Active Electronic Components Market Outlook, By Display Devices (2020-2028) ($MN)
102 South America Active Electronic Components Market Outlook, By Microwave Tubes (2020-2028) ($MN)
103 South America Active Electronic Components Market Outlook, By X-ray Tubes (2020-2028) ($MN)
104 South America Active Electronic Components Market Outlook, By Cathode-ray Tubes (2020-2028) ($MN)
105 South America Active Electronic Components Market Outlook, By Triodes (2020-2028) ($MN)
106 South America Active Electronic Components Market Outlook, By Photoelectric Tubes (2020-2028) ($MN)
107 South America Active Electronic Components Market Outlook, By Other Products (2020-2028) ($MN)
108 South America Active Electronic Components Market Outlook, By End User (2020-2028) ($MN)
109 South America Active Electronic Components Market Outlook, By Networking & Telecommunication (2020-2028) ($MN)
110 South America Active Electronic Components Market Outlook, By Consumer Electronics (2020-2028) ($MN)
111 South America Active Electronic Components Market Outlook, By Aerospace & Defense (2020-2028) ($MN)
112 South America Active Electronic Components Market Outlook, By Automotive (2020-2028) ($MN)
113 South America Active Electronic Components Market Outlook, By Healthcare (2020-2028) ($MN)
114 South America Active Electronic Components Market Outlook, By Manufacturing (2020-2028) ($MN)
115 South America Active Electronic Components Market Outlook, By Other End Users (2020-2028) ($MN)
116 Middle East & Africa Active Electronic Components Market Outlook, By Country (2020-2028) ($MN)
117 Middle East & Africa Active Electronic Components Market Outlook, By Product (2020-2028) ($MN)
118 Middle East & Africa Active Electronic Components Market Outlook, By Semiconductor Devices (2020-2028) ($MN)
119 Middle East & Africa Active Electronic Components Market Outlook, By Diodes (2020-2028) ($MN)
120 Middle East & Africa Active Electronic Components Market Outlook, By Optoelectronics (2020-2028) ($MN)
121 Middle East & Africa Active Electronic Components Market Outlook, By Transistors (2020-2028) ($MN)
122 Middle East & Africa Active Electronic Components Market Outlook, By Integrated Circuits (ICs) (2020-2028) ($MN)
123 Middle East & Africa Active Electronic Components Market Outlook, By Vacuum Tubes (2020-2028) ($MN)
124 Middle East & Africa Active Electronic Components Market Outlook, By Display Devices (2020-2028) ($MN)
125 Middle East & Africa Active Electronic Components Market Outlook, By Microwave Tubes (2020-2028) ($MN)
126 Middle East & Africa Active Electronic Components Market Outlook, By X-ray Tubes (2020-2028) ($MN)
127 Middle East & Africa Active Electronic Components Market Outlook, By Cathode-ray Tubes (2020-2028) ($MN)
128 Middle East & Africa Active Electronic Components Market Outlook, By Triodes (2020-2028) ($MN)
129 Middle East & Africa Active Electronic Components Market Outlook, By Photoelectric Tubes (2020-2028) ($MN)
130 Middle East & Africa Active Electronic Components Market Outlook, By Other Products (2020-2028) ($MN)
131 Middle East & Africa Active Electronic Components Market Outlook, By End User (2020-2028) ($MN)
132 Middle East & Africa Active Electronic Components Market Outlook, By Networking & Telecommunication (2020-2028) ($MN)
133 Middle East & Africa Active Electronic Components Market Outlook, By Consumer Electronics (2020-2028) ($MN)
134 Middle East & Africa Active Electronic Components Market Outlook, By Aerospace & Defense (2020-2028) ($MN)
135 Middle East & Africa Active Electronic Components Market Outlook, By Automotive (2020-2028) ($MN)
136 Middle East & Africa Active Electronic Components Market Outlook, By Healthcare (2020-2028) ($MN)
137 Middle East & Africa Active Electronic Components Market Outlook, By Manufacturing (2020-2028) ($MN)
138 Middle East & Africa Active Electronic Components Market Outlook, By Other End Users (2020-2028) ($MN)
List of Figures
RESEARCH METHODOLOGY

We at ‘Stratistics’ opt for an extensive research approach which involves data mining, data validation, and data analysis. The various research sources include in-house repository, secondary research, competitor’s sources, social media research, client internal data, and primary research.
Our team of analysts prefers the most reliable and authenticated data sources in order to perform the comprehensive literature search. With access to most of the authenticated data bases our team highly considers the best mix of information through various sources to obtain extensive and accurate analysis.
Each report takes an average time of a month and a team of 4 industry analysts. The time may vary depending on the scope and data availability of the desired market report. The various parameters used in the market assessment are standardized in order to enhance the data accuracy.
Data Mining
The data is collected from several authenticated, reliable, paid and unpaid sources and is filtered depending on the scope & objective of the research. Our reports repository acts as an added advantage in this procedure. Data gathering from the raw material suppliers, distributors and the manufacturers is performed on a regular basis, this helps in the comprehensive understanding of the products value chain. Apart from the above mentioned sources the data is also collected from the industry consultants to ensure the objective of the study is in the right direction.
Market trends such as technological advancements, regulatory affairs, market dynamics (Drivers, Restraints, Opportunities and Challenges) are obtained from scientific journals, market related national & international associations and organizations.
Data Analysis
From the data that is collected depending on the scope & objective of the research the data is subjected for the analysis. The critical steps that we follow for the data analysis include:
- Product Lifecycle Analysis
- Competitor analysis
- Risk analysis
- Porters Analysis
- PESTEL Analysis
- SWOT Analysis
The data engineering is performed by the core industry experts considering both the Marketing Mix Modeling and the Demand Forecasting. The marketing mix modeling makes use of multiple-regression techniques to predict the optimal mix of marketing variables. Regression factor is based on a number of variables and how they relate to an outcome such as sales or profits.
Data Validation
The data validation is performed by the exhaustive primary research from the expert interviews. This includes telephonic interviews, focus groups, face to face interviews, and questionnaires to validate our research from all aspects. The industry experts we approach come from the leading firms, involved in the supply chain ranging from the suppliers, distributors to the manufacturers and consumers so as to ensure an unbiased analysis.
We are in touch with more than 15,000 industry experts with the right mix of consultants, CEO's, presidents, vice presidents, managers, experts from both supply side and demand side, executives and so on.
The data validation involves the primary research from the industry experts belonging to:
- Leading Companies
- Suppliers & Distributors
- Manufacturers
- Consumers
- Industry/Strategic Consultants
Apart from the data validation the primary research also helps in performing the fill gap research, i.e. providing solutions for the unmet needs of the research which helps in enhancing the reports quality.
For more details about research methodology, kindly write to us at info@strategymrc.com
Frequently Asked Questions
In case of any queries regarding this report, you can contact the customer service by filing the “Inquiry Before Buy” form available on the right hand side. You may also contact us through email: info@strategymrc.com or phone: +1-301-202-5929
Yes, the samples are available for all the published reports. You can request them by filling the “Request Sample” option available in this page.
Yes, you can request a sample with your specific requirements. All the customized samples will be provided as per the requirement with the real data masked.
All our reports are available in Digital PDF format. In case if you require them in any other formats, such as PPT, Excel etc you can submit a request through “Inquiry Before Buy” form available on the right hand side. You may also contact us through email: info@strategymrc.com or phone: +1-301-202-5929
We offer a free 15% customization with every purchase. This requirement can be fulfilled for both pre and post sale. You may send your customization requirements through email at info@strategymrc.com or call us on +1-301-202-5929.
We have 3 different licensing options available in electronic format.
- Single User Licence: Allows one person, typically the buyer, to have access to the ordered product. The ordered product cannot be distributed to anyone else.
- 2-5 User Licence: Allows the ordered product to be shared among a maximum of 5 people within your organisation.
- Corporate License: Allows the product to be shared among all employees of your organisation regardless of their geographical location.
All our reports are typically be emailed to you as an attachment.
To order any available report you need to register on our website. The payment can be made either through CCAvenue or PayPal payments gateways which accept all international cards.
We extend our support to 6 months post sale. A post sale customization is also provided to cover your unmet needs in the report.
Request Customization
We provide a free 15% customization on every purchase. This requirement can be fulfilled for both pre and post sale. You may send your customization requirements through email at info@strategymrc.com or call us on +1-301-202-5929.
Note: This customization is absolutely free until it falls under the 15% bracket. If your requirement exceeds this a feasibility check will be performed. Post that, a quote will be provided along with the timelines.
WHY CHOOSE US ?

Assured Quality
Best in class reports with high standard of research integrity

24X7 Research Support
Continuous support to ensure the best customer experience.

Free Customization
Adding more values to your product of interest.

Safe & Secure Access
Providing a secured environment for all online transactions.

Trusted by 600+ Brands
Serving the most reputed brands across the world.