
Agritourism Market
Agritourism Market Forecasts to 2028 - Global Analysis By Tour Type (Individual Travelers and Group Travelers), Activity (Outdoor Recreation, Entertainment, Accommodations, Educational Tourism, On-farm Sales and Other Activities), Sales Channel and By Geography

|
Years Covered |
2020-2028 |
|
Estimated Year Value (2022) |
US $6.74 BN |
|
Projected Year Value (2028) |
US $14.34 BN |
|
CAGR (2022 - 2028) |
13.4% |
|
Regions Covered |
North America, Europe, Asia Pacific, South America, and Middle East & Africa |
|
Countries Covered |
US, Canada, Mexico, Germany, UK, Italy, France, Spain, Japan, China, India, Australia, New Zealand, South Korea, Rest of Asia Pacific, South America, Argentina, Brazil, Chile, Middle East & Africa, Saudi Arabia, UAE, Qatar, and South Africa |
|
Largest Market |
North America |
|
Highest Growing Market |
Asia Pacific |
According to Stratistics MRC, the Global Agritourism Market is accounted for $6.74 billion in 2022 and is expected to reach $14.34 billion by 2028 growing at a CAGR of 13.4% during the forecast period. Agritourism refers to businesses that mix farm operations and tourism for the aim of enjoyment and amusement. It is commonly characterized as visiting a working agricultural area for leisure, amusement, or educational purposes. These frequently involve leisure pursuits that take place on farms. Agritourism is a part of tourism activities. It allows tourists to deepen their understanding of agriculture and elevate the special rural regions, although it is rarely regarded as farm or rural tourism. In terms of a strategy for safeguarding agricultural capitals and bringing about economic and social advantages, agritourism is largely supported.
According to the World Tourism Organization's most recent data, the overwhelming effects of COVID-19 on the industry caused international visitor arrivals to drop by 93.0% in June as compared to the same month in 2019.
Market Dynamics:
Driver:
Growing travel and tourism industry
Agritourism is a subcategory of rural tourism, and rural tourism accounts for a significant portion of travel and tourism. During the projected period, the expansion of the travel and tourism sector is anticipated to boost the growth of the agritourism market. For instance, 1,500 million worldwide visitor arrivals were registered in 2018, up from 1,440 million, according to the World Tourism Organization. Tourists are drawn to agritourism hubs by the rising popularity of agritourism activities including farm stays, agritainment, and outdoor leisure. As a result, the reasons listed above fuel market expansion.
Restraint:
Prevalence of less organized industry across developing economies
The disorganized nature of the agritourism business is a significant barrier to its expansion. The notion of agrotourism is specialized, and there is no clear legal definition of it in many nations, which is limiting the market's rapid expansion. The lesser number of established tour agritourism operators in this business, particularly in developing countries, and the lack of knowledge about these types of tourist locations are serving as key barriers to the market's expansion.
Opportunity:
Rise in health consciousness
People are actively encouraged to choose inbound and outbound agritourism because it offers a pollution-free environment, fresh foods, recreational opportunities, and other health benefits. Many people are drawn to agritourism because of the on-farm farmer's markets, U-Pick operations, pumpkin picking fields, and other agritourism-related businesses that let visitors select fresh crops straight from farms.
Threat:
Improper commercialization of agritourism
Due to a lack of adequate technical and financial supervision and help, the majority of agritourism is not yet marketed. To monetize agritourism's position on a worldwide scale, advertising and marketing tactics are required. The majority of agritourism now experiences problems with energy and lodging, which is anticipated to restrain the market's expansion throughout the forecast period.
Covid-19 Impact
The COVID-19 pandemic had a negative impact on the agritourism industry. To prevent the spread of the Corona virus, people are only allowed to remain in their houses. The majority of nations have restricted borders that have a direct impact on agritourism operations. Due to the increase of Corona virus infections throughout the globe, the tourist industry is particularly impacted. Corona virus cases are declining, and corona virus vaccine is progressing, which has helped the tourist sector regain ground.
The on-farm sales segment is expected to be the largest during the forecast period
The on-farm sales segment is estimated to have a lucrative growth, due to the agritourism destinations' increased commercialization and the surge in interest in regional cuisine and handcrafted goods. Farm owners engage traditional artisans, designers of traditional costumes and clothing, and producers of regional specialties to help commercialize the agritourism centres. Through the on-farm sales sector, the demand for local foods and other non-food goods is projected to expand, as is interest in learning about the cultures and traditions of the communities.
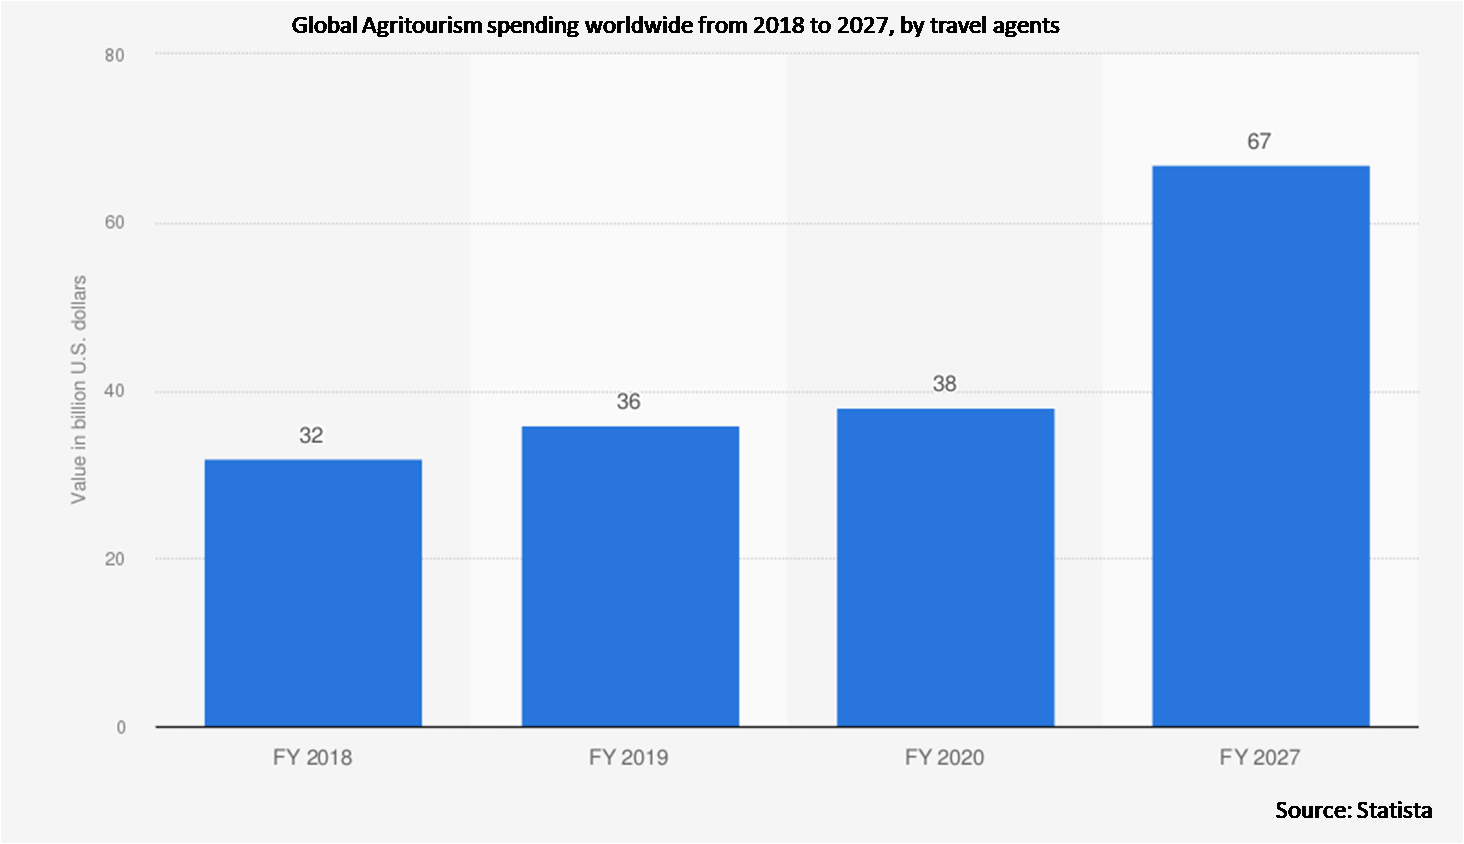
The travel agents segment is expected to have the highest CAGR during the forecast period
The travel agents segment is anticipated to witness the fastest CAGR growth during the forecast period, due to the increasing use of hotels, outdoor activities, entertainment, educational travel, and other services by consumers through travel agencies, as well as the availability of dependable transportation, individualized attention, and exclusivity. Since travel agents offer speedy booking services and the possibility to evaluate several available travel options, customers are urged to purchase their vacation packages through them, which is accelerating industry growth.
Region with highest share:
North America is projected to hold the largest market share during the forecast period owing to the increasing income levels across the area, a bettering business climate in the U.S. and Canada, and governmental efforts to encourage farm tourist activities. Additionally, the farmers in the area are incorporating supplementary businesses and sources of income into their normal farming operations, which is anticipated to spur market expansion throughout the projection period
Region with highest CAGR:
Asia Pacific is projected to have the highest CAGR over the forecast period, owing to government efforts to boost area agriculture tourism and encourage economic and job growth. Additionally, the majority of urban families and individuals are visiting agrotourism farms, which is projected to fuel market expansion. Families may spend quality time together and learn about the village culture on these outings.

Key players in the market
Some of the key players profiled in the Agritourism Market include Agrilys Voyages, Agricultural Tour Operators International, Bay Farm Tours, Blackberry Farm, LLC, Field Farm Tours Limited, Farm to Farm International, Greenmount Travel, Harvest Travel International, Kisima Safaris, Liberty Hill Farm, Select Holidays, Sita Group, Star Destinations
Key Developments:
In March 2022, As a team initiative, “Blackberry Gives” encourages employees across the Blackberry family of brands to give back to the community through team participation in service hours, need collection, and volunteering. Blackberry team members collected more than 770 pounds of food to give to Second Harvest Food Bank. Blackberry matched the team’s effort, bringing 1,600 pounds of food, resulting in more than 1,400 meals for East Tennessee families in need.
In January 2022, The Blackberry Farm Foundation announced its 2022 grant recipients, donating more than USD 170,000 to charities in Blount County.
Tour Types Covered:
• Individual Travelers
• Group Travelers
Activities Covered:
• Outdoor Recreation
• Entertainment
• Accommodations
• Educational Tourism
• On-farm Sales
• Other Activities
Sales Channels Covered:
• Direct
• Travel Agents
Regions Covered:
• North America
o US
o Canada
o Mexico
• Europe
o Germany
o UK
o Italy
o France
o Spain
o Rest of Europe
• Asia Pacific
o Japan
o China
o India
o Australia
o New Zealand
o South Korea
o Rest of Asia Pacific
• South America
o Argentina
o Brazil
o Chile
o Rest of South America
• Middle East & Africa
o Saudi Arabia
o UAE
o Qatar
o South Africa
o Rest of Middle East & Africa
What our report offers:
- Market share assessments for the regional and country-level segments
- Strategic recommendations for the new entrants
- Covers Market data for the years 2020, 2021, 2022, 2025, and 2028
- Market Trends (Drivers, Constraints, Opportunities, Threats, Challenges, Investment Opportunities, and recommendations)
- Strategic recommendations in key business segments based on the market estimations
- Competitive landscaping mapping the key common trends
- Company profiling with detailed strategies, financials, and recent developments
- Supply chain trends mapping the latest technological advancements
Free Customization Offerings:
All the customers of this report will be entitled to receive one of the following free customization options:
• Company Profiling
o Comprehensive profiling of additional market players (up to 3)
o SWOT Analysis of key players (up to 3)
• Regional Segmentation
o Market estimations, Forecasts and CAGR of any prominent country as per the client's interest (Note: Depends on feasibility check)
• Competitive Benchmarking
o Benchmarking of key players based on product portfolio, geographical presence, and strategic alliances
Table of Contents
1 Executive Summary
2 Preface
2.1 Abstract
2.2 Stake Holders
2.3 Research Scope
2.4 Research Methodology
2.4.1 Data Mining
2.4.2 Data Analysis
2.4.3 Data Validation
2.4.4 Research Approach
2.5 Research Sources
2.5.1 Primary Research Sources
2.5.2 Secondary Research Sources
2.5.3 Assumptions
3 Market Trend Analysis
3.1 Introduction
3.2 Drivers
3.3 Restraints
3.4 Opportunities
3.5 Threats
3.6 Emerging Markets
3.7 Impact of Covid-19
4 Porters Five Force Analysis
4.1 Bargaining power of suppliers
4.2 Bargaining power of buyers
4.3 Threat of substitutes
4.4 Threat of new entrants
4.5 Competitive rivalry
5 Global Agritourism Market, By Tour Type
5.1 Introduction
5.2 Individual Travelers
5.3 Group Travelers
6 Global Agritourism Market, By Activity
6.1 Introduction
6.2 Outdoor Recreation
6.3 Entertainment
6.4 Accommodations
6.5 Educational Tourism
6.6 On-farm Sales
6.7 Other Activities
7 Global Agritourism Market, By Sales Channel
7.1 Introduction
7.2 Direct
7.3 Travel Agents
8 Global Agritourism Market, By Geography
8.1 Introduction
8.2 North America
8.2.1 US
8.2.2 Canada
8.2.3 Mexico
8.3 Europe
8.3.1 Germany
8.3.2 UK
8.3.3 Italy
8.3.4 France
8.3.5 Spain
8.3.6 Rest of Europe
8.4 Asia Pacific
8.4.1 Japan
8.4.2 China
8.4.3 India
8.4.4 Australia
8.4.5 New Zealand
8.4.6 South Korea
8.4.7 Rest of Asia Pacific
8.5 South America
8.5.1 Argentina
8.5.2 Brazil
8.5.3 Chile
8.5.4 Rest of South America
8.6 Middle East & Africa
8.6.1 Saudi Arabia
8.6.2 UAE
8.6.3 Qatar
8.6.4 South Africa
8.6.5 Rest of Middle East & Africa
9 Key Developments
9.1 Agreements, Partnerships, Collaborations and Joint Ventures
9.2 Acquisitions & Mergers
9.3 New Product Launch
9.4 Expansions
9.5 Other Key Strategies
10 Company Profiling
10.1 Agrilys Voyages
10.2 Agricultural Tour Operators International Farm to Farm Tours
10.3 Bay Farm Tours
10.4 Blackberry Farm, LLC
10.5 Field Farm Tours Limited
10.6 Farm to Farm International
10.7 Greenmount Travel
10.8 Harvest Travel International
10.9 Kisima Safaris
10.10 Liberty Hill Farm
10.11 Select Holidays
10.12 Sita Group
10.13 Star Destinations
List of Tables
1 Global Agritourism Market Outlook, By Region (2020-2028) ($MN)
2 Global Agritourism Market Outlook, By Tour Type (2020-2028) ($MN)
3 Global Agritourism Market Outlook, By Individual Travelers (2020-2028) ($MN)
4 Global Agritourism Market Outlook, By Group Travelers (2020-2028) ($MN)
5 Global Agritourism Market Outlook, By Activity (2020-2028) ($MN)
6 Global Agritourism Market Outlook, By Outdoor Recreation (2020-2028) ($MN)
7 Global Agritourism Market Outlook, By Entertainment (2020-2028) ($MN)
8 Global Agritourism Market Outlook, By Accommodations (2020-2028) ($MN)
9 Global Agritourism Market Outlook, By Educational Tourism (2020-2028) ($MN)
10 Global Agritourism Market Outlook, By On-farm Sales (2020-2028) ($MN)
11 Global Agritourism Market Outlook, By Other Activities (2020-2028) ($MN)
12 Global Agritourism Market Outlook, By Sales Channel (2020-2028) ($MN)
13 Global Agritourism Market Outlook, By Direct (2020-2028) ($MN)
14 Global Agritourism Market Outlook, By Travel Agents (2020-2028) ($MN)
15 North America Agritourism Market Outlook, By Country (2020-2028) ($MN)
16 North America Agritourism Market Outlook, By Tour Type (2020-2028) ($MN)
17 North America Agritourism Market Outlook, By Individual Travelers (2020-2028) ($MN)
18 North America Agritourism Market Outlook, By Group Travelers (2020-2028) ($MN)
19 North America Agritourism Market Outlook, By Activity (2020-2028) ($MN)
20 North America Agritourism Market Outlook, By Outdoor Recreation (2020-2028) ($MN)
21 North America Agritourism Market Outlook, By Entertainment (2020-2028) ($MN)
22 North America Agritourism Market Outlook, By Accommodations (2020-2028) ($MN)
23 North America Agritourism Market Outlook, By Educational Tourism (2020-2028) ($MN)
24 North America Agritourism Market Outlook, By On-farm Sales (2020-2028) ($MN)
25 North America Agritourism Market Outlook, By Other Activities (2020-2028) ($MN)
26 North America Agritourism Market Outlook, By Sales Channel (2020-2028) ($MN)
27 North America Agritourism Market Outlook, By Direct (2020-2028) ($MN)
28 North America Agritourism Market Outlook, By Travel Agents (2020-2028) ($MN)
29 Europe Agritourism Market Outlook, By Country (2020-2028) ($MN)
30 Europe Agritourism Market Outlook, By Tour Type (2020-2028) ($MN)
31 Europe Agritourism Market Outlook, By Individual Travelers (2020-2028) ($MN)
32 Europe Agritourism Market Outlook, By Group Travelers (2020-2028) ($MN)
33 Europe Agritourism Market Outlook, By Activity (2020-2028) ($MN)
34 Europe Agritourism Market Outlook, By Outdoor Recreation (2020-2028) ($MN)
35 Europe Agritourism Market Outlook, By Entertainment (2020-2028) ($MN)
36 Europe Agritourism Market Outlook, By Accommodations (2020-2028) ($MN)
37 Europe Agritourism Market Outlook, By Educational Tourism (2020-2028) ($MN)
38 Europe Agritourism Market Outlook, By On-farm Sales (2020-2028) ($MN)
39 Europe Agritourism Market Outlook, By Other Activities (2020-2028) ($MN)
40 Europe Agritourism Market Outlook, By Sales Channel (2020-2028) ($MN)
41 Europe Agritourism Market Outlook, By Direct (2020-2028) ($MN)
42 Europe Agritourism Market Outlook, By Travel Agents (2020-2028) ($MN)
43 Asia Pacific Agritourism Market Outlook, By Country (2020-2028) ($MN)
44 Asia Pacific Agritourism Market Outlook, By Tour Type (2020-2028) ($MN)
45 Asia Pacific Agritourism Market Outlook, By Individual Travelers (2020-2028) ($MN)
46 Asia Pacific Agritourism Market Outlook, By Group Travelers (2020-2028) ($MN)
47 Asia Pacific Agritourism Market Outlook, By Activity (2020-2028) ($MN)
48 Asia Pacific Agritourism Market Outlook, By Outdoor Recreation (2020-2028) ($MN)
49 Asia Pacific Agritourism Market Outlook, By Entertainment (2020-2028) ($MN)
50 Asia Pacific Agritourism Market Outlook, By Accommodations (2020-2028) ($MN)
51 Asia Pacific Agritourism Market Outlook, By Educational Tourism (2020-2028) ($MN)
52 Asia Pacific Agritourism Market Outlook, By On-farm Sales (2020-2028) ($MN)
53 Asia Pacific Agritourism Market Outlook, By Other Activities (2020-2028) ($MN)
54 Asia Pacific Agritourism Market Outlook, By Sales Channel (2020-2028) ($MN)
55 Asia Pacific Agritourism Market Outlook, By Direct (2020-2028) ($MN)
56 Asia Pacific Agritourism Market Outlook, By Travel Agents (2020-2028) ($MN)
57 South America Agritourism Market Outlook, By Country (2020-2028) ($MN)
58 South America Agritourism Market Outlook, By Tour Type (2020-2028) ($MN)
59 South America Agritourism Market Outlook, By Individual Travelers (2020-2028) ($MN)
60 South America Agritourism Market Outlook, By Group Travelers (2020-2028) ($MN)
61 South America Agritourism Market Outlook, By Activity (2020-2028) ($MN)
62 South America Agritourism Market Outlook, By Outdoor Recreation (2020-2028) ($MN)
63 South America Agritourism Market Outlook, By Entertainment (2020-2028) ($MN)
64 South America Agritourism Market Outlook, By Accommodations (2020-2028) ($MN)
65 South America Agritourism Market Outlook, By Educational Tourism (2020-2028) ($MN)
66 South America Agritourism Market Outlook, By On-farm Sales (2020-2028) ($MN)
67 South America Agritourism Market Outlook, By Other Activities (2020-2028) ($MN)
68 South America Agritourism Market Outlook, By Sales Channel (2020-2028) ($MN)
69 South America Agritourism Market Outlook, By Direct (2020-2028) ($MN)
70 South America Agritourism Market Outlook, By Travel Agents (2020-2028) ($MN)
71 Middle East & Africa Agritourism Market Outlook, By Country (2020-2028) ($MN)
72 Middle East & Africa Agritourism Market Outlook, By Tour Type (2020-2028) ($MN)
73 Middle East & Africa Agritourism Market Outlook, By Individual Travelers (2020-2028) ($MN)
74 Middle East & Africa Agritourism Market Outlook, By Group Travelers (2020-2028) ($MN)
75 Middle East & Africa Agritourism Market Outlook, By Activity (2020-2028) ($MN)
76 Middle East & Africa Agritourism Market Outlook, By Outdoor Recreation (2020-2028) ($MN)
77 Middle East & Africa Agritourism Market Outlook, By Entertainment (2020-2028) ($MN)
78 Middle East & Africa Agritourism Market Outlook, By Accommodations (2020-2028) ($MN)
79 Middle East & Africa Agritourism Market Outlook, By Educational Tourism (2020-2028) ($MN)
80 Middle East & Africa Agritourism Market Outlook, By On-farm Sales (2020-2028) ($MN)
81 Middle East & Africa Agritourism Market Outlook, By Other Activities (2020-2028) ($MN)
82 Middle East & Africa Agritourism Market Outlook, By Sales Channel (2020-2028) ($MN)
83 Middle East & Africa Agritourism Market Outlook, By Direct (2020-2028) ($MN)
84 Middle East & Africa Agritourism Market Outlook, By Travel Agents (2020-2028) ($MN)
List of Figures
RESEARCH METHODOLOGY

We at ‘Stratistics’ opt for an extensive research approach which involves data mining, data validation, and data analysis. The various research sources include in-house repository, secondary research, competitor’s sources, social media research, client internal data, and primary research.
Our team of analysts prefers the most reliable and authenticated data sources in order to perform the comprehensive literature search. With access to most of the authenticated data bases our team highly considers the best mix of information through various sources to obtain extensive and accurate analysis.
Each report takes an average time of a month and a team of 4 industry analysts. The time may vary depending on the scope and data availability of the desired market report. The various parameters used in the market assessment are standardized in order to enhance the data accuracy.
Data Mining
The data is collected from several authenticated, reliable, paid and unpaid sources and is filtered depending on the scope & objective of the research. Our reports repository acts as an added advantage in this procedure. Data gathering from the raw material suppliers, distributors and the manufacturers is performed on a regular basis, this helps in the comprehensive understanding of the products value chain. Apart from the above mentioned sources the data is also collected from the industry consultants to ensure the objective of the study is in the right direction.
Market trends such as technological advancements, regulatory affairs, market dynamics (Drivers, Restraints, Opportunities and Challenges) are obtained from scientific journals, market related national & international associations and organizations.
Data Analysis
From the data that is collected depending on the scope & objective of the research the data is subjected for the analysis. The critical steps that we follow for the data analysis include:
- Product Lifecycle Analysis
- Competitor analysis
- Risk analysis
- Porters Analysis
- PESTEL Analysis
- SWOT Analysis
The data engineering is performed by the core industry experts considering both the Marketing Mix Modeling and the Demand Forecasting. The marketing mix modeling makes use of multiple-regression techniques to predict the optimal mix of marketing variables. Regression factor is based on a number of variables and how they relate to an outcome such as sales or profits.
Data Validation
The data validation is performed by the exhaustive primary research from the expert interviews. This includes telephonic interviews, focus groups, face to face interviews, and questionnaires to validate our research from all aspects. The industry experts we approach come from the leading firms, involved in the supply chain ranging from the suppliers, distributors to the manufacturers and consumers so as to ensure an unbiased analysis.
We are in touch with more than 15,000 industry experts with the right mix of consultants, CEO's, presidents, vice presidents, managers, experts from both supply side and demand side, executives and so on.
The data validation involves the primary research from the industry experts belonging to:
- Leading Companies
- Suppliers & Distributors
- Manufacturers
- Consumers
- Industry/Strategic Consultants
Apart from the data validation the primary research also helps in performing the fill gap research, i.e. providing solutions for the unmet needs of the research which helps in enhancing the reports quality.
For more details about research methodology, kindly write to us at info@strategymrc.com
Frequently Asked Questions
In case of any queries regarding this report, you can contact the customer service by filing the “Inquiry Before Buy” form available on the right hand side. You may also contact us through email: info@strategymrc.com or phone: +1-301-202-5929
Yes, the samples are available for all the published reports. You can request them by filling the “Request Sample” option available in this page.
Yes, you can request a sample with your specific requirements. All the customized samples will be provided as per the requirement with the real data masked.
All our reports are available in Digital PDF format. In case if you require them in any other formats, such as PPT, Excel etc you can submit a request through “Inquiry Before Buy” form available on the right hand side. You may also contact us through email: info@strategymrc.com or phone: +1-301-202-5929
We offer a free 15% customization with every purchase. This requirement can be fulfilled for both pre and post sale. You may send your customization requirements through email at info@strategymrc.com or call us on +1-301-202-5929.
We have 3 different licensing options available in electronic format.
- Single User Licence: Allows one person, typically the buyer, to have access to the ordered product. The ordered product cannot be distributed to anyone else.
- 2-5 User Licence: Allows the ordered product to be shared among a maximum of 5 people within your organisation.
- Corporate License: Allows the product to be shared among all employees of your organisation regardless of their geographical location.
All our reports are typically be emailed to you as an attachment.
To order any available report you need to register on our website. The payment can be made either through CCAvenue or PayPal payments gateways which accept all international cards.
We extend our support to 6 months post sale. A post sale customization is also provided to cover your unmet needs in the report.
Request Customization
We provide a free 15% customization on every purchase. This requirement can be fulfilled for both pre and post sale. You may send your customization requirements through email at info@strategymrc.com or call us on +1-301-202-5929.
Note: This customization is absolutely free until it falls under the 15% bracket. If your requirement exceeds this a feasibility check will be performed. Post that, a quote will be provided along with the timelines.
WHY CHOOSE US ?

Assured Quality
Best in class reports with high standard of research integrity

24X7 Research Support
Continuous support to ensure the best customer experience.

Free Customization
Adding more values to your product of interest.

Safe & Secure Access
Providing a secured environment for all online transactions.

Trusted by 600+ Brands
Serving the most reputed brands across the world.