
Augmented Analytics Market
Augmented Analytics Market Forecasts to 2028 - Global Analysis By Component (Software, Services and Other Components), Deployment (On-Premises and Cloud), Organization Size (Small Sized Enterprises, Medium Sized Enterprises and Large Enterprises ) End User and Geography

|
Years Covered |
2020-2028 |
|
Estimated Year Value (2022) |
US $9.67 BN |
|
Projected Year Value (2028) |
US $24.05 BN |
|
CAGR (2022 - 2028) |
16.4% |
|
Regions Covered |
North America, Europe, Asia Pacific, South America, and Middle East & Africa |
|
Countries Covered |
US, Canada, Mexico, Germany, UK, Italy, France, Spain, Japan, China, India, Australia, New Zealand, South Korea, Rest of Asia Pacific, South America, Argentina, Brazil, Chile, Middle East & Africa, Saudi Arabia, UAE, Qatar, and South Africa |
|
Largest Market |
North America |
|
Highest Growing Market |
Europe |
According to Stratistics MRC, the Global Augmented Analytics Market is accounted for $9.67 billion in 2022 and is expected to reach $24.05 billion by 2028 growing at a CAGR of 16.4% during the forecast period. The augmented analytics refers to the use of enabling technologies like machine learning and AI to help with data preparation, insight generation, and insight explanation to enhance how people explore and understand data in analytics and BI systems. By automating a lot of data science, machine learning, and AI model building, administration, and deployment processes, it also supports professional and citizen data scientists. Utilizing augmented analytics, businesses may become more adaptable, increase analytics access, and enable people to make smarter, data-driven decisions, accelerate decision-making, and cut expenses.
According to SAS Institute, estimated adoption rates of Big Data in the United Kingdom in 2020 are forecasted at around 59%. This showcases the huge potential for augmented analytics and thus, can provide a great advantage in the online retail segment.
Market Dynamics:
Driver:
Growing volume of complex corporate data
Organizations have begun integrating several technological aspects into their operational procedures. Huge volumes of data have been produced as a result of this. Although this data frequently has a high volume and is not organised, it does contain significant information. Most organisations are concerned with data storage and knowledge extraction. A significant demand exists for augmented analytics tools like machine learning and natural language processing to analyse the data. It is now possible to examine the structured, semi-structured, and unstructured data sources that are available within an organisation thanks to augmented analytics. Due to the evolution of digital technology across company processes, it is anticipated that there would be an encouraging growth in the market.
Restraint:
Lack of skilled professionals
Organization uses advanced analytics approaches that are complex in nature and call for in-depth analytical skills, to derive business insights from data. Due to the technology's architecture, augmented analytics is a particularly difficult field. A person needs technological expertise, analytical thinking, and critical thinking to employ augmented analytics. Many end consumers lack the resources and knowledge necessary for analytical thinking. Another major obstacle is the ignorance of augmented analytics. Furthermore, in order to create a culture that is data driven and decision-making, business expertise is required, along with the right training.
Opportunity:
The use of technology for machine learning, artificial intelligence, and natural language processing is growing.
Organizations have been forced to adopt emerging technologies like AI, ML, and NLP due to the development of enormous amounts of data and the requirement to evaluate it in real time. The entire process of deriving insights from data has been made easier by these technologies. Typically, charts and graphs were used for data analysis. The research methodology was not user-friendly to the untrained eye, and there was a chance of misunderstanding and substandard judgement. The NLP technology fixes this problem. Strategic streaming and the use of these technologies may comprehend large datasets and produce insightful data that can be used to create unique and effective solutions.
Threat:
Difficulty in maintaining quality data
Preserving data quality and safety is challenging huge amounts of data and a diversity of data types can raise the possibility of bad data, which can hurt firms and their profits and stymie operations. When employing augmented analytics to get insights, data quality is a crucial determinant of data reliability. Businesses are becoming more reluctant to disclose their vital business data on the cloud. Sharing vital company information exposes systems to unauthorised access, which could sabotage systems or result in system failure. Businesses are reluctant to transfer their data to the cloud because they are so sensitive to data storage and access therefore hindering the market growth.
Covid-19 Impact
During the Covid 19 pandemic era, the market for augmented analytics is anticipated to experience growing prospects. As a number of organisations deal with the difficulties brought on by the COVID 19 epidemic, the demand for quick and widespread updates and instructions has grown. The crisis offered an opportunity for analytics and AI-based solutions to support decision making since business leaders demanded that decisions be made quickly. By labelling and structuring the data, augmented analytics automates the preparation of the data for analysis. AI helps analytics by speeding up the process of finding new insights which positively impacted the market.
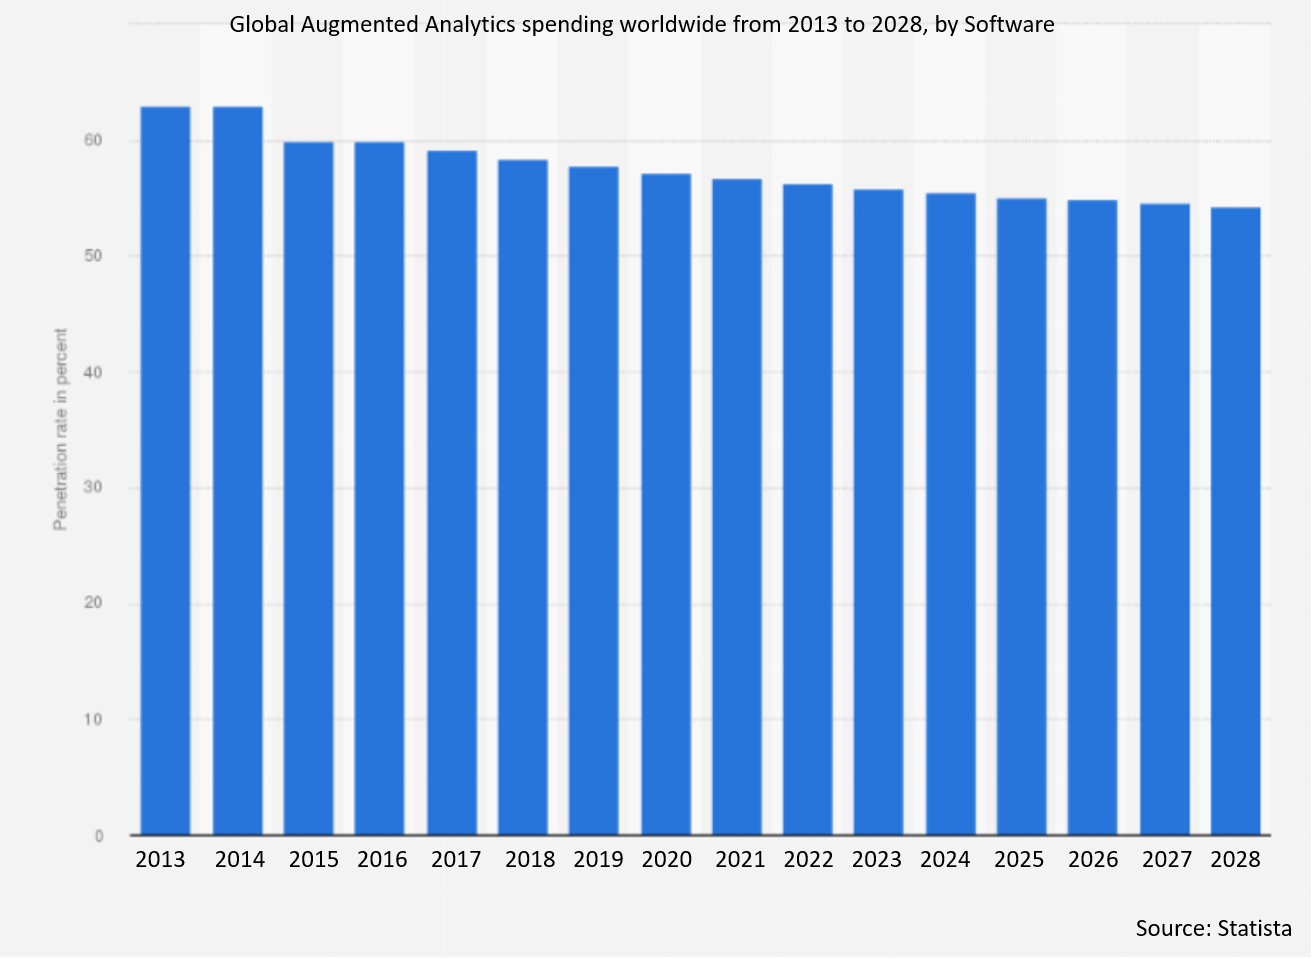
The Software segment is expected to be the largest during the forecast period
The Software segment is estimated to have a lucrative growth due to its one of most cutting-edge analytics-driven application that incorporates cutting-edge technology like artificial intelligence is called augmented analytics software. However, as emerging technologies, like the Internet of Things, develop, there is a growing need for better analytic solutions. A tool called augmented analytics software gathers, organises, and analyses data before displaying it to the user. By incorporating AI technology into BI, it enables users to quickly prepare and clean their data, find insightful information, and share it with others thereby propelling the market growth.
The IT & Telecommunication segment is expected to have the highest CAGR during the forecast period
The IT & Telecommunication segment is anticipated to witness the fastest CAGR growth during the forecast period, due to the use of sophisticated machine learning algorithms, augmented analytics in telecom can scan huge amounts of data, including call detail records in the telecoms sector, to identify patterns, spot problems in the network, and foresee them. Strong IT systems with cutting-edge Augmented Analytics for telecom at their core can complete tasks with extreme precision and no mistakes. Machine learning algorithms that are unsupervised can learn from data on their own without any further technical support. It frees up time that would otherwise be used to manually research trends, allowing marketers to react more swiftly to the quickly shifting market conditions. Teams in the telecom industry can use augmented analytics to examine technician performance metrics, identify unnecessary service requests, and otherwise enhance customer service.
Region with largest share:
North America is projected to hold the largest market share during the forecast period owing to the extensive use of artificial intelligence and the acceptance of its potential to compete with or completely replace human intelligence. Data consumers had to do a number of mindless, repetitive activities that took a lot of time. These jobs are now automated and may be completed in real time owing to AI, greatly enhancing human productivity. Given the intense competition among firms in the region, productivity maximisation can be done to generate improved profits, hence increasing their overall income in turn increasing the growth in the region.
Region with highest CAGR:
Europe is projected to have the highest CAGR over the forecast period, owing to the substantial money offered by venture capitalists to new companies is probably going to have a favourable effect on the expansion of the predictive analytics sector. For well-known players, emerging developments in methods and approaches related to the development of augmented analytics are projected to present significant potential. In Europe, there is a substantial need for these solutions because to the growing significance and awareness of augmented analytics models which are driving the market growth in this region.

Key players in the market
Some of the key players profiled in the Augmented Analytics Market include Salesforce.com, Inc, IBM, Microsoft, Sap Oracle, MicroStrategy Incorporated, SAS Institute Inc, QlikTech, TIBCO Software Inc, Sisense Inc, Information Builders, ThoughtSpot Inc, Domo, Inc, Yellowfin International, CognitiveScale, Google LLC, Amazon Web Services,Inc and Pyramid Analytics.
Key Developments:
In Jan 2023, Salesforce has announced a partnership with Walmart Commerce Technologies to provide retailers with technologies and services that power frictionless local pickup and delivery for shoppers everywhere. Walmart Store Assist technology and Walmart GoLocal local delivery solutions will be available through AppExchange to help retailers thrive in today’s hybrid shopping world.
In Jan 2023, Microsoft and Qcells announce strategic alliance to curb carbon emissions and power the clean energy economy, Qcells is the only company in the U.S. that will have a complete solar supply chain and provides one-stop clean energy solutions.
Inj Jan 2023, Qlik announced its intention to acquire Talend, which would bring together two Thoma Bravo-backed industry leaders with a shared focus on adding value to data to deliver business outcomes for customers. Additionally, Qlik has been named a leader in the IDC MarketScape: U.S. Business Intelligence and Analytics Platforms 2022 Vendor Assessment.
In Dec 2022, Salesforce Launches Automation Everywhere Bundle to Help Companies Lower Costs, Boost Productivity, and Deliver Success Now, However, the last mile of automation is challenging and often includes updating data in legacy systems, scanning paper documents, and routing work to multiple people and systems.
Components Covered:
• Software
• Services
• Other Components
Deployments Covered:
• On-Premises
• Cloud
Organization Sizes Covered:
• Small Sized Enterprises
• Medium Sized Enterprises
• Large Enterprises
End Users Covered:
• IT & Telecommunication
• Retail & Consumer Goods Manufacturing
• Energy & Utilities
• Government
• Media & Entertainment
• Banking, Financial Services, & Insurance(BFSI)
• Healthcare
• Other End Users
Regions Covered:
• North America
o US
o Canada
o Mexico
• Europe
o Germany
o UK
o Italy
o France
o Spain
o Rest of Europe
• Asia Pacific
o Japan
o China
o India
o Australia
o New Zealand
o South Korea
o Rest of Asia Pacific
• South America
o Argentina
o Brazil
o Chile
o Rest of South America
• Middle East & Africa
o Saudi Arabia
o UAE
o Qatar
o South Africa
o Rest of Middle East & Africa
What our report offers:
- Market share assessments for the regional and country-level segments
- Strategic recommendations for the new entrants
- Covers Market data for the years 2020, 2021, 2022, 2025, and 2028
- Market Trends (Drivers, Constraints, Opportunities, Threats, Challenges, Investment Opportunities, and recommendations)
- Strategic recommendations in key business segments based on the market estimations
- Competitive landscaping mapping the key common trends
- Company profiling with detailed strategies, financials, and recent developments
- Supply chain trends mapping the latest technological advancements
Free Customization Offerings:
All the customers of this report will be entitled to receive one of the following free customization options:
• Company Profiling
o Comprehensive profiling of additional market players (up to 3)
o SWOT Analysis of key players (up to 3)
• Regional Segmentation
o Market estimations, Forecasts and CAGR of any prominent country as per the client's interest (Note: Depends on feasibility check)
• Competitive Benchmarking
o Benchmarking of key players based on product portfolio, geographical presence, and strategic alliances
Table of Contents
1 Executive Summary
2 Preface
2.1 Abstract
2.2 Stake Holders
2.3 Research Scope
2.4 Research Methodology
2.4.1 Data Mining
2.4.2 Data Analysis
2.4.3 Data Validation
2.4.4 Research Approach
2.5 Research Sources
2.5.1 Primary Research Sources
2.5.2 Secondary Research Sources
2.5.3 Assumptions
3 Market Trend Analysis
3.1 Introduction
3.2 Drivers
3.3 Restraints
3.4 Opportunities
3.5 Threats
3.6 End User Analysis
3.7 Emerging Markets
3.8 Impact of Covid-19
4 Porters Five Force Analysis
4.1 Bargaining power of suppliers
4.2 Bargaining power of buyers
4.3 Threat of substitutes
4.4 Threat of new entrants
4.5 Competitive rivalry
5 Global Augmented Analytics Market, By Component
5.1 Introduction
5.2 Software
5.3 Services
5.3.1 Training & Consulting Services
5.3.2 Deployment & Integration
5.3.3 Support & Maintenance
5.4 Other Components
6 Global Augmented Analytics Market, By Deployment
6.1 Introduction
6.2 On-Premises
6.3 Cloud
7 Global Augmented Analytics Market, By Organization Size
7.1 Introduction
7.2 Small Sized Enterprises
7.3 Medium Sized Enterprises
7.4 Large Enterprises
8 Global Augmented Analytics Market, By End User
8.1 Introduction
8.2 IT & Telecommunication
8.3 Retail & Consumer Goods Manufacturing
8.4 Energy & Utilities
8.5 Government
8.6 Media & Entertainment
8.7 Banking, Financial Services, & Insurance(BFSI)
8.8 Healthcare
8.9 Other End Users
9 Global Augmented Analytics Market, By Geography
9.1 Introduction
9.2 North America
9.2.1 US
9.2.2 Canada
9.2.3 Mexico
9.3 Europe
9.3.1 Germany
9.3.2 UK
9.3.3 Italy
9.3.4 France
9.3.5 Spain
9.3.6 Rest of Europe
9.4 Asia Pacific
9.4.1 Japan
9.4.2 China
9.4.3 India
9.4.4 Australia
9.4.5 New Zealand
9.4.6 South Korea
9.4.7 Rest of Asia Pacific
9.5 South America
9.5.1 Argentina
9.5.2 Brazil
9.5.3 Chile
9.5.4 Rest of South America
9.6 Middle East & Africa
9.6.1 Saudi Arabia
9.6.2 UAE
9.6.3 Qatar
9.6.4 South Africa
9.6.5 Rest of Middle East & Africa
10 Key Developments
10.1 Agreements, Partnerships, Collaborations and Joint Ventures
10.2 Acquisitions & Mergers
10.3 New Product Launch
10.4 Expansions
10.5 Other Key Strategies
11 Company Profiling
11.1 Salesforce.com, Inc
11.2 IBM
11.3 Microsoft
11.4 Sap Oracle
11.5 MicroStrategy Incorporated
11.6 SAS Institute Inc
11.7 QlikTech
11.8 TIBCO Software Inc
11.9 Sisense Inc
11.10 Information Builders
11.11 ThoughtSpot Inc
11.12 Domo, Inc
11.13 Yellowfin International
11.14 CognitiveScale
11.15 Google LLC
11.16 Amazon Web Services,Inc.
11.17 Pyramid Analytics
List of Tables
1 Global Augmented Analytics Market Outlook, By Region (2020-2028) ($MN)
2 Global Augmented Analytics Market Outlook, By Component (2020-2028) ($MN)
3 Global Augmented Analytics Market Outlook, By Software (2020-2028) ($MN)
4 Global Augmented Analytics Market Outlook, By Services (2020-2028) ($MN)
5 Global Augmented Analytics Market Outlook, By Training & Consulting Services (2020-2028) ($MN)
6 Global Augmented Analytics Market Outlook, By Deployment & Integration (2020-2028) ($MN)
7 Global Augmented Analytics Market Outlook, By Support & Maintenance (2020-2028) ($MN)
8 Global Augmented Analytics Market Outlook, By Other Components (2020-2028) ($MN)
9 Global Augmented Analytics Market Outlook, By Deployment (2020-2028) ($MN)
10 Global Augmented Analytics Market Outlook, By On-Premises (2020-2028) ($MN)
11 Global Augmented Analytics Market Outlook, By Cloud (2020-2028) ($MN)
12 Global Augmented Analytics Market Outlook, By Organization Size (2020-2028) ($MN)
13 Global Augmented Analytics Market Outlook, By Small Sized Enterprises (2020-2028) ($MN)
14 Global Augmented Analytics Market Outlook, By Medium Sized Enterprises (2020-2028) ($MN)
15 Global Augmented Analytics Market Outlook, By Large Enterprises (2020-2028) ($MN)
16 Global Augmented Analytics Market Outlook, By End User (2020-2028) ($MN)
17 Global Augmented Analytics Market Outlook, By IT & Telecommunication (2020-2028) ($MN)
18 Global Augmented Analytics Market Outlook, By Retail & Consumer Goods Manufacturing (2020-2028) ($MN)
19 Global Augmented Analytics Market Outlook, By Energy & Utilities (2020-2028) ($MN)
20 Global Augmented Analytics Market Outlook, By Government (2020-2028) ($MN)
21 Global Augmented Analytics Market Outlook, By Media & Entertainment (2020-2028) ($MN)
22 Global Augmented Analytics Market Outlook, By Banking, Financial Services, & Insurance(BFSI) (2020-2028) ($MN)
23 Global Augmented Analytics Market Outlook, By Healthcare (2020-2028) ($MN)
24 Global Augmented Analytics Market Outlook, By Other End Users (2020-2028) ($MN)
25 North America Augmented Analytics Market Outlook, By Country (2020-2028) ($MN)
26 North America Augmented Analytics Market Outlook, By Component (2020-2028) ($MN)
27 North America Augmented Analytics Market Outlook, By Software (2020-2028) ($MN)
28 North America Augmented Analytics Market Outlook, By Services (2020-2028) ($MN)
29 North America Augmented Analytics Market Outlook, By Training & Consulting Services (2020-2028) ($MN)
30 North America Augmented Analytics Market Outlook, By Deployment & Integration (2020-2028) ($MN)
31 North America Augmented Analytics Market Outlook, By Support & Maintenance (2020-2028) ($MN)
32 North America Augmented Analytics Market Outlook, By Other Components (2020-2028) ($MN)
33 North America Augmented Analytics Market Outlook, By Deployment (2020-2028) ($MN)
34 North America Augmented Analytics Market Outlook, By On-Premises (2020-2028) ($MN)
35 North America Augmented Analytics Market Outlook, By Cloud (2020-2028) ($MN)
36 North America Augmented Analytics Market Outlook, By Organization Size (2020-2028) ($MN)
37 North America Augmented Analytics Market Outlook, By Small Sized Enterprises (2020-2028) ($MN)
38 North America Augmented Analytics Market Outlook, By Medium Sized Enterprises (2020-2028) ($MN)
39 North America Augmented Analytics Market Outlook, By Large Enterprises (2020-2028) ($MN)
40 North America Augmented Analytics Market Outlook, By End User (2020-2028) ($MN)
41 North America Augmented Analytics Market Outlook, By IT & Telecommunication (2020-2028) ($MN)
42 North America Augmented Analytics Market Outlook, By Retail & Consumer Goods Manufacturing (2020-2028) ($MN)
43 North America Augmented Analytics Market Outlook, By Energy & Utilities (2020-2028) ($MN)
44 North America Augmented Analytics Market Outlook, By Government (2020-2028) ($MN)
45 North America Augmented Analytics Market Outlook, By Media & Entertainment (2020-2028) ($MN)
46 North America Augmented Analytics Market Outlook, By Banking, Financial Services, & Insurance(BFSI) (2020-2028) ($MN)
47 North America Augmented Analytics Market Outlook, By Healthcare (2020-2028) ($MN)
48 North America Augmented Analytics Market Outlook, By Other End Users (2020-2028) ($MN)
49 Europe Augmented Analytics Market Outlook, By Country (2020-2028) ($MN)
50 Europe Augmented Analytics Market Outlook, By Component (2020-2028) ($MN)
51 Europe Augmented Analytics Market Outlook, By Software (2020-2028) ($MN)
52 Europe Augmented Analytics Market Outlook, By Services (2020-2028) ($MN)
53 Europe Augmented Analytics Market Outlook, By Training & Consulting Services (2020-2028) ($MN)
54 Europe Augmented Analytics Market Outlook, By Deployment & Integration (2020-2028) ($MN)
55 Europe Augmented Analytics Market Outlook, By Support & Maintenance (2020-2028) ($MN)
56 Europe Augmented Analytics Market Outlook, By Other Components (2020-2028) ($MN)
57 Europe Augmented Analytics Market Outlook, By Deployment (2020-2028) ($MN)
58 Europe Augmented Analytics Market Outlook, By On-Premises (2020-2028) ($MN)
59 Europe Augmented Analytics Market Outlook, By Cloud (2020-2028) ($MN)
60 Europe Augmented Analytics Market Outlook, By Organization Size (2020-2028) ($MN)
61 Europe Augmented Analytics Market Outlook, By Small Sized Enterprises (2020-2028) ($MN)
62 Europe Augmented Analytics Market Outlook, By Medium Sized Enterprises (2020-2028) ($MN)
63 Europe Augmented Analytics Market Outlook, By Large Enterprises (2020-2028) ($MN)
64 Europe Augmented Analytics Market Outlook, By End User (2020-2028) ($MN)
65 Europe Augmented Analytics Market Outlook, By IT & Telecommunication (2020-2028) ($MN)
66 Europe Augmented Analytics Market Outlook, By Retail & Consumer Goods Manufacturing (2020-2028) ($MN)
67 Europe Augmented Analytics Market Outlook, By Energy & Utilities (2020-2028) ($MN)
68 Europe Augmented Analytics Market Outlook, By Government (2020-2028) ($MN)
69 Europe Augmented Analytics Market Outlook, By Media & Entertainment (2020-2028) ($MN)
70 Europe Augmented Analytics Market Outlook, By Banking, Financial Services, & Insurance(BFSI) (2020-2028) ($MN)
71 Europe Augmented Analytics Market Outlook, By Healthcare (2020-2028) ($MN)
72 Europe Augmented Analytics Market Outlook, By Other End Users (2020-2028) ($MN)
73 Asia Pacific Augmented Analytics Market Outlook, By Country (2020-2028) ($MN)
74 Asia Pacific Augmented Analytics Market Outlook, By Component (2020-2028) ($MN)
75 Asia Pacific Augmented Analytics Market Outlook, By Software (2020-2028) ($MN)
76 Asia Pacific Augmented Analytics Market Outlook, By Services (2020-2028) ($MN)
77 Asia Pacific Augmented Analytics Market Outlook, By Training & Consulting Services (2020-2028) ($MN)
78 Asia Pacific Augmented Analytics Market Outlook, By Deployment & Integration (2020-2028) ($MN)
79 Asia Pacific Augmented Analytics Market Outlook, By Support & Maintenance (2020-2028) ($MN)
80 Asia Pacific Augmented Analytics Market Outlook, By Other Components (2020-2028) ($MN)
81 Asia Pacific Augmented Analytics Market Outlook, By Deployment (2020-2028) ($MN)
82 Asia Pacific Augmented Analytics Market Outlook, By On-Premises (2020-2028) ($MN)
83 Asia Pacific Augmented Analytics Market Outlook, By Cloud (2020-2028) ($MN)
84 Asia Pacific Augmented Analytics Market Outlook, By Organization Size (2020-2028) ($MN)
85 Asia Pacific Augmented Analytics Market Outlook, By Small Sized Enterprises (2020-2028) ($MN)
86 Asia Pacific Augmented Analytics Market Outlook, By Medium Sized Enterprises (2020-2028) ($MN)
87 Asia Pacific Augmented Analytics Market Outlook, By Large Enterprises (2020-2028) ($MN)
88 Asia Pacific Augmented Analytics Market Outlook, By End User (2020-2028) ($MN)
89 Asia Pacific Augmented Analytics Market Outlook, By IT & Telecommunication (2020-2028) ($MN)
90 Asia Pacific Augmented Analytics Market Outlook, By Retail & Consumer Goods Manufacturing (2020-2028) ($MN)
91 Asia Pacific Augmented Analytics Market Outlook, By Energy & Utilities (2020-2028) ($MN)
92 Asia Pacific Augmented Analytics Market Outlook, By Government (2020-2028) ($MN)
93 Asia Pacific Augmented Analytics Market Outlook, By Media & Entertainment (2020-2028) ($MN)
94 Asia Pacific Augmented Analytics Market Outlook, By Banking, Financial Services, & Insurance(BFSI) (2020-2028) ($MN)
95 Asia Pacific Augmented Analytics Market Outlook, By Healthcare (2020-2028) ($MN)
96 Asia Pacific Augmented Analytics Market Outlook, By Other End Users (2020-2028) ($MN)
97 South America Augmented Analytics Market Outlook, By Country (2020-2028) ($MN)
98 South America Augmented Analytics Market Outlook, By Component (2020-2028) ($MN)
99 South America Augmented Analytics Market Outlook, By Software (2020-2028) ($MN)
100 South America Augmented Analytics Market Outlook, By Services (2020-2028) ($MN)
101 South America Augmented Analytics Market Outlook, By Training & Consulting Services (2020-2028) ($MN)
102 South America Augmented Analytics Market Outlook, By Deployment & Integration (2020-2028) ($MN)
103 South America Augmented Analytics Market Outlook, By Support & Maintenance (2020-2028) ($MN)
104 South America Augmented Analytics Market Outlook, By Other Components (2020-2028) ($MN)
105 South America Augmented Analytics Market Outlook, By Deployment (2020-2028) ($MN)
106 South America Augmented Analytics Market Outlook, By On-Premises (2020-2028) ($MN)
107 South America Augmented Analytics Market Outlook, By Cloud (2020-2028) ($MN)
108 South America Augmented Analytics Market Outlook, By Organization Size (2020-2028) ($MN)
109 South America Augmented Analytics Market Outlook, By Small Sized Enterprises (2020-2028) ($MN)
110 South America Augmented Analytics Market Outlook, By Medium Sized Enterprises (2020-2028) ($MN)
111 South America Augmented Analytics Market Outlook, By Large Enterprises (2020-2028) ($MN)
112 South America Augmented Analytics Market Outlook, By End User (2020-2028) ($MN)
113 South America Augmented Analytics Market Outlook, By IT & Telecommunication (2020-2028) ($MN)
114 South America Augmented Analytics Market Outlook, By Retail & Consumer Goods Manufacturing (2020-2028) ($MN)
115 South America Augmented Analytics Market Outlook, By Energy & Utilities (2020-2028) ($MN)
116 South America Augmented Analytics Market Outlook, By Government (2020-2028) ($MN)
117 South America Augmented Analytics Market Outlook, By Media & Entertainment (2020-2028) ($MN)
118 South America Augmented Analytics Market Outlook, By Banking, Financial Services, & Insurance(BFSI) (2020-2028) ($MN)
119 South America Augmented Analytics Market Outlook, By Healthcare (2020-2028) ($MN)
120 South America Augmented Analytics Market Outlook, By Other End Users (2020-2028) ($MN)
121 Middle East & Africa Augmented Analytics Market Outlook, By Country (2020-2028) ($MN)
122 Middle East & Africa Augmented Analytics Market Outlook, By Component (2020-2028) ($MN)
123 Middle East & Africa Augmented Analytics Market Outlook, By Software (2020-2028) ($MN)
124 Middle East & Africa Augmented Analytics Market Outlook, By Services (2020-2028) ($MN)
125 Middle East & Africa Augmented Analytics Market Outlook, By Training & Consulting Services (2020-2028) ($MN)
126 Middle East & Africa Augmented Analytics Market Outlook, By Deployment & Integration (2020-2028) ($MN)
127 Middle East & Africa Augmented Analytics Market Outlook, By Support & Maintenance (2020-2028) ($MN)
128 Middle East & Africa Augmented Analytics Market Outlook, By Other Components (2020-2028) ($MN)
129 Middle East & Africa Augmented Analytics Market Outlook, By Deployment (2020-2028) ($MN)
130 Middle East & Africa Augmented Analytics Market Outlook, By On-Premises (2020-2028) ($MN)
131 Middle East & Africa Augmented Analytics Market Outlook, By Cloud (2020-2028) ($MN)
132 Middle East & Africa Augmented Analytics Market Outlook, By Organization Size (2020-2028) ($MN)
133 Middle East & Africa Augmented Analytics Market Outlook, By Small Sized Enterprises (2020-2028) ($MN)
134 Middle East & Africa Augmented Analytics Market Outlook, By Medium Sized Enterprises (2020-2028) ($MN)
135 Middle East & Africa Augmented Analytics Market Outlook, By Large Enterprises (2020-2028) ($MN)
136 Middle East & Africa Augmented Analytics Market Outlook, By End User (2020-2028) ($MN)
137 Middle East & Africa Augmented Analytics Market Outlook, By IT & Telecommunication (2020-2028) ($MN)
138 Middle East & Africa Augmented Analytics Market Outlook, By Retail & Consumer Goods Manufacturing (2020-2028) ($MN)
139 Middle East & Africa Augmented Analytics Market Outlook, By Energy & Utilities (2020-2028) ($MN)
140 Middle East & Africa Augmented Analytics Market Outlook, By Government (2020-2028) ($MN)
141 Middle East & Africa Augmented Analytics Market Outlook, By Media & Entertainment (2020-2028) ($MN)
142 Middle East & Africa Augmented Analytics Market Outlook, By Banking, Financial Services, & Insurance(BFSI) (2020-2028) ($MN)
143 Middle East & Africa Augmented Analytics Market Outlook, By Healthcare (2020-2028) ($MN)
144 Middle East & Africa Augmented Analytics Market Outlook, By Other End Users (2020-2028) ($MN)
List of Figures
RESEARCH METHODOLOGY

We at ‘Stratistics’ opt for an extensive research approach which involves data mining, data validation, and data analysis. The various research sources include in-house repository, secondary research, competitor’s sources, social media research, client internal data, and primary research.
Our team of analysts prefers the most reliable and authenticated data sources in order to perform the comprehensive literature search. With access to most of the authenticated data bases our team highly considers the best mix of information through various sources to obtain extensive and accurate analysis.
Each report takes an average time of a month and a team of 4 industry analysts. The time may vary depending on the scope and data availability of the desired market report. The various parameters used in the market assessment are standardized in order to enhance the data accuracy.
Data Mining
The data is collected from several authenticated, reliable, paid and unpaid sources and is filtered depending on the scope & objective of the research. Our reports repository acts as an added advantage in this procedure. Data gathering from the raw material suppliers, distributors and the manufacturers is performed on a regular basis, this helps in the comprehensive understanding of the products value chain. Apart from the above mentioned sources the data is also collected from the industry consultants to ensure the objective of the study is in the right direction.
Market trends such as technological advancements, regulatory affairs, market dynamics (Drivers, Restraints, Opportunities and Challenges) are obtained from scientific journals, market related national & international associations and organizations.
Data Analysis
From the data that is collected depending on the scope & objective of the research the data is subjected for the analysis. The critical steps that we follow for the data analysis include:
- Product Lifecycle Analysis
- Competitor analysis
- Risk analysis
- Porters Analysis
- PESTEL Analysis
- SWOT Analysis
The data engineering is performed by the core industry experts considering both the Marketing Mix Modeling and the Demand Forecasting. The marketing mix modeling makes use of multiple-regression techniques to predict the optimal mix of marketing variables. Regression factor is based on a number of variables and how they relate to an outcome such as sales or profits.
Data Validation
The data validation is performed by the exhaustive primary research from the expert interviews. This includes telephonic interviews, focus groups, face to face interviews, and questionnaires to validate our research from all aspects. The industry experts we approach come from the leading firms, involved in the supply chain ranging from the suppliers, distributors to the manufacturers and consumers so as to ensure an unbiased analysis.
We are in touch with more than 15,000 industry experts with the right mix of consultants, CEO's, presidents, vice presidents, managers, experts from both supply side and demand side, executives and so on.
The data validation involves the primary research from the industry experts belonging to:
- Leading Companies
- Suppliers & Distributors
- Manufacturers
- Consumers
- Industry/Strategic Consultants
Apart from the data validation the primary research also helps in performing the fill gap research, i.e. providing solutions for the unmet needs of the research which helps in enhancing the reports quality.
For more details about research methodology, kindly write to us at info@strategymrc.com
Frequently Asked Questions
In case of any queries regarding this report, you can contact the customer service by filing the “Inquiry Before Buy” form available on the right hand side. You may also contact us through email: info@strategymrc.com or phone: +1-301-202-5929
Yes, the samples are available for all the published reports. You can request them by filling the “Request Sample” option available in this page.
Yes, you can request a sample with your specific requirements. All the customized samples will be provided as per the requirement with the real data masked.
All our reports are available in Digital PDF format. In case if you require them in any other formats, such as PPT, Excel etc you can submit a request through “Inquiry Before Buy” form available on the right hand side. You may also contact us through email: info@strategymrc.com or phone: +1-301-202-5929
We offer a free 15% customization with every purchase. This requirement can be fulfilled for both pre and post sale. You may send your customization requirements through email at info@strategymrc.com or call us on +1-301-202-5929.
We have 3 different licensing options available in electronic format.
- Single User Licence: Allows one person, typically the buyer, to have access to the ordered product. The ordered product cannot be distributed to anyone else.
- 2-5 User Licence: Allows the ordered product to be shared among a maximum of 5 people within your organisation.
- Corporate License: Allows the product to be shared among all employees of your organisation regardless of their geographical location.
All our reports are typically be emailed to you as an attachment.
To order any available report you need to register on our website. The payment can be made either through CCAvenue or PayPal payments gateways which accept all international cards.
We extend our support to 6 months post sale. A post sale customization is also provided to cover your unmet needs in the report.
Request Customization
We provide a free 15% customization on every purchase. This requirement can be fulfilled for both pre and post sale. You may send your customization requirements through email at info@strategymrc.com or call us on +1-301-202-5929.
Note: This customization is absolutely free until it falls under the 15% bracket. If your requirement exceeds this a feasibility check will be performed. Post that, a quote will be provided along with the timelines.
WHY CHOOSE US ?

Assured Quality
Best in class reports with high standard of research integrity

24X7 Research Support
Continuous support to ensure the best customer experience.

Free Customization
Adding more values to your product of interest.

Safe & Secure Access
Providing a secured environment for all online transactions.

Trusted by 600+ Brands
Serving the most reputed brands across the world.