
Biogas Upgrading Market
Biogas Upgrading Market Forecasts to 2030 - Global Analysis By Technology (Pressure swing adsorption (PSA), Water scrubber, Membrane, Chemical scrubber and Other Technologies), Application and By Geography

|
Years Covered |
2021-2030 |
|
Estimated Year Value (2023) |
US $398.8 MN |
|
Projected Year Value (2030) |
US $2010.7 MN |
|
CAGR (2023 - 2030) |
25.9% |
|
Regions Covered |
North America, Europe, Asia Pacific, South America, and Middle East & Africa |
|
Countries Covered |
US, Canada, Mexico, Germany, UK, Italy, France, Spain, Japan, China, India, Australia, New Zealand, South Korea, Rest of Asia Pacific, South America, Argentina, Brazil, Chile, Middle East & Africa, Saudi Arabia, UAE, Qatar, and South Africa |
|
Largest Market |
Asia Pacific |
|
Highest Growing Market |
Europe |
According to Stratistics MRC, the Global Biogas Upgrading Market is accounted for $398.8 million in 2023 and is expected to reach $2,010.7 million by 2030 growing at a CAGR of 25.9% during the forecast period. Anaerobic digestion of organic substrates, such as manure, sewage sludge, organic fractions of municipal and industrial waste, and energy crops, results in the production of biogas. Methane and carbon dioxide make up the majority of biogas, which can be used in combined heat and power plants, as automobile fuel, or as a natural gas alternative. Biogas can be produced and used with a number of positive environmental effects. Compared to conventional manure management or landfills, it decreases the release of methane to the atmosphere.
According to the World Biogas Association (WBA), Biogas can reduce global GHG emissions by 10-13% and provide renewable energy from the world's food waste, industrial production wastes, feedstocks from agriculture, and sewage. According to the European Biogas Association, about 18,977 biogas plants and 1,023 biomethane plants were installed, with a total installed capacity of 167TWh and 2.5 billion cubic meters (bcm).
Market Dynamics:
Driver:
Increase in demand for renewable energy
The demand for upgrading biogas has increased as the use of renewable energy grows globally. The main players are concentrating on raising the amount of renewable energy produced. Huge sums of money have been invested in the construction of new biogas facilities as a result of the need for a natural gas replacement. The regulatory organisations have established strict emission standards. The market potential for upgrading biogas has been boosted by these laws. The industry is being driven by new technological advancements in biogas upgrading.
Restraint:
Presence of stringent government regulations
Government rules and policies may have an impact on a bioenergy plant's viability and future course of action. Regulations, targets, commands, impetuses, tax laws, and guidelines are a few examples of policy tools that can be used to impact bio energy activities. Every biomass is unique, and there are differences in how intricate the methods and rules are for each. This factor is preventing the market from expanding.
Opportunity:
Rising oil and gas prices
The need for renewable energy sources has been sparked by the rising price of oil and gas. Natural gas, which is utilised extensively over the world, can be replaced by biogas technology. High-efficiency biogas production expansion could create new opportunities for market expansion. The government's efforts to lessen harmful emissions and carbon footprints could spur economic growth. Furthermore, sizable investments made by well-known players to build new biogas facilities may offer the industry significant growth potential.
Threat:
High cost of production
The process of converting biogas into refined biogas is expensive. The quality of biogas must match that of natural air, which has a lower carbon dioxide content and a higher methane content. By purifying biogas, this is accomplished. The innovation needs to be optimised because the procedure is expensive. The high cost of the biogas refining process makes further investment to boost output to meet the rising demand potentially very challenging for the market's expansion.
Covid-19 Impact
On the market, the COVID-19 epidemic has had a significant effect. The production process was delayed by the transportation problems. The sudden advent of the pandemic led to an industrial shutdown that completely stopped all manufacturing in the majority of global industry. As a result, it has also affected product demand in applications for heat generation. Slow industrial growth has decreased the need for heating, which has a detrimental impact on the need for biogas.
The chemical scrubber segment is expected to be the largest during the forecast period
The chemical scrubber segment is estimated to have a lucrative growth. Biogas Anaerobic digestion produces biogas, which is the first step in cleaning. A device called a chemical scrubber employs chemicals to clean up a gas stream of pollutants. Sulfuric acid, HCl, Hg(CNO), and Cl2 are the most prevalent chemical types found in these systems. As they assist in lowering the particle matter concentration of gases produced during energy production, these devices are frequently employed for biogas upgrading.
The municipal & domestic sewage segment is expected to have the highest CAGR during the forecast period
The municipal & domestic sewage segment is anticipated to witness the fastest CAGR growth during the forecast period, due to increasing population and rapid urbanization. Municipal wastewater treatment facilities are among the greatest choices for producing renewable energy because of their affordability and simplicity of installation, among other benefits. Various governments are concentrating on programmes that aim to increase installed capacity at municipal wastewater treatment plants throughout various regions, which is likely to increase product demand.
Region with Largest share:
Asia Pacific is projected to hold the largest market share during the forecast period owing to population explosion. It has a sizable consumer base, and nations like China and India are independent in the production of renewable energy. Significant elements include favourable regulatory and political support, environmental support, customer support, geopolitical support, agricultural and economic support is driving market growth. Due to all these factors, the global market is projected to grow exponentially.
Region with highest CAGR:
Europe is projected to have the highest CAGR over the forecast period, owing to the rising demand for renewables such as biofuels, biogas, and upgraded biogas. It is a significant area for the production of biogas and is constantly developing new technologies, which may eventually support the expansion of the market. High demand for alternative fuels, strict environmental restrictions, and greater investment in refinery construction are key drivers fostering industry expansion in the area.

Key players in the market
Some of the key players profiled in the Biogas Upgrading Market include Atlas Copco AB, Condorchem Envitech SL, Pentair Plc, Air Liquide SA, HAASE Umwelttechnik GmbH, Xebec Adsorption Inc., DP CleanTech Co. Ltd., Bright Renewables B.V., DMT International, DVO Inc., Jog Waste to Energy Pvt. Ltd., Nacelle Logistics LLC, Veolia Environment SA, Greenlane Renewables Inc., NeoZeo AB, Carbotech Gas Systems GmbH, Anaergia Inc. and MalmbergGruppen AB.
Key Developments:
In April 2023, Anaergia provide PepsiCo with waste-to-biogas solution in South Africa. Anaergia has secured a contract to provide its technologies, engineering and process design for a new facility that will convert food processing waste into renewable energy at PepsiCo’s Simba Chips plant in Johannesburg, South Africa.
In February 2023, Anaergia Inc. announced it has sold its Envo Biogas plant in Tønder, Denmark to Copenhagen Infrastructure Partners’ (CIP) Advanced Bioenergy Fund I, which is developing biogas projects in Europe and North America.
Technologies Covered:
• Pressure swing adsorption (PSA)
• Water scrubber
• Membrane
• Chemical scrubber
• Other Technologies
Applications Covered:
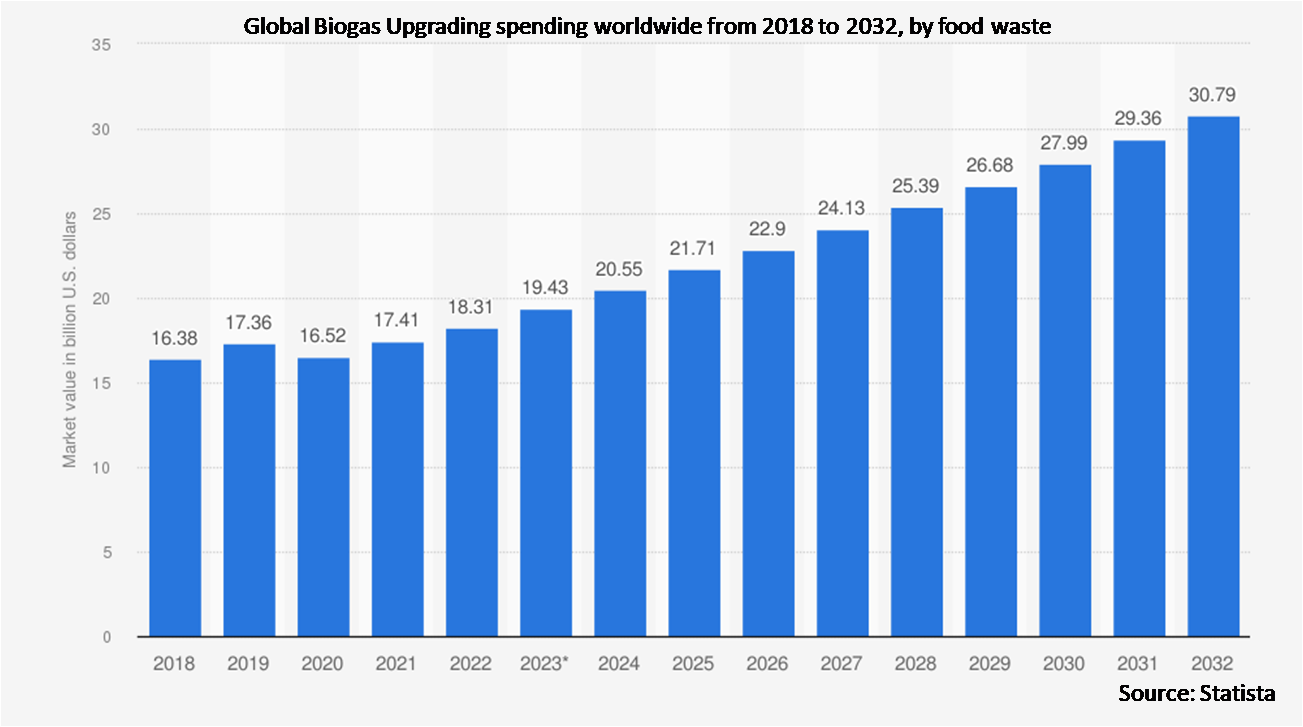
• Food waste
• Agricultural Wastes
• Industrial Wastewater
• Garbage
• Energy Crops Biogas Project
• Municipal & Domestic Sewage
• Other Applications
Regions Covered:
• North America
o US
o Canada
o Mexico
• Europe
o Germany
o UK
o Italy
o France
o Spain
o Rest of Europe
• Asia Pacific
o Japan
o China
o India
o Australia
o New Zealand
o South Korea
o Rest of Asia Pacific
• South America
o Argentina
o Brazil
o Chile
o Rest of South America
• Middle East & Africa
o Saudi Arabia
o UAE
o Qatar
o South Africa
o Rest of Middle East & Africa
What our report offers:
- Market share assessments for the regional and country-level segments
- Strategic recommendations for the new entrants
- Covers Market data for the years 2021, 2022, 2023, 2026, and 2030
- Market Trends (Drivers, Constraints, Opportunities, Threats, Challenges, Investment Opportunities, and recommendations)
- Strategic recommendations in key business segments based on the market estimations
- Competitive landscaping mapping the key common trends
- Company profiling with detailed strategies, financials, and recent developments
- Supply chain trends mapping the latest technological advancements
Free Customization Offerings:
All the customers of this report will be entitled to receive one of the following free customization options:
• Company Profiling
o Comprehensive profiling of additional market players (up to 3)
o SWOT Analysis of key players (up to 3)
• Regional Segmentation
o Market estimations, Forecasts and CAGR of any prominent country as per the client's interest (Note: Depends on feasibility check)
• Competitive Benchmarking
o Benchmarking of key players based on product portfolio, geographical presence, and strategic alliances
Table of Contents
1 Executive Summary
2 Preface
2.1 Abstract
2.2 Stake Holders
2.3 Research Scope
2.4 Research Methodology
2.4.1 Data Mining
2.4.2 Data Analysis
2.4.3 Data Validation
2.4.4 Research Approach
2.5 Research Sources
2.5.1 Primary Research Sources
2.5.2 Secondary Research Sources
2.5.3 Assumptions
3 Market Trend Analysis
3.1 Introduction
3.2 Drivers
3.3 Restraints
3.4 Opportunities
3.5 Threats
3.6 Technology Analysis
3.7 Application Analysis
3.8 Emerging Markets
3.9 Impact of Covid-19
4 Porters Five Force Analysis
4.1 Bargaining power of suppliers
4.2 Bargaining power of buyers
4.3 Threat of substitutes
4.4 Threat of new entrants
4.5 Competitive rivalry
5 Global Biogas Upgrading Market, By Technology
5.1 Introduction
5.2 Pressure swing adsorption (PSA)
5.3 Water scrubber
5.4 Membrane
5.5 Chemical scrubber
5.6 Other Technologies
6 Global Biogas Upgrading Market, By Application
6.1 Introduction
6.2 Food waste
6.3 Agricultural Wastes
6.4 Industrial Wastewater
6.5 Garbage
6.6 Energy Crops Biogas Project
6.7 Municipal & Domestic Sewage
6.8 Other Applications
7 Global Biogas Upgrading Market, By Geography
7.1 Introduction
7.2 North America
7.2.1 US
7.2.2 Canada
7.2.3 Mexico
7.3 Europe
7.3.1 Germany
7.3.2 UK
7.3.3 Italy
7.3.4 France
7.3.5 Spain
7.3.6 Rest of Europe
7.4 Asia Pacific
7.4.1 Japan
7.4.2 China
7.4.3 India
7.4.4 Australia
7.4.5 New Zealand
7.4.6 South Korea
7.4.7 Rest of Asia Pacific
7.5 South America
7.5.1 Argentina
7.5.2 Brazil
7.5.3 Chile
7.5.4 Rest of South America
7.6 Middle East & Africa
7.6.1 Saudi Arabia
7.6.2 UAE
7.6.3 Qatar
7.6.4 South Africa
7.6.5 Rest of Middle East & Africa
8 Key Developments
8.1 Agreements, Partnerships, Collaborations and Joint Ventures
8.2 Acquisitions & Mergers
8.3 New Product Launch
8.4 Expansions
8.5 Other Key Strategies
9 Company Profiling
9.1 Atlas Copco AB
9.2 Condorchem Envitech SL
9.3 Pentair Plc
9.4 Air Liquide SA
9.5 HAASE Umwelttechnik GmbH
9.6 Xebec Adsorption Inc.
9.7 DP CleanTech Co. Ltd.
9.8 Bright Renewables B.V.
9.9 DMT International
9.10 DVO Inc.
9.11 Jog Waste to Energy Pvt. Ltd.
9.12 Nacelle Logistics LLC
9.9 Veolia Environment SA
9.14 Greenlane Renewables Inc.
9.15 NeoZeo AB
9.16 Carbotech Gas Systems GmbH
9.17 Anaergia Inc.
9.18 MalmbergGruppen AB
List of Tables
1 Global Biogas Upgrading Market Outlook, By Region (2021-2030) ($MN)
2 Global Biogas Upgrading Market Outlook, By Technology (2021-2030) ($MN)
3 Global Biogas Upgrading Market Outlook, By Pressure swing adsorption (PSA) (2021-2030) ($MN)
4 Global Biogas Upgrading Market Outlook, By Water scrubber (2021-2030) ($MN)
5 Global Biogas Upgrading Market Outlook, By Membrane (2021-2030) ($MN)
6 Global Biogas Upgrading Market Outlook, By Chemical scrubber (2021-2030) ($MN)
7 Global Biogas Upgrading Market Outlook, By Other Technologies (2021-2030) ($MN)
8 Global Biogas Upgrading Market Outlook, By Application (2021-2030) ($MN)
9 Global Biogas Upgrading Market Outlook, By Food waste (2021-2030) ($MN)
10 Global Biogas Upgrading Market Outlook, By Agricultural Wastes (2021-2030) ($MN)
11 Global Biogas Upgrading Market Outlook, By Industrial Wastewater (2021-2030) ($MN)
12 Global Biogas Upgrading Market Outlook, By Garbage (2021-2030) ($MN)
13 Global Biogas Upgrading Market Outlook, By Energy Crops Biogas Project (2021-2030) ($MN)
14 Global Biogas Upgrading Market Outlook, By Municipal & Domestic Sewage (2021-2030) ($MN)
15 Global Biogas Upgrading Market Outlook, By Other Applications (2021-2030) ($MN)
16 North America Biogas Upgrading Market Outlook, By Country (2021-2030) ($MN)
17 North America Biogas Upgrading Market Outlook, By Technology (2021-2030) ($MN)
18 North America Biogas Upgrading Market Outlook, By Pressure swing adsorption (PSA) (2021-2030) ($MN)
19 North America Biogas Upgrading Market Outlook, By Water scrubber (2021-2030) ($MN)
20 North America Biogas Upgrading Market Outlook, By Membrane (2021-2030) ($MN)
21 North America Biogas Upgrading Market Outlook, By Chemical scrubber (2021-2030) ($MN)
22 North America Biogas Upgrading Market Outlook, By Other Technologies (2021-2030) ($MN)
23 North America Biogas Upgrading Market Outlook, By Application (2021-2030) ($MN)
24 North America Biogas Upgrading Market Outlook, By Food waste (2021-2030) ($MN)
25 North America Biogas Upgrading Market Outlook, By Agricultural Wastes (2021-2030) ($MN)
26 North America Biogas Upgrading Market Outlook, By Industrial Wastewater (2021-2030) ($MN)
27 North America Biogas Upgrading Market Outlook, By Garbage (2021-2030) ($MN)
28 North America Biogas Upgrading Market Outlook, By Energy Crops Biogas Project (2021-2030) ($MN)
29 North America Biogas Upgrading Market Outlook, By Municipal & Domestic Sewage (2021-2030) ($MN)
30 North America Biogas Upgrading Market Outlook, By Other Applications (2021-2030) ($MN)
31 Europe Biogas Upgrading Market Outlook, By Country (2021-2030) ($MN)
32 Europe Biogas Upgrading Market Outlook, By Technology (2021-2030) ($MN)
33 Europe Biogas Upgrading Market Outlook, By Pressure swing adsorption (PSA) (2021-2030) ($MN)
34 Europe Biogas Upgrading Market Outlook, By Water scrubber (2021-2030) ($MN)
35 Europe Biogas Upgrading Market Outlook, By Membrane (2021-2030) ($MN)
36 Europe Biogas Upgrading Market Outlook, By Chemical scrubber (2021-2030) ($MN)
37 Europe Biogas Upgrading Market Outlook, By Other Technologies (2021-2030) ($MN)
38 Europe Biogas Upgrading Market Outlook, By Application (2021-2030) ($MN)
39 Europe Biogas Upgrading Market Outlook, By Food waste (2021-2030) ($MN)
40 Europe Biogas Upgrading Market Outlook, By Agricultural Wastes (2021-2030) ($MN)
41 Europe Biogas Upgrading Market Outlook, By Industrial Wastewater (2021-2030) ($MN)
42 Europe Biogas Upgrading Market Outlook, By Garbage (2021-2030) ($MN)
43 Europe Biogas Upgrading Market Outlook, By Energy Crops Biogas Project (2021-2030) ($MN)
44 Europe Biogas Upgrading Market Outlook, By Municipal & Domestic Sewage (2021-2030) ($MN)
45 Europe Biogas Upgrading Market Outlook, By Other Applications (2021-2030) ($MN)
46 Asia Pacific Biogas Upgrading Market Outlook, By Country (2021-2030) ($MN)
47 Asia Pacific Biogas Upgrading Market Outlook, By Technology (2021-2030) ($MN)
48 Asia Pacific Biogas Upgrading Market Outlook, By Pressure swing adsorption (PSA) (2021-2030) ($MN)
49 Asia Pacific Biogas Upgrading Market Outlook, By Water scrubber (2021-2030) ($MN)
50 Asia Pacific Biogas Upgrading Market Outlook, By Membrane (2021-2030) ($MN)
51 Asia Pacific Biogas Upgrading Market Outlook, By Chemical scrubber (2021-2030) ($MN)
52 Asia Pacific Biogas Upgrading Market Outlook, By Other Technologies (2021-2030) ($MN)
53 Asia Pacific Biogas Upgrading Market Outlook, By Application (2021-2030) ($MN)
54 Asia Pacific Biogas Upgrading Market Outlook, By Food waste (2021-2030) ($MN)
55 Asia Pacific Biogas Upgrading Market Outlook, By Agricultural Wastes (2021-2030) ($MN)
56 Asia Pacific Biogas Upgrading Market Outlook, By Industrial Wastewater (2021-2030) ($MN)
57 Asia Pacific Biogas Upgrading Market Outlook, By Garbage (2021-2030) ($MN)
58 Asia Pacific Biogas Upgrading Market Outlook, By Energy Crops Biogas Project (2021-2030) ($MN)
59 Asia Pacific Biogas Upgrading Market Outlook, By Municipal & Domestic Sewage (2021-2030) ($MN)
60 Asia Pacific Biogas Upgrading Market Outlook, By Other Applications (2021-2030) ($MN)
61 South America Biogas Upgrading Market Outlook, By Country (2021-2030) ($MN)
62 South America Biogas Upgrading Market Outlook, By Technology (2021-2030) ($MN)
63 South America Biogas Upgrading Market Outlook, By Pressure swing adsorption (PSA) (2021-2030) ($MN)
64 South America Biogas Upgrading Market Outlook, By Water scrubber (2021-2030) ($MN)
65 South America Biogas Upgrading Market Outlook, By Membrane (2021-2030) ($MN)
66 South America Biogas Upgrading Market Outlook, By Chemical scrubber (2021-2030) ($MN)
67 South America Biogas Upgrading Market Outlook, By Other Technologies (2021-2030) ($MN)
68 South America Biogas Upgrading Market Outlook, By Application (2021-2030) ($MN)
69 South America Biogas Upgrading Market Outlook, By Food waste (2021-2030) ($MN)
70 South America Biogas Upgrading Market Outlook, By Agricultural Wastes (2021-2030) ($MN)
71 South America Biogas Upgrading Market Outlook, By Industrial Wastewater (2021-2030) ($MN)
72 South America Biogas Upgrading Market Outlook, By Garbage (2021-2030) ($MN)
73 South America Biogas Upgrading Market Outlook, By Energy Crops Biogas Project (2021-2030) ($MN)
74 South America Biogas Upgrading Market Outlook, By Municipal & Domestic Sewage (2021-2030) ($MN)
75 South America Biogas Upgrading Market Outlook, By Other Applications (2021-2030) ($MN)
76 Middle East & Africa Biogas Upgrading Market Outlook, By Country (2021-2030) ($MN)
77 Middle East & Africa Biogas Upgrading Market Outlook, By Technology (2021-2030) ($MN)
78 Middle East & Africa Biogas Upgrading Market Outlook, By Pressure swing adsorption (PSA) (2021-2030) ($MN)
79 Middle East & Africa Biogas Upgrading Market Outlook, By Water scrubber (2021-2030) ($MN)
80 Middle East & Africa Biogas Upgrading Market Outlook, By Membrane (2021-2030) ($MN)
81 Middle East & Africa Biogas Upgrading Market Outlook, By Chemical scrubber (2021-2030) ($MN)
82 Middle East & Africa Biogas Upgrading Market Outlook, By Other Technologies (2021-2030) ($MN)
83 Middle East & Africa Biogas Upgrading Market Outlook, By Application (2021-2030) ($MN)
84 Middle East & Africa Biogas Upgrading Market Outlook, By Food waste (2021-2030) ($MN)
85 Middle East & Africa Biogas Upgrading Market Outlook, By Agricultural Wastes (2021-2030) ($MN)
86 Middle East & Africa Biogas Upgrading Market Outlook, By Industrial Wastewater (2021-2030) ($MN)
87 Middle East & Africa Biogas Upgrading Market Outlook, By Garbage (2021-2030) ($MN)
88 Middle East & Africa Biogas Upgrading Market Outlook, By Energy Crops Biogas Project (2021-2030) ($MN)
89 Middle East & Africa Biogas Upgrading Market Outlook, By Municipal & Domestic Sewage (2021-2030) ($MN)
90 Middle East & Africa Biogas Upgrading Market Outlook, By Other Applications (2021-2030) ($MN)
List of Figures
RESEARCH METHODOLOGY

We at ‘Stratistics’ opt for an extensive research approach which involves data mining, data validation, and data analysis. The various research sources include in-house repository, secondary research, competitor’s sources, social media research, client internal data, and primary research.
Our team of analysts prefers the most reliable and authenticated data sources in order to perform the comprehensive literature search. With access to most of the authenticated data bases our team highly considers the best mix of information through various sources to obtain extensive and accurate analysis.
Each report takes an average time of a month and a team of 4 industry analysts. The time may vary depending on the scope and data availability of the desired market report. The various parameters used in the market assessment are standardized in order to enhance the data accuracy.
Data Mining
The data is collected from several authenticated, reliable, paid and unpaid sources and is filtered depending on the scope & objective of the research. Our reports repository acts as an added advantage in this procedure. Data gathering from the raw material suppliers, distributors and the manufacturers is performed on a regular basis, this helps in the comprehensive understanding of the products value chain. Apart from the above mentioned sources the data is also collected from the industry consultants to ensure the objective of the study is in the right direction.
Market trends such as technological advancements, regulatory affairs, market dynamics (Drivers, Restraints, Opportunities and Challenges) are obtained from scientific journals, market related national & international associations and organizations.
Data Analysis
From the data that is collected depending on the scope & objective of the research the data is subjected for the analysis. The critical steps that we follow for the data analysis include:
- Product Lifecycle Analysis
- Competitor analysis
- Risk analysis
- Porters Analysis
- PESTEL Analysis
- SWOT Analysis
The data engineering is performed by the core industry experts considering both the Marketing Mix Modeling and the Demand Forecasting. The marketing mix modeling makes use of multiple-regression techniques to predict the optimal mix of marketing variables. Regression factor is based on a number of variables and how they relate to an outcome such as sales or profits.
Data Validation
The data validation is performed by the exhaustive primary research from the expert interviews. This includes telephonic interviews, focus groups, face to face interviews, and questionnaires to validate our research from all aspects. The industry experts we approach come from the leading firms, involved in the supply chain ranging from the suppliers, distributors to the manufacturers and consumers so as to ensure an unbiased analysis.
We are in touch with more than 15,000 industry experts with the right mix of consultants, CEO's, presidents, vice presidents, managers, experts from both supply side and demand side, executives and so on.
The data validation involves the primary research from the industry experts belonging to:
- Leading Companies
- Suppliers & Distributors
- Manufacturers
- Consumers
- Industry/Strategic Consultants
Apart from the data validation the primary research also helps in performing the fill gap research, i.e. providing solutions for the unmet needs of the research which helps in enhancing the reports quality.
For more details about research methodology, kindly write to us at info@strategymrc.com
Frequently Asked Questions
In case of any queries regarding this report, you can contact the customer service by filing the “Inquiry Before Buy” form available on the right hand side. You may also contact us through email: info@strategymrc.com or phone: +1-301-202-5929
Yes, the samples are available for all the published reports. You can request them by filling the “Request Sample” option available in this page.
Yes, you can request a sample with your specific requirements. All the customized samples will be provided as per the requirement with the real data masked.
All our reports are available in Digital PDF format. In case if you require them in any other formats, such as PPT, Excel etc you can submit a request through “Inquiry Before Buy” form available on the right hand side. You may also contact us through email: info@strategymrc.com or phone: +1-301-202-5929
We offer a free 15% customization with every purchase. This requirement can be fulfilled for both pre and post sale. You may send your customization requirements through email at info@strategymrc.com or call us on +1-301-202-5929.
We have 3 different licensing options available in electronic format.
- Single User Licence: Allows one person, typically the buyer, to have access to the ordered product. The ordered product cannot be distributed to anyone else.
- 2-5 User Licence: Allows the ordered product to be shared among a maximum of 5 people within your organisation.
- Corporate License: Allows the product to be shared among all employees of your organisation regardless of their geographical location.
All our reports are typically be emailed to you as an attachment.
To order any available report you need to register on our website. The payment can be made either through CCAvenue or PayPal payments gateways which accept all international cards.
We extend our support to 6 months post sale. A post sale customization is also provided to cover your unmet needs in the report.
Request Customization
We provide a free 15% customization on every purchase. This requirement can be fulfilled for both pre and post sale. You may send your customization requirements through email at info@strategymrc.com or call us on +1-301-202-5929.
Note: This customization is absolutely free until it falls under the 15% bracket. If your requirement exceeds this a feasibility check will be performed. Post that, a quote will be provided along with the timelines.
WHY CHOOSE US ?

Assured Quality
Best in class reports with high standard of research integrity

24X7 Research Support
Continuous support to ensure the best customer experience.

Free Customization
Adding more values to your product of interest.

Safe & Secure Access
Providing a secured environment for all online transactions.

Trusted by 600+ Brands
Serving the most reputed brands across the world.