
DC Power Supplies Market
Direct Current (DC) Power Supplies - Global Market Outlook (2019-2027)
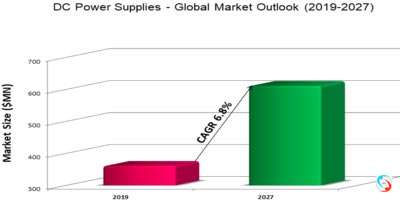
According to Stratistics MRC, the Global DC Power Supplies Market is accounted for $361.00 million in 2019 and is expected to reach $611.05 million by 2027 growing at a CAGR of 6.8% during the forecast period. Some of the key factors propelling the market growth include increasing demand for energy-efficient DC power supplies, growing demand for DC power supplies in IoT test applications, and rise in demand for AC-DC power supplies. However, imposition of regional/country-wise regulatory compliance and safety standards is likely to hamper the market.
DC power supplies are power supplies which produce an output DC voltage. Power supplies are devices that deliver electric power to one or several loads. They generate the output power by converting an input signal into an output signal (in this case, a DC output). DC power supplies use AC mains electricity as an energy source.
By output power, the high output (100–250 kW) segment is expected to be the significant-growing market during the forecast period, due to the requirement to test the products that undergo harsh, rugged and extensive environmental conditions for operational duties by military & avionics is expected to drive the growth for the high output power supplies. The high output power supplies are mainly the programmable ones primarily used to for automotive test equipment (ATE), semiconductor fabrications, aerospace & military, energy storage, and others. A few key features of these high output power supplies are consistent controls, broad voltage-current range, high frequency, and enhanced design.
On the basis of geography, North America is expected to have considerable market growth during the forecast period, due to the growing wireless communication & infrastructure and aerospace & defense segment in countries such as the US & Canada is likely to boost the demand of DC power supplies market in the region. Moreover, expansion of wireless network & the advancements in medical equipment in the US along with stringent energy efficiency regulations and standards for power electronic products in the US and Canada are likely to contribute to the growth of the DC power supplies market.
Some of the key players in DC Power Supplies Market include Artesyn Embedded Power, Acopian, AIM-TTI, Sophpower Electronics, Good Will Instrument, AMETEK, Chroma ATE, Keysight Technologies, Itech Electronic, Tektronix, Matsusada Precision, Kikusui Electronics, Adaptive Power Systems, Zenone Elettronica, TDK Lambda, Mean Well, Rohde & Schwarz, Magna-Power, Regatron, and B&K Precision.
Output Power Covered:
• High Output (100–250 kW)
• Medium Output (10–100 kW)
• Low Output (Up to 10 kW)
Types Covered:
• DC-DC
• AC-DC
Products Covered:
• Multiple-output
• Single-output
Applications Covered:
• Energy
• Wireless Communication & Infrastructure
• Aerospace, Defense, & Government Services
• Automotive
• Industrial Electronics
• Consumer Electronics
Sales Channels Covered:
• Aftermarket
• Manufacturer/Distributor/Service Provider
Regions Covered:
• North America
o US
o Canada
o Mexico
• Europe
o Germany
o France
o Italy
o UK
o Spain
o Rest of Europe
• Asia Pacific
o Japan
o China
o India
o Australia
o New Zealand
o Rest of Asia Pacific
• South America
o Argentina
o Brazil
o Chile
o Rest of South America
• Middle East & Africa
o Saudi Arabia
o UAE
o Qatar
o South Africa
o Rest of Middle East & Africa
What our report offers:
- Market share assessments for the regional and country-level segments
- Strategic recommendations for the new entrants
- Covers Market data for the years 2018, 2019, 2020, 2024 and 2027
- Market Trends (Drivers, Constraints, Opportunities, Threats, Challenges, Investment Opportunities, and recommendations)
- Strategic analysis: Drivers and Constraints, Product/Technology Analysis, Porter’s five forces analysis, SWOT analysis, etc.
- Strategic recommendations in key business segments based on the market estimations
- Competitive landscaping mapping the key common trends
- Company profiling with detailed strategies, financials, and recent developments
- Supply chain trends mapping the latest technological advancements
Free Customization Offerings:
All the customers of this report will be entitled to receive one of the following free customization options:
• Company Profiling
o Comprehensive profiling of additional market players (up to 3)
o SWOT Analysis of key players (up to 3)
• Regional Segmentation
o Market estimations, Forecasts and CAGR of any prominent country as per the client's interest (Note: Depends on feasibility check)
• Competitive Benchmarking
o Benchmarking of key players based on product portfolio, geographical presence, and strategic alliances
Table of Contents
1 Executive Summary
2 Preface
2.1 Abstract
2.2 Stake Holders
2.3 Research Scope
2.4 Research Methodology
2.4.1 Data Mining
2.4.2 Data Analysis
2.4.3 Data Validation
2.4.4 Research Approach
2.5 Research Sources
2.5.1 Primary Research Sources
2.5.2 Secondary Research Sources
2.5.3 Assumptions
3 Market Trend Analysis
3.1 Introduction
3.2 Drivers
3.3 Restraints
3.4 Opportunities
3.5 Threats
3.6 Product Analysis
3.7 Application Analysis
3.8 Emerging Markets
3.9 Impact of Covid-19
4 Porters Five Force Analysis
4.1 Bargaining power of suppliers
4.2 Bargaining power of buyers
4.3 Threat of substitutes
4.4 Threat of new entrants
4.5 Competitive rivalry
5 Global DC Power Supplies Market, By Output Power
5.1 Introduction
5.2 High Output (100–250 kW)
5.3 Medium Output (10–100 kW)
5.4 Low Output (Up to 10 kW)
6 Global DC Power Supplies Market, By Type
6.1 Introduction
6.2 DC-DC
6.3 AC-DC
7 Global DC Power Supplies Market, By Product
7.1 Introduction
7.2 Multiple-output
7.3 Single-output
8 Global DC Power Supplies Market, By Application
8.1 Introduction
8.2 Energy
8.3 Wireless Communication & Infrastructure
8.4 Aerospace, Defense, & Government Services
8.5 Automotive
8.6 Industrial Electronics
8.7 Consumer Electronics
9 Global DC Power Supplies Market, By Sales Channel
9.1 Introduction
9.2 Aftermarket
9.3 Manufacturer/Distributor/Service Provider
10 Global DC Power Supplies Market, By Geography
10.1 Introduction
10.2 North America
10.2.1 US
10.2.2 Canada
10.2.3 Mexico
10.3 Europe
10.3.1 Germany
10.3.2 UK
10.3.3 Italy
10.3.4 France
10.3.5 Spain
10.3.6 Rest of Europe
10.4 Asia Pacific
10.4.1 Japan
10.4.2 China
10.4.3 India
10.4.4 Australia
10.4.5 New Zealand
10.4.6 South Korea
10.4.7 Rest of Asia Pacific
10.5 South America
10.5.1 Argentina
10.5.2 Brazil
10.5.3 Chile
10.5.4 Rest of South America
10.6 Middle East & Africa
10.6.1 Saudi Arabia
10.6.2 UAE
10.6.3 Qatar
10.6.4 South Africa
10.6.5 Rest of Middle East & Africa
11 Key Developments
11.1 Agreements, Partnerships, Collaborations and Joint Ventures
11.2 Acquisitions & Mergers
11.3 New Product Launch
11.4 Expansions
11.5 Other Key Strategies
12 Company Profiling
12.1 Artesyn Embedded Power
12.2 Acopian
12.3 AIM-TTI
12.4 Sophpower Electronics
12.5 Good Will Instrument
12.6 AMETEK
12.7 Chroma ATE
12.8 Keysight Technologies
12.9 Itech Electronic
12.10 Tektronix
12.11 Matsusada Precision
12.12 Kikusui Electronics
12.13 Adaptive Power Systems
12.14 Zenone Elettronica
12.15 TDK Lambda
12.16 Mean Well
12.17 Rohde & Schwarz
12.18 Magna-Power
12.19 Regatron
12.20 B&K Precision
List of Tables
1 Global DC Power Supplies Market Outlook, By Region (2018-2027) ($MN)
2 Global DC Power Supplies Market Outlook, By Output Power (2018-2027) ($MN)
3 Global DC Power Supplies Market Outlook, By High Output (100–250 kW) (2018-2027) ($MN)
4 Global DC Power Supplies Market Outlook, By Medium Output (10–100 kW) (2018-2027) ($MN)
5 Global DC Power Supplies Market Outlook, By Low Output (Up to 10 kW) (2018-2027) ($MN)
6 Global DC Power Supplies Market Outlook, By Type (2018-2027) ($MN)
7 Global DC Power Supplies Market Outlook, By DC-DC (2018-2027) ($MN)
8 Global DC Power Supplies Market Outlook, By AC-DC (2018-2027) ($MN)
9 Global DC Power Supplies Market Outlook, By Product (2018-2027) ($MN)
10 Global DC Power Supplies Market Outlook, By Multiple-output (2018-2027) ($MN)
11 Global DC Power Supplies Market Outlook, By Single-output (2018-2027) ($MN)
12 Global DC Power Supplies Market Outlook, By Application (2018-2027) ($MN)
13 Global DC Power Supplies Market Outlook, By Energy (2018-2027) ($MN)
14 Global DC Power Supplies Market Outlook, By Wireless Communication & Infrastructure (2018-2027) ($MN)
15 Global DC Power Supplies Market Outlook, By Aerospace, Defense, & Government Services (2018-2027) ($MN)
16 Global DC Power Supplies Market Outlook, By Automotive (2018-2027) ($MN)
17 Global DC Power Supplies Market Outlook, By Industrial Electronics (2018-2027) ($MN)
18 Global DC Power Supplies Market Outlook, By Consumer Electronics (2018-2027) ($MN)
19 Global DC Power Supplies Market Outlook, By Sales Channel (2018-2027) ($MN)
20 Global DC Power Supplies Market Outlook, By Aftermarket (2018-2027) ($MN)
21 Global DC Power Supplies Market Outlook, By Manufacturer/Distributor/Service Provider (2018-2027) ($MN)
22 North America DC Power Supplies Market Outlook, By Country (2018-2027) ($MN)
23 North America DC Power Supplies Market Outlook, By Output Power (2018-2027) ($MN)
24 North America DC Power Supplies Market Outlook, By High Output (100–250 kW) (2018-2027) ($MN)
25 North America DC Power Supplies Market Outlook, By Medium Output (10–100 kW) (2018-2027) ($MN)
26 North America DC Power Supplies Market Outlook, By Low Output (Up to 10 kW) (2018-2027) ($MN)
27 North America DC Power Supplies Market Outlook, By Type (2018-2027) ($MN)
28 North America DC Power Supplies Market Outlook, By DC-DC (2018-2027) ($MN)
29 North America DC Power Supplies Market Outlook, By AC-DC (2018-2027) ($MN)
30 North America DC Power Supplies Market Outlook, By Product (2018-2027) ($MN)
31 North America DC Power Supplies Market Outlook, By Multiple-output (2018-2027) ($MN)
32 North America DC Power Supplies Market Outlook, By Single-output (2018-2027) ($MN)
33 North America DC Power Supplies Market Outlook, By Application (2018-2027) ($MN)
34 North America DC Power Supplies Market Outlook, By Energy (2018-2027) ($MN)
35 North America DC Power Supplies Market Outlook, By Wireless Communication & Infrastructure (2018-2027) ($MN)
36 North America DC Power Supplies Market Outlook, By Aerospace, Defense, & Government Services (2018-2027) ($MN)
37 North America DC Power Supplies Market Outlook, By Automotive (2018-2027) ($MN)
38 North America DC Power Supplies Market Outlook, By Industrial Electronics (2018-2027) ($MN)
39 North America DC Power Supplies Market Outlook, By Consumer Electronics (2018-2027) ($MN)
40 North America DC Power Supplies Market Outlook, By Sales Channel (2018-2027) ($MN)
41 North America DC Power Supplies Market Outlook, By Aftermarket (2018-2027) ($MN)
42 North America DC Power Supplies Market Outlook, By Manufacturer/Distributor/Service Provider (2018-2027) ($MN)
43 Europe DC Power Supplies Market Outlook, By Country (2018-2027) ($MN)
44 Europe DC Power Supplies Market Outlook, By Output Power (2018-2027) ($MN)
45 Europe DC Power Supplies Market Outlook, By High Output (100–250 kW) (2018-2027) ($MN)
46 Europe DC Power Supplies Market Outlook, By Medium Output (10–100 kW) (2018-2027) ($MN)
47 Europe DC Power Supplies Market Outlook, By Low Output (Up to 10 kW) (2018-2027) ($MN)
48 Europe DC Power Supplies Market Outlook, By Type (2018-2027) ($MN)
49 Europe DC Power Supplies Market Outlook, By DC-DC (2018-2027) ($MN)
50 Europe DC Power Supplies Market Outlook, By AC-DC (2018-2027) ($MN)
51 Europe DC Power Supplies Market Outlook, By Product (2018-2027) ($MN)
52 Europe DC Power Supplies Market Outlook, By Multiple-output (2018-2027) ($MN)
53 Europe DC Power Supplies Market Outlook, By Single-output (2018-2027) ($MN)
54 Europe DC Power Supplies Market Outlook, By Application (2018-2027) ($MN)
55 Europe DC Power Supplies Market Outlook, By Energy (2018-2027) ($MN)
56 Europe DC Power Supplies Market Outlook, By Wireless Communication & Infrastructure (2018-2027) ($MN)
57 Europe DC Power Supplies Market Outlook, By Aerospace, Defense, & Government Services (2018-2027) ($MN)
58 Europe DC Power Supplies Market Outlook, By Automotive (2018-2027) ($MN)
59 Europe DC Power Supplies Market Outlook, By Industrial Electronics (2018-2027) ($MN)
60 Europe DC Power Supplies Market Outlook, By Consumer Electronics (2018-2027) ($MN)
61 Europe DC Power Supplies Market Outlook, By Sales Channel (2018-2027) ($MN)
62 Europe DC Power Supplies Market Outlook, By Aftermarket (2018-2027) ($MN)
63 Europe DC Power Supplies Market Outlook, By Manufacturer/Distributor/Service Provider (2018-2027) ($MN)
64 Asia Pacific DC Power Supplies Market Outlook, By Country (2018-2027) ($MN)
65 Asia Pacific DC Power Supplies Market Outlook, By Output Power (2018-2027) ($MN)
66 Asia Pacific DC Power Supplies Market Outlook, By High Output (100–250 kW) (2018-2027) ($MN)
67 Asia Pacific DC Power Supplies Market Outlook, By Medium Output (10–100 kW) (2018-2027) ($MN)
68 Asia Pacific DC Power Supplies Market Outlook, By Low Output (Up to 10 kW) (2018-2027) ($MN)
69 Asia Pacific DC Power Supplies Market Outlook, By Type (2018-2027) ($MN)
70 Asia Pacific DC Power Supplies Market Outlook, By DC-DC (2018-2027) ($MN)
71 Asia Pacific DC Power Supplies Market Outlook, By AC-DC (2018-2027) ($MN)
72 Asia Pacific DC Power Supplies Market Outlook, By Product (2018-2027) ($MN)
73 Asia Pacific DC Power Supplies Market Outlook, By Multiple-output (2018-2027) ($MN)
74 Asia Pacific DC Power Supplies Market Outlook, By Single-output (2018-2027) ($MN)
75 Asia Pacific DC Power Supplies Market Outlook, By Application (2018-2027) ($MN)
76 Asia Pacific DC Power Supplies Market Outlook, By Energy (2018-2027) ($MN)
77 Asia Pacific DC Power Supplies Market Outlook, By Wireless Communication & Infrastructure (2018-2027) ($MN)
78 Asia Pacific DC Power Supplies Market Outlook, By Aerospace, Defense, & Government Services (2018-2027) ($MN)
79 Asia Pacific DC Power Supplies Market Outlook, By Automotive (2018-2027) ($MN)
80 Asia Pacific DC Power Supplies Market Outlook, By Industrial Electronics (2018-2027) ($MN)
81 Asia Pacific DC Power Supplies Market Outlook, By Consumer Electronics (2018-2027) ($MN)
82 Asia Pacific DC Power Supplies Market Outlook, By Sales Channel (2018-2027) ($MN)
83 Asia Pacific DC Power Supplies Market Outlook, By Aftermarket (2018-2027) ($MN)
84 Asia Pacific DC Power Supplies Market Outlook, By Manufacturer/Distributor/Service Provider (2018-2027) ($MN)
85 South America DC Power Supplies Market Outlook, By Country (2018-2027) ($MN)
86 South America DC Power Supplies Market Outlook, By Output Power (2018-2027) ($MN)
87 South America DC Power Supplies Market Outlook, By High Output (100–250 kW) (2018-2027) ($MN)
88 South America DC Power Supplies Market Outlook, By Medium Output (10–100 kW) (2018-2027) ($MN)
89 South America DC Power Supplies Market Outlook, By Low Output (Up to 10 kW) (2018-2027) ($MN)
90 South America DC Power Supplies Market Outlook, By Type (2018-2027) ($MN)
91 South America DC Power Supplies Market Outlook, By DC-DC (2018-2027) ($MN)
92 South America DC Power Supplies Market Outlook, By AC-DC (2018-2027) ($MN)
93 South America DC Power Supplies Market Outlook, By Product (2018-2027) ($MN)
94 South America DC Power Supplies Market Outlook, By Multiple-output (2018-2027) ($MN)
95 South America DC Power Supplies Market Outlook, By Single-output (2018-2027) ($MN)
96 South America DC Power Supplies Market Outlook, By Application (2018-2027) ($MN)
97 South America DC Power Supplies Market Outlook, By Energy (2018-2027) ($MN)
98 South America DC Power Supplies Market Outlook, By Wireless Communication & Infrastructure (2018-2027) ($MN)
99 South America DC Power Supplies Market Outlook, By Aerospace, Defense, & Government Services (2018-2027) ($MN)
100 South America DC Power Supplies Market Outlook, By Automotive (2018-2027) ($MN)
101 South America DC Power Supplies Market Outlook, By Industrial Electronics (2018-2027) ($MN)
102 South America DC Power Supplies Market Outlook, By Consumer Electronics (2018-2027) ($MN)
103 South America DC Power Supplies Market Outlook, By Sales Channel (2018-2027) ($MN)
104 South America DC Power Supplies Market Outlook, By Aftermarket (2018-2027) ($MN)
105 South America DC Power Supplies Market Outlook, By Manufacturer/Distributor/Service Provider (2018-2027) ($MN)
106 Middle East & Africa DC Power Supplies Market Outlook, By Country (2018-2027) ($MN)
107 Middle East & Africa DC Power Supplies Market Outlook, By Output Power (2018-2027) ($MN)
108 Middle East & Africa DC Power Supplies Market Outlook, By High Output (100–250 kW) (2018-2027) ($MN)
109 Middle East & Africa DC Power Supplies Market Outlook, By Medium Output (10–100 kW) (2018-2027) ($MN)
110 Middle East & Africa DC Power Supplies Market Outlook, By Low Output (Up to 10 kW) (2018-2027) ($MN)
111 Middle East & Africa DC Power Supplies Market Outlook, By Type (2018-2027) ($MN)
112 Middle East & Africa DC Power Supplies Market Outlook, By DC-DC (2018-2027) ($MN)
113 Middle East & Africa DC Power Supplies Market Outlook, By AC-DC (2018-2027) ($MN)
114 Middle East & Africa DC Power Supplies Market Outlook, By Product (2018-2027) ($MN)
115 Middle East & Africa DC Power Supplies Market Outlook, By Multiple-output (2018-2027) ($MN)
116 Middle East & Africa DC Power Supplies Market Outlook, By Single-output (2018-2027) ($MN)
117 Middle East & Africa DC Power Supplies Market Outlook, By Application (2018-2027) ($MN)
118 Middle East & Africa DC Power Supplies Market Outlook, By Energy (2018-2027) ($MN)
119 Middle East & Africa DC Power Supplies Market Outlook, By Wireless Communication & Infrastructure (2018-2027) ($MN)
120 Middle East & Africa DC Power Supplies Market Outlook, By Aerospace, Defense, & Government Services (2018-2027) ($MN)
121 Middle East & Africa DC Power Supplies Market Outlook, By Automotive (2018-2027) ($MN)
122 Middle East & Africa DC Power Supplies Market Outlook, By Industrial Electronics (2018-2027) ($MN)
123 Middle East & Africa DC Power Supplies Market Outlook, By Consumer Electronics (2018-2027) ($MN)
124 Middle East & Africa DC Power Supplies Market Outlook, By Sales Channel (2018-2027) ($MN)
125 Middle East & Africa DC Power Supplies Market Outlook, By Aftermarket (2018-2027) ($MN)
126 Middle East & Africa DC Power Supplies Market Outlook, By Manufacturer/Distributor/Service Provider (2018-2027) ($MN)
List of Figures
RESEARCH METHODOLOGY

We at ‘Stratistics’ opt for an extensive research approach which involves data mining, data validation, and data analysis. The various research sources include in-house repository, secondary research, competitor’s sources, social media research, client internal data, and primary research.
Our team of analysts prefers the most reliable and authenticated data sources in order to perform the comprehensive literature search. With access to most of the authenticated data bases our team highly considers the best mix of information through various sources to obtain extensive and accurate analysis.
Each report takes an average time of a month and a team of 4 industry analysts. The time may vary depending on the scope and data availability of the desired market report. The various parameters used in the market assessment are standardized in order to enhance the data accuracy.
Data Mining
The data is collected from several authenticated, reliable, paid and unpaid sources and is filtered depending on the scope & objective of the research. Our reports repository acts as an added advantage in this procedure. Data gathering from the raw material suppliers, distributors and the manufacturers is performed on a regular basis, this helps in the comprehensive understanding of the products value chain. Apart from the above mentioned sources the data is also collected from the industry consultants to ensure the objective of the study is in the right direction.
Market trends such as technological advancements, regulatory affairs, market dynamics (Drivers, Restraints, Opportunities and Challenges) are obtained from scientific journals, market related national & international associations and organizations.
Data Analysis
From the data that is collected depending on the scope & objective of the research the data is subjected for the analysis. The critical steps that we follow for the data analysis include:
- Product Lifecycle Analysis
- Competitor analysis
- Risk analysis
- Porters Analysis
- PESTEL Analysis
- SWOT Analysis
The data engineering is performed by the core industry experts considering both the Marketing Mix Modeling and the Demand Forecasting. The marketing mix modeling makes use of multiple-regression techniques to predict the optimal mix of marketing variables. Regression factor is based on a number of variables and how they relate to an outcome such as sales or profits.
Data Validation
The data validation is performed by the exhaustive primary research from the expert interviews. This includes telephonic interviews, focus groups, face to face interviews, and questionnaires to validate our research from all aspects. The industry experts we approach come from the leading firms, involved in the supply chain ranging from the suppliers, distributors to the manufacturers and consumers so as to ensure an unbiased analysis.
We are in touch with more than 15,000 industry experts with the right mix of consultants, CEO's, presidents, vice presidents, managers, experts from both supply side and demand side, executives and so on.
The data validation involves the primary research from the industry experts belonging to:
- Leading Companies
- Suppliers & Distributors
- Manufacturers
- Consumers
- Industry/Strategic Consultants
Apart from the data validation the primary research also helps in performing the fill gap research, i.e. providing solutions for the unmet needs of the research which helps in enhancing the reports quality.
For more details about research methodology, kindly write to us at info@strategymrc.com
Frequently Asked Questions
In case of any queries regarding this report, you can contact the customer service by filing the “Inquiry Before Buy” form available on the right hand side. You may also contact us through email: info@strategymrc.com or phone: +1-301-202-5929
Yes, the samples are available for all the published reports. You can request them by filling the “Request Sample” option available in this page.
Yes, you can request a sample with your specific requirements. All the customized samples will be provided as per the requirement with the real data masked.
All our reports are available in Digital PDF format. In case if you require them in any other formats, such as PPT, Excel etc you can submit a request through “Inquiry Before Buy” form available on the right hand side. You may also contact us through email: info@strategymrc.com or phone: +1-301-202-5929
We offer a free 15% customization with every purchase. This requirement can be fulfilled for both pre and post sale. You may send your customization requirements through email at info@strategymrc.com or call us on +1-301-202-5929.
We have 3 different licensing options available in electronic format.
- Single User Licence: Allows one person, typically the buyer, to have access to the ordered product. The ordered product cannot be distributed to anyone else.
- 2-5 User Licence: Allows the ordered product to be shared among a maximum of 5 people within your organisation.
- Corporate License: Allows the product to be shared among all employees of your organisation regardless of their geographical location.
All our reports are typically be emailed to you as an attachment.
To order any available report you need to register on our website. The payment can be made either through CCAvenue or PayPal payments gateways which accept all international cards.
We extend our support to 6 months post sale. A post sale customization is also provided to cover your unmet needs in the report.
Request Customization
We provide a free 15% customization on every purchase. This requirement can be fulfilled for both pre and post sale. You may send your customization requirements through email at info@strategymrc.com or call us on +1-301-202-5929.
Note: This customization is absolutely free until it falls under the 15% bracket. If your requirement exceeds this a feasibility check will be performed. Post that, a quote will be provided along with the timelines.
WHY CHOOSE US ?

Assured Quality
Best in class reports with high standard of research integrity

24X7 Research Support
Continuous support to ensure the best customer experience.

Free Customization
Adding more values to your product of interest.

Safe & Secure Access
Providing a secured environment for all online transactions.

Trusted by 600+ Brands
Serving the most reputed brands across the world.