
E Commerce Packaging Market
E Commerce Packaging Market Forecasts to 2028 - Global Analysis By Material (Plastics, Paper & Paperboard, Corrugated Board, Glass and Corrugated Boxes), Form (Bags, Tapes, Labels, Protective Packaging, Mailers and Boxes), End-User (Pharmaceuticals, Automotive, Retail, Food and Beverages, Household, Personal Care, Electronics and Electrical, Apparels and Accessories and Consumer Electronics) and Geography

|
Years Covered |
2020-2028 |
|
Estimated Year Value (2022) |
US $54.08 BN |
|
Projected Year Value (2028) |
US $116.24 BN |
|
CAGR (2022 - 2028) |
13.6% |
|
Regions Covered |
North America, Europe, Asia Pacific, South America, and Middle East & Africa |
|
Countries Covered |
US, Canada, Mexico, Germany, UK, Italy, France, Spain, Japan, China, India, Australia, New Zealand, South Korea, Rest of Asia Pacific, South America, Argentina, Brazil, Chile, Middle East & Africa, Saudi Arabia, UAE, Qatar, and South Africa |
|
Largest Market |
Asia Pacific |
|
Highest Growing Market |
North America |
According to Stratistics MRC, the Global E Commerce Packaging Market is accounted for $54.08 billion in 2022 and is expected to reach $116.24 billion by 2028 growing at a CAGR of 13.6% during the forecast period. E-commerce packaging is a strategy used to transfer, store, and protect the package's components until it is delivered to the customer by the supplier. Depending on the requirements of the item's contents, the products differ in terms of size, form, quality, and rigidity. Cross-border shopping's rising popularity has fueled a rise in demand for efficient and high-quality packaging. The market for profitable and expensive packaging has experienced a significant increase due to the growing popularity of cross-border shopping.
According to Associated Chambers of Commerce and Industry in India (ASSOCHAM), an industry trade association, the Indian e-commerce market accounted for US$ 41.34 billion in 2021 and is projected to exceed US$ 50 billion by 2025.
Market Dynamics:
Driver:
Expansion of e-commerce industry
The use of packaging products and other alternatives has increased as e-commerce and electronic goods industry have become more popular. Online shopping has advantages over conventional retailers, including free delivery, rapid deliveries, and simple easy returns. These benefits have propelled the consumer benefits of online shopping, which are predicted to drive global expansion.
Restraint:
Lack of awareness
The expansion of the e-commerce packaging market is hampered by the lack of awareness of e-commerce in rural areas, and product purchases that are performed online are also hindered by a lack of trust in online marketplaces. This limits the e-commerce packaging market's expansion. Additionally, a poor structure and a lack of technological expertise have a negative impact.
Opportunity:
Technology advancement
Due to the increasing number of product developments, the market growth rate will be boosted by new market opportunities. Market expansion is also being aided by a number of product innovations aimed at enlightening design and manufacturing methods. Manufacturers would likely benefit from new opportunities resulting from technological developments in the development of efficient and environmentally friendly e-commerce packaging. Additionally, an increase in strategic partnerships and the emergence of new markets will act as market drivers and increase favorable chances for the industry's growth rate.
Threat:
Lack of universal directives
During the projected period, market growth is predicted to be constrained by a lack of international laws regulating applications of e-commerce packaging. Each country has its own set of regulations regarding the use and applications of e-commerce packaging. Such national regulations pose a challenge for key players, which in turn inhibit investment in the e-commerce packaging market and restrict market expansion.
Covid-19 Impact:
The market's growth was boosted by COVID-19, but it also impeded the flow of individuals and commodities. E-commerce played a critical role in the outbreak due to the increasing demand for necessities such as food, medicine, vegetables, and other products. By restricting the number of individuals migrating around and offering door-to-door services, e-commerce platforms reduce the spread of viruses and infectious diseases. The increase in pandemic accelerated the commercial expansion of the e-commerce packaging industry.
The corrugated boxes segment is expected to be the largest during the forecast period
The dominance of the corrugated boxes segment in this market is attributed to the benefits that all these boxes offer, such as resistance, recyclability, durability, and minimal environmental impact. Furthermore, the segment's growth will also be aided by changing environmental regulations and an increasing demand for sustainable packaging products.
The consumer electronics segment is expected to have the highest CAGR during the forecast period
Due to the surge in smartphone demand driven by accelerating technological advancements and digitalization activities, this market is expanding globally. Additionally, the segment's growth has been significantly amplified by increased disposable income and population expansion. Furthermore, security, communication, and entertainment components of consumer lifestyles are being moulded by consumer electronics. The industry segments with the shortest changeover periods are in consumer electronics.
Region with largest share:
The demand for e-commerce packaging solutions in Asia Pacific is being boosted by government initiatives that are promoting digitization and introducing many people to online modes of e-commerce. Additionally, India's favourable FDI policy of 100% FDI continues to inspire companies like Amazon to build strong base in the country. Furthermore, rising e-commerce shipments in the areas are being fueled by an expanding customer base, which is being fueled by the expansion of major economies such as China and India. As a result, it will increase the demand for packaging solutions in the region.
Region with highest CAGR:
Due to the highest global internet penetration rate, the market in North America is expanding rapidly. Additionally, the region's increasing celebrity and influencer culture, the increasing acceptance of fashion as well as other lifestyle choices will spur market expansion.

Key players in the market
Some of the key players in E-Commerce Packaging market include Nippon paper industries co., ltd, International Paper, Ds Smith, Rajapack Ltd, Sealed Air, Packaging Corporation of America, Klabin SA, AMCOR PLC, Smurfit Kappa Group PLC, Georgia-Pacific LLC, Shorr Packaging Corporation, Mondi PLC, Pacman LLC, Rengo Co. Ltd. and Orora Packaging Australia Pty Ltd.
Key Developments:
In June 2022, Amcor plc, a global leader in developing and producing sustainable packaging solutions, unveiled a product rebranding design to give customers a clearer, holistic view of its growing portfolio of more sustainable packaging solutions. Through this rebranding Amcor plc will provide customers with greater visibility and transparency of their extensive product portfolio.
In March 2022, The International Paper have invested nearly US$ 24.15 million in plants of Mortagne (France) and Chalon (France) to adapt their production capacity to growth of the e-commerce sector and to offer even more sustainable packaging to customers. As part of the project, up to 50 new positions will be created in France.
In Jan 2022, Amcor plc, launched a new platform of paper-based packaging products AmFiberTM. Amcor plc is engaged in developing and producing sustainable packaging solutions. AmFiber innovations aim to redefine the capabilities of traditional paper packaging, providing a wider range of features and functional benefits to meet the changing needs of consumers.
Materials Covered:
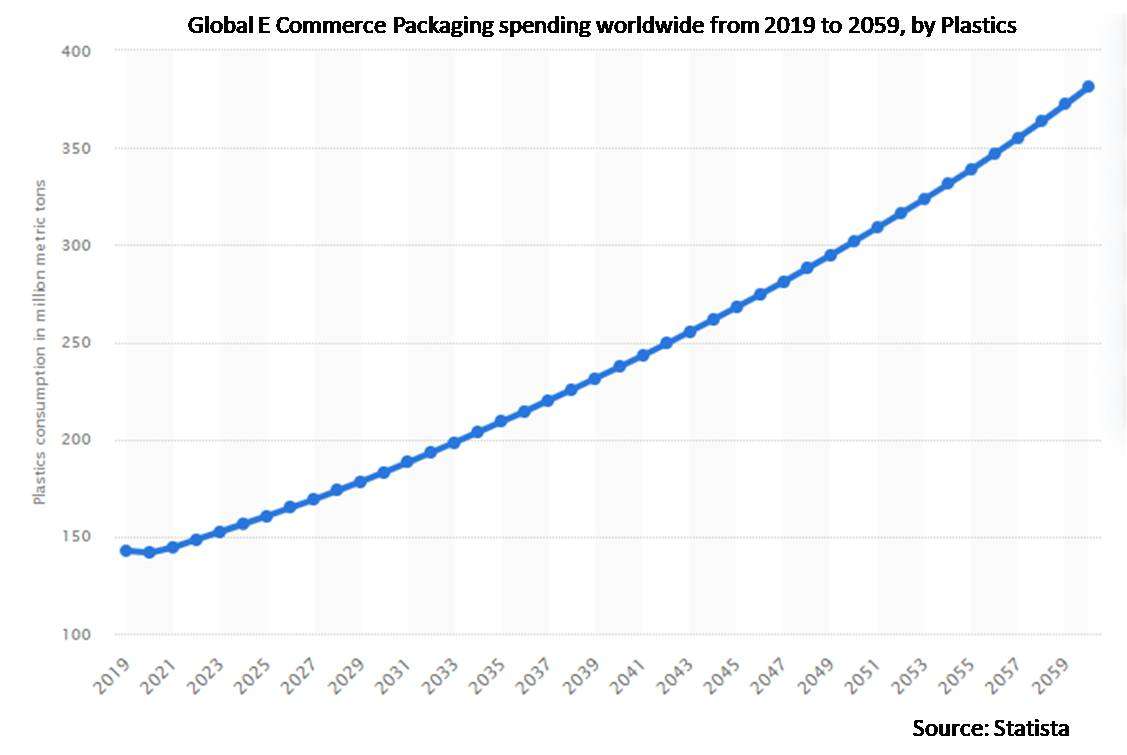
• Plastics
• Paper & Paperboard
• Corrugated Board
• Glass
• Corrugated Boxes
Forms Covered:
• Bags
• Tapes
• Labels
• Protective Packaging
• Mailers
• Boxes
End-Users Covered:
• Pharmaceuticals
• Automotive
• Retail
• Food and Beverages
• Household
• Personal Care
• Electronics and Electrical
• Apparels and Accessories
Regions Covered:
• North America
o US
o Canada
o Mexico
• Europe
o Germany
o UK
o Italy
o France
o Spain
o Rest of Europe
• Asia Pacific
o Japan
o China
o India
o Australia
o New Zealand
o South Korea
o Rest of Asia Pacific
• South America
o Argentina
o Brazil
o Chile
o Rest of South America
• Middle East & Africa
o Saudi Arabia
o UAE
o Qatar
o South Africa
o Rest of Middle East & Africa
What our report offers:
- Market share assessments for the regional and country-level segments
- Strategic recommendations for the new entrants
- Covers Market data for the years 2020, 2021, 2022, 2025, and 2028
- Market Trends (Drivers, Constraints, Opportunities, Threats, Challenges, Investment Opportunities, and recommendations)
- Strategic recommendations in key business segments based on the market estimations
- Competitive landscaping mapping the key common trends
- Company profiling with detailed strategies, financials, and recent developments
- Supply chain trends mapping the latest technological advancements
Free Customization Offerings:
All the customers of this report will be entitled to receive one of the following free customization options:
• Company Profiling
o Comprehensive profiling of additional market players (up to 3)
o SWOT Analysis of key players (up to 3)
• Regional Segmentation
o Market estimations, Forecasts and CAGR of any prominent country as per the client's interest (Note: Depends on feasibility check)
• Competitive Benchmarking
Benchmarking of key players based on product portfolio, geographical presence, and strategic alliances
Table of Contents
1 Executive Summary
2 Preface
2.1 Abstract
2.2 Stake Holders
2.3 Research Scope
2.4 Research Methodology
2.4.1 Data Mining
2.4.2 Data Analysis
2.4.3 Data Validation
2.4.4 Research Approach
2.5 Research Sources
2.5.1 Primary Research Sources
2.5.2 Secondary Research Sources
2.5.3 Assumptions
3 Market Trend Analysis
3.1 Introduction
3.2 Drivers
3.3 Restraints
3.4 Opportunities
3.5 Threats
3.6 End User Analysis
3.7 Emerging Markets
3.8 Impact of Covid-19
4 Porters Five Force Analysis
4.1 Bargaining power of suppliers
4.2 Bargaining power of buyers
4.3 Threat of substitutes
4.4 Threat of new entrants
4.5 Competitive rivalry
5 Global E Commerce Packaging Market, By Material
5.1 Introduction
5.2 Plastics
5.3 Paper & Paperboard
5.3.1 Folding Box Board
5.3.2 Clay Coated News Backboard
5.3.3 Solid Bleached Sulphate Board
5.3.4 Paper Bags
5.3.5 Coated Unbleached Kraft
5.4 Corrugated Board
5.4.1 Single Wall
5.4.2 Double Wall
5.4.3 Triple Wall
5.4.4 Single Face
5.5 Glass
5.6 Corrugated Boxes
6 Global E Commerce Packaging Market, By Form
6.1 Introduction
6.2 Bags
6.2.1 Courier Bags
6.2.2 Temper Proof Bags
6.2.3 Polythene Bags
6.2.4 Woven Sack Bags
6.2.5 Foam Bags
6.2.6 Lock Bags
6.3 Tapes
6.3.1 Resealable Bag Sealing Tapes
6.3.2 Self-Adhesive BOPP Tapes
6.3.3 Packaging Sealing Adhesive Tapes
6.3.4 PVC Packing Tapes
6.3.5 Printed Tapes
6.3.6 Reinforced Paper Tapes
6.4 Labels
6.4.1 Corrugated Rolls
6.4.2 Air Bubble Rolls
6.4.3 Stretch or Cling Film Wrap Rolls
6.5 Protective Packaging
6.6 Mailers
6.7 Boxes
7 Global E Commerce Packaging Market, By End-User
7.1 Introduction
7.2 Pharmaceuticals
7.3 Automotive
7.4 Retail
7.5 Food and Beverages
7.6 Household
7.7 Personal Care
7.8 Electronics and Electrical
7.9 Apparels and Accessories
8 Global E Commerce Packaging Market, By Geography
8.1 Introduction
8.2 North America
8.2.1 US
8.2.2 Canada
8.2.3 Mexico
8.3 Europe
8.3.1 Germany
8.3.2 UK
8.3.3 Italy
8.3.4 France
8.3.5 Spain
8.3.6 Rest of Europe
8.4 Asia Pacific
8.4.1 Japan
8.4.2 China
8.4.3 India
8.4.4 Australia
8.4.5 New Zealand
8.4.6 South Korea
8.4.7 Rest of Asia Pacific
8.5 South America
8.5.1 Argentina
8.5.2 Brazil
8.5.3 Chile
8.5.4 Rest of South America
8.6 Middle East & Africa
8.6.1 Saudi Arabia
8.6.2 UAE
8.6.3 Qatar
8.6.4 South Africa
8.6.5 Rest of Middle East & Africa
9 Key Developments
9.1 Agreements, Partnerships, Collaborations and Joint Ventures
9.2 Acquisitions & Mergers
9.3 New Product Launch
9.4 Expansions
9.5 Other Key Strategies
10 Company Profiling
10.1 Nippon paper industries co., ltd
10.2 International Paper
10.3 Ds Smith
10.4 Rajapack Ltd
10.5 Sealed Air
10.6 Packaging Corporation of America
10.7 Klabin SA
10.8 AMCOR PLC
10.9 Smurfit Kappa Group PLC
10.10 Georgia-Pacific LLC
10.11 Shorr Packaging Corporation
10.12 Mondi PLC
10.13 Pacman LLC
10.14 Rengo Co. Ltd.
10.15 Orora Packaging Australia Pty Ltd.
List of Tables
1 Global E Commerce Packaging Market Outlook, By Region (2020-2028) ($MN)
2 Global E Commerce Packaging Market Outlook, By Material (2020-2028) ($MN)
3 Global E Commerce Packaging Market Outlook, By Plastics (2020-2028) ($MN)
4 Global E Commerce Packaging Market Outlook, By Paper & Paperboard (2020-2028) ($MN)
5 Global E Commerce Packaging Market Outlook, By Folding Box Board (2020-2028) ($MN)
6 Global E Commerce Packaging Market Outlook, By Clay Coated News Backboard (2020-2028) ($MN)
7 Global E Commerce Packaging Market Outlook, By Solid Bleached Sulphate Board (2020-2028) ($MN)
8 Global E Commerce Packaging Market Outlook, By Paper Bags (2020-2028) ($MN)
9 Global E Commerce Packaging Market Outlook, By Coated Unbleached Kraft (2020-2028) ($MN)
10 Global E Commerce Packaging Market Outlook, By Corrugated Board (2020-2028) ($MN)
11 Global E Commerce Packaging Market Outlook, By Single Wall (2020-2028) ($MN)
12 Global E Commerce Packaging Market Outlook, By Double Wall (2020-2028) ($MN)
13 Global E Commerce Packaging Market Outlook, By Triple Wall (2020-2028) ($MN)
14 Global E Commerce Packaging Market Outlook, By Single Face (2020-2028) ($MN)
15 Global E Commerce Packaging Market Outlook, By Glass (2020-2028) ($MN)
16 Global E Commerce Packaging Market Outlook, By Corrugated Boxes (2020-2028) ($MN)
17 Global E Commerce Packaging Market Outlook, By Form (2020-2028) ($MN)
18 Global E Commerce Packaging Market Outlook, By Bags (2020-2028) ($MN)
19 Global E Commerce Packaging Market Outlook, By Courier Bags (2020-2028) ($MN)
20 Global E Commerce Packaging Market Outlook, By Temper Proof Bags (2020-2028) ($MN)
21 Global E Commerce Packaging Market Outlook, By Polythene Bags (2020-2028) ($MN)
22 Global E Commerce Packaging Market Outlook, By Woven Sack Bags (2020-2028) ($MN)
23 Global E Commerce Packaging Market Outlook, By Foam Bags (2020-2028) ($MN)
24 Global E Commerce Packaging Market Outlook, By Lock Bags (2020-2028) ($MN)
25 Global E Commerce Packaging Market Outlook, By Tapes (2020-2028) ($MN)
26 Global E Commerce Packaging Market Outlook, By Resealable Bag Sealing Tapes (2020-2028) ($MN)
27 Global E Commerce Packaging Market Outlook, By Self-Adhesive BOPP Tapes (2020-2028) ($MN)
28 Global E Commerce Packaging Market Outlook, By Packaging Sealing Adhesive Tapes (2020-2028) ($MN)
29 Global E Commerce Packaging Market Outlook, By PVC Packing Tapes (2020-2028) ($MN)
30 Global E Commerce Packaging Market Outlook, By Printed Tapes (2020-2028) ($MN)
31 Global E Commerce Packaging Market Outlook, By Reinforced Paper Tapes (2020-2028) ($MN)
32 Global E Commerce Packaging Market Outlook, By Labels (2020-2028) ($MN)
33 Global E Commerce Packaging Market Outlook, By Corrugated Rolls (2020-2028) ($MN)
34 Global E Commerce Packaging Market Outlook, By Air Bubble Rolls (2020-2028) ($MN)
35 Global E Commerce Packaging Market Outlook, By Stretch or Cling Film Wrap Rolls (2020-2028) ($MN)
36 Global E Commerce Packaging Market Outlook, By Protective Packaging (2020-2028) ($MN)
37 Global E Commerce Packaging Market Outlook, By Mailers (2020-2028) ($MN)
38 Global E Commerce Packaging Market Outlook, By Boxes (2020-2028) ($MN)
39 Global E Commerce Packaging Market Outlook, By End-User (2020-2028) ($MN)
40 Global E Commerce Packaging Market Outlook, By Pharmaceuticals (2020-2028) ($MN)
41 Global E Commerce Packaging Market Outlook, By Automotive (2020-2028) ($MN)
42 Global E Commerce Packaging Market Outlook, By Retail (2020-2028) ($MN)
43 Global E Commerce Packaging Market Outlook, By Food and Beverages (2020-2028) ($MN)
44 Global E Commerce Packaging Market Outlook, By Household (2020-2028) ($MN)
45 Global E Commerce Packaging Market Outlook, By Personal Care (2020-2028) ($MN)
46 Global E Commerce Packaging Market Outlook, By Electronics and Electrical (2020-2028) ($MN)
47 Global E Commerce Packaging Market Outlook, By Apparels and Accessories (2020-2028) ($MN)
Note: Tables for North America, Europe, Asia Pacific, South America and Middle East & Africa Regions are also represented in the same manner as above.
List of Figures
RESEARCH METHODOLOGY

We at ‘Stratistics’ opt for an extensive research approach which involves data mining, data validation, and data analysis. The various research sources include in-house repository, secondary research, competitor’s sources, social media research, client internal data, and primary research.
Our team of analysts prefers the most reliable and authenticated data sources in order to perform the comprehensive literature search. With access to most of the authenticated data bases our team highly considers the best mix of information through various sources to obtain extensive and accurate analysis.
Each report takes an average time of a month and a team of 4 industry analysts. The time may vary depending on the scope and data availability of the desired market report. The various parameters used in the market assessment are standardized in order to enhance the data accuracy.
Data Mining
The data is collected from several authenticated, reliable, paid and unpaid sources and is filtered depending on the scope & objective of the research. Our reports repository acts as an added advantage in this procedure. Data gathering from the raw material suppliers, distributors and the manufacturers is performed on a regular basis, this helps in the comprehensive understanding of the products value chain. Apart from the above mentioned sources the data is also collected from the industry consultants to ensure the objective of the study is in the right direction.
Market trends such as technological advancements, regulatory affairs, market dynamics (Drivers, Restraints, Opportunities and Challenges) are obtained from scientific journals, market related national & international associations and organizations.
Data Analysis
From the data that is collected depending on the scope & objective of the research the data is subjected for the analysis. The critical steps that we follow for the data analysis include:
- Product Lifecycle Analysis
- Competitor analysis
- Risk analysis
- Porters Analysis
- PESTEL Analysis
- SWOT Analysis
The data engineering is performed by the core industry experts considering both the Marketing Mix Modeling and the Demand Forecasting. The marketing mix modeling makes use of multiple-regression techniques to predict the optimal mix of marketing variables. Regression factor is based on a number of variables and how they relate to an outcome such as sales or profits.
Data Validation
The data validation is performed by the exhaustive primary research from the expert interviews. This includes telephonic interviews, focus groups, face to face interviews, and questionnaires to validate our research from all aspects. The industry experts we approach come from the leading firms, involved in the supply chain ranging from the suppliers, distributors to the manufacturers and consumers so as to ensure an unbiased analysis.
We are in touch with more than 15,000 industry experts with the right mix of consultants, CEO's, presidents, vice presidents, managers, experts from both supply side and demand side, executives and so on.
The data validation involves the primary research from the industry experts belonging to:
- Leading Companies
- Suppliers & Distributors
- Manufacturers
- Consumers
- Industry/Strategic Consultants
Apart from the data validation the primary research also helps in performing the fill gap research, i.e. providing solutions for the unmet needs of the research which helps in enhancing the reports quality.
For more details about research methodology, kindly write to us at info@strategymrc.com
Frequently Asked Questions
In case of any queries regarding this report, you can contact the customer service by filing the “Inquiry Before Buy” form available on the right hand side. You may also contact us through email: info@strategymrc.com or phone: +1-301-202-5929
Yes, the samples are available for all the published reports. You can request them by filling the “Request Sample” option available in this page.
Yes, you can request a sample with your specific requirements. All the customized samples will be provided as per the requirement with the real data masked.
All our reports are available in Digital PDF format. In case if you require them in any other formats, such as PPT, Excel etc you can submit a request through “Inquiry Before Buy” form available on the right hand side. You may also contact us through email: info@strategymrc.com or phone: +1-301-202-5929
We offer a free 15% customization with every purchase. This requirement can be fulfilled for both pre and post sale. You may send your customization requirements through email at info@strategymrc.com or call us on +1-301-202-5929.
We have 3 different licensing options available in electronic format.
- Single User Licence: Allows one person, typically the buyer, to have access to the ordered product. The ordered product cannot be distributed to anyone else.
- 2-5 User Licence: Allows the ordered product to be shared among a maximum of 5 people within your organisation.
- Corporate License: Allows the product to be shared among all employees of your organisation regardless of their geographical location.
All our reports are typically be emailed to you as an attachment.
To order any available report you need to register on our website. The payment can be made either through CCAvenue or PayPal payments gateways which accept all international cards.
We extend our support to 6 months post sale. A post sale customization is also provided to cover your unmet needs in the report.
Request Customization
We provide a free 15% customization on every purchase. This requirement can be fulfilled for both pre and post sale. You may send your customization requirements through email at info@strategymrc.com or call us on +1-301-202-5929.
Note: This customization is absolutely free until it falls under the 15% bracket. If your requirement exceeds this a feasibility check will be performed. Post that, a quote will be provided along with the timelines.
WHY CHOOSE US ?

Assured Quality
Best in class reports with high standard of research integrity

24X7 Research Support
Continuous support to ensure the best customer experience.

Free Customization
Adding more values to your product of interest.

Safe & Secure Access
Providing a secured environment for all online transactions.

Trusted by 600+ Brands
Serving the most reputed brands across the world.