
E Commerce Plastic Packaging Market
E-commerce Plastic Packaging - Global Market Outlook (2019 -2027)
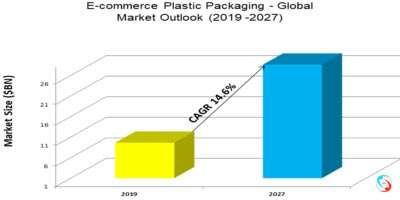
According to Stratistics MRC, the Global E-commerce Plastic Packaging Market is accounted for $9.62 billion in 2019 and is expected to reach $28.60 billion by 2027 growing at a CAGR of 14.6% during the forecast period. Growing internet penetration and Considerable investments in the consumer electronics are the major factors propelling the market growth. However, rising awareness about plastic waste and pressure from the government agencies are hampering the market growth.
When it comes to efficient packaging, plastics often enable manufacturers to ship more products with less packaging material. This process of light-weighting can play an essential role in boosting the environmental and economic efficiency of consumer product packaging. Also, blister packaging is ideal for small consumer electronic goods. This type of plastic packaging highlights electronic accessories and provides a degree of tamper resistance, while still being convenient and easy to open. These characteristics are helping drive the market growth.
Based on the end user, the consumer electronics and media segment is going to have a lucrative growth during the forecast period due to the increasing demand for consumer electronics worldwide, which in turn raising the demand for protective plastic packaging. Among the specialized plastic packaging systems for consumer electronics and media, shrink packaging, or commonly known as shrink wrapping, and stretch wrapping are very common and widely used.
By geography, Asia Pacific is going to have a lucrative growth during the forecast period due to the rising consumer preference for online shopping, the proliferation of alternative payment solutions, online shopping events, such as single day offering lucrative discounts, and improved logistics infrastructure. This rapid growth of the industry is primarily triggered by the increasing internet and smart phone penetration. The e-commerce market in Japan is also witnessing the significant usage of plastic packaging in the industry. According to the Ministry of Environment Japan, 745 kiloton of plastic packaging is used per year.
Some of the key players profiled in the E-commerce Plastic Packaging Market include Amcor PLC, Berry Global Inc, CCL Industries Inc, Clondalkin Flexible Packaging, Huhtamaki Oyj, Pregis LLC, Sealed Air Corporation, Sonoco Products Company, and Storopack Hans Reichenecker GmbH.
Products Covered:
• Pouches and Bags
• Protective Packaging
• Shrink Films
End Users Covered:
• Consumer Electronics and Media
• Fashion and Apparel
• Food and Beverage
• Home Care and Furnishing
• Personal Care Products
Regions Covered:
• North America
o US
o Canada
o Mexico
• Europe
o Germany
o UK
o Italy
o France
o Spain
o Rest of Europe
• Asia Pacific
o Japan
o China
o India
o Australia
o New Zealand
o South Korea
o Rest of Asia Pacific
• South America
o Argentina
o Brazil
o Chile
o Rest of South America
• Middle East & Africa
o Saudi Arabia
o UAE
o Qatar
o South Africa
o Rest of Middle East & Africa
What our report offers:
- Market share assessments for the regional and country-level segments
- Strategic recommendations for the new entrants
- Covers Market data for the years 2018, 2019 2020, 2024, and 2027
- Market Trends (Drivers, Constraints, Opportunities, Threats, Challenges, Investment Opportunities, and recommendations)
- Strategic recommendations in key business segments based on the market estimations
- Competitive landscaping mapping the key common trends
- Company profiling with detailed strategies, financials, and recent developments
- Supply chain trends mapping the latest technological advancements
Free Customization Offerings:
All the customers of this report will be entitled to receive one of the following free customization options:
• Company Profiling
o Comprehensive profiling of additional market players (up to 3)
o SWOT Analysis of key players (up to 3)
• Regional Segmentation
o Market estimations, Forecasts and CAGR of any prominent country as per the client's interest (Note: Depends on feasibility check)
• Competitive Benchmarking
o Benchmarking of key players based on product portfolio, geographical presence, and strategic alliances
Table of Contents
1 Executive Summary
2 Preface
2.1 Abstract
2.2 Stake Holders
2.3 Research Scope
2.4 Research Methodology
2.4.1 Data Mining
2.4.2 Data Analysis
2.4.3 Data Validation
2.4.4 Research Approach
2.5 Research Sources
2.5.1 Primary Research Sources
2.5.2 Secondary Research Sources
2.5.3 Assumptions
3 Market Trend Analysis
3.1 Introduction
3.2 Drivers
3.3 Restraints
3.4 Opportunities
3.5 Threats
3.6 Product Analysis
3.7 End User Analysis
3.8 Emerging Markets
3.9 Impact of Covid-19
4 Porters Five Force Analysis
4.1 Bargaining power of suppliers
4.2 Bargaining power of buyers
4.3 Threat of substitutes
4.4 Threat of new entrants
4.5 Competitive rivalry
5 Global E-commerce Plastic Packaging Market, By Product
5.1 Introduction
5.2 Pouches and Bags
5.3 Protective Packaging
5.3.1 Air Pillows
5.3.2 Bubble Packaging
5.4 Shrink Films
6 Global E-commerce Plastic Packaging Market, By End User
6.1 Introduction
6.2 Consumer Electronics and Media
6.3 Fashion and Apparel
6.4 Food and Beverage
6.5 Home Care and Furnishing
6.6 Personal Care Products
7 Global E-commerce Plastic Packaging Market, By Geography
7.1 Introduction
7.2 North America
7.2.1 US
7.2.2 Canada
7.2.3 Mexico
7.3 Europe
7.3.1 Germany
7.3.2 UK
7.3.3 Italy
7.3.4 France
7.3.5 Spain
7.3.6 Rest of Europe
7.4 Asia Pacific
7.4.1 Japan
7.4.2 China
7.4.3 India
7.4.4 Australia
7.4.5 New Zealand
7.4.6 South Korea
7.4.7 Rest of Asia Pacific
7.5 South America
7.5.1 Argentina
7.5.2 Brazil
7.5.3 Chile
7.5.4 Rest of South America
7.6 Middle East & Africa
7.6.1 Saudi Arabia
7.6.2 UAE
7.6.3 Qatar
7.6.4 South Africa
7.6.5 Rest of Middle East & Africa
8 Key Developments
8.1 Agreements, Partnerships, Collaborations and Joint Ventures
8.2 Acquisitions & Mergers
8.3 New Product Launch
8.4 Expansions
8.5 Other Key Strategies
9 Company Profiling
9.1 Amcor PLC
9.2 Berry Global Inc
9.3 CCL Industries Inc
9.4 Clondalkin Flexible Packaging
9.5 Huhtamaki Oyj
9.6 Pregis LLC
9.7 Sealed Air Corporation
9.8 Sonoco Products Company
9.9 Storopack Hans Reichenecker GmbH
List of Tables
Table 1 Global E-commerce Plastic Packaging Market Outlook, By Region (2018-2027) ($MN)
Table 2 Global E-commerce Plastic Packaging Market Outlook, By Product (2018-2027) ($MN)
Table 3 Global E-commerce Plastic Packaging Market Outlook, By Pouches and Bags (2018-2027) ($MN)
Table 4 Global E-commerce Plastic Packaging Market Outlook, By Protective Packaging (2018-2027) ($MN)
Table 5 Global E-commerce Plastic Packaging Market Outlook, By Air Pillows (2018-2027) ($MN)
Table 6 Global E-commerce Plastic Packaging Market Outlook, By Bubble Packaging (2018-2027) ($MN)
Table 7 Global E-commerce Plastic Packaging Market Outlook, By Shrink Films (2018-2027) ($MN)
Table 8 Global E-commerce Plastic Packaging Market Outlook, By End User (2018-2027) ($MN)
Table 9 Global E-commerce Plastic Packaging Market Outlook, By Consumer Electronics and Media (2018-2027) ($MN)
Table 10 Global E-commerce Plastic Packaging Market Outlook, By Fashion and Apparel (2018-2027) ($MN)
Table 11 Global E-commerce Plastic Packaging Market Outlook, By Food and Beverage (2018-2027) ($MN)
Table 12 Global E-commerce Plastic Packaging Market Outlook, By Home Care and Furnishing (2018-2027) ($MN)
Table 13 Global E-commerce Plastic Packaging Market Outlook, By Personal Care Products (2018-2027) ($MN)
Table 14 North America E-commerce Plastic Packaging Market Outlook, By Country (2018-2027) ($MN)
Table 15 North America E-commerce Plastic Packaging Market Outlook, By Product (2018-2027) ($MN)
Table 16 North America E-commerce Plastic Packaging Market Outlook, By Pouches and Bags (2018-2027) ($MN)
Table 17 North America E-commerce Plastic Packaging Market Outlook, By Protective Packaging (2018-2027) ($MN)
Table 18 North America E-commerce Plastic Packaging Market Outlook, By Air Pillows (2018-2027) ($MN)
Table 19 North America E-commerce Plastic Packaging Market Outlook, By Bubble Packaging (2018-2027) ($MN)
Table 20 North America E-commerce Plastic Packaging Market Outlook, By Shrink Films (2018-2027) ($MN)
Table 21 North America E-commerce Plastic Packaging Market Outlook, By End User (2018-2027) ($MN)
Table 22 North America E-commerce Plastic Packaging Market Outlook, By Consumer Electronics and Media (2018-2027) ($MN)
Table 23 North America E-commerce Plastic Packaging Market Outlook, By Fashion and Apparel (2018-2027) ($MN)
Table 24 North America E-commerce Plastic Packaging Market Outlook, By Food and Beverage (2018-2027) ($MN)
Table 25 North America E-commerce Plastic Packaging Market Outlook, By Home Care and Furnishing (2018-2027) ($MN)
Table 26 North America E-commerce Plastic Packaging Market Outlook, By Personal Care Products (2018-2027) ($MN)
Table 27 Europe E-commerce Plastic Packaging Market Outlook, By Country (2018-2027) ($MN)
Table 28 Europe E-commerce Plastic Packaging Market Outlook, By Product (2018-2027) ($MN)
Table 29 Europe E-commerce Plastic Packaging Market Outlook, By Pouches and Bags (2018-2027) ($MN)
Table 30 Europe E-commerce Plastic Packaging Market Outlook, By Protective Packaging (2018-2027) ($MN)
Table 31 Europe E-commerce Plastic Packaging Market Outlook, By Air Pillows (2018-2027) ($MN)
Table 32 Europe E-commerce Plastic Packaging Market Outlook, By Bubble Packaging (2018-2027) ($MN)
Table 33 Europe E-commerce Plastic Packaging Market Outlook, By Shrink Films (2018-2027) ($MN)
Table 34 Europe E-commerce Plastic Packaging Market Outlook, By End User (2018-2027) ($MN)
Table 35 Europe E-commerce Plastic Packaging Market Outlook, By Consumer Electronics and Media (2018-2027) ($MN)
Table 36 Europe E-commerce Plastic Packaging Market Outlook, By Fashion and Apparel (2018-2027) ($MN)
Table 37 Europe E-commerce Plastic Packaging Market Outlook, By Food and Beverage (2018-2027) ($MN)
Table 38 Europe E-commerce Plastic Packaging Market Outlook, By Home Care and Furnishing (2018-2027) ($MN)
Table 39 Europe E-commerce Plastic Packaging Market Outlook, By Personal Care Products (2018-2027) ($MN)
Table 40 Asia Pacific E-commerce Plastic Packaging Market Outlook, By Country (2018-2027) ($MN)
Table 41 Asia Pacific E-commerce Plastic Packaging Market Outlook, By Product (2018-2027) ($MN)
Table 42 Asia Pacific E-commerce Plastic Packaging Market Outlook, By Pouches and Bags (2018-2027) ($MN)
Table 43 Asia Pacific E-commerce Plastic Packaging Market Outlook, By Protective Packaging (2018-2027) ($MN)
Table 44 Asia Pacific E-commerce Plastic Packaging Market Outlook, By Air Pillows (2018-2027) ($MN)
Table 45 Asia Pacific E-commerce Plastic Packaging Market Outlook, By Bubble Packaging (2018-2027) ($MN)
Table 46 Asia Pacific E-commerce Plastic Packaging Market Outlook, By Shrink Films (2018-2027) ($MN)
Table 47 Asia Pacific E-commerce Plastic Packaging Market Outlook, By End User (2018-2027) ($MN)
Table 48 Asia Pacific E-commerce Plastic Packaging Market Outlook, By Consumer Electronics and Media (2018-2027) ($MN)
Table 49 Asia Pacific E-commerce Plastic Packaging Market Outlook, By Fashion and Apparel (2018-2027) ($MN)
Table 50 Asia Pacific E-commerce Plastic Packaging Market Outlook, By Food and Beverage (2018-2027) ($MN)
Table 51 Asia Pacific E-commerce Plastic Packaging Market Outlook, By Home Care and Furnishing (2018-2027) ($MN)
Table 52 Asia Pacific E-commerce Plastic Packaging Market Outlook, By Personal Care Products (2018-2027) ($MN)
Table 53 South America E-commerce Plastic Packaging Market Outlook, By Country (2018-2027) ($MN)
Table 54 South America E-commerce Plastic Packaging Market Outlook, By Product (2018-2027) ($MN)
Table 55 South America E-commerce Plastic Packaging Market Outlook, By Pouches and Bags (2018-2027) ($MN)
Table 56 South America E-commerce Plastic Packaging Market Outlook, By Protective Packaging (2018-2027) ($MN)
Table 57 South America E-commerce Plastic Packaging Market Outlook, By Air Pillows (2018-2027) ($MN)
Table 58 South America E-commerce Plastic Packaging Market Outlook, By Bubble Packaging (2018-2027) ($MN)
Table 59 South America E-commerce Plastic Packaging Market Outlook, By Shrink Films (2018-2027) ($MN)
Table 60 South America E-commerce Plastic Packaging Market Outlook, By End User (2018-2027) ($MN)
Table 61 South America E-commerce Plastic Packaging Market Outlook, By Consumer Electronics and Media (2018-2027) ($MN)
Table 62 South America E-commerce Plastic Packaging Market Outlook, By Fashion and Apparel (2018-2027) ($MN)
Table 63 South America E-commerce Plastic Packaging Market Outlook, By Food and Beverage (2018-2027) ($MN)
Table 64 South America E-commerce Plastic Packaging Market Outlook, By Home Care and Furnishing (2018-2027) ($MN)
Table 65 South America E-commerce Plastic Packaging Market Outlook, By Personal Care Products (2018-2027) ($MN)
Table 66 Middle East & Africa E-commerce Plastic Packaging Market Outlook, By Country (2018-2027) ($MN)
Table 67 Middle East & Africa E-commerce Plastic Packaging Market Outlook, By Product (2018-2027) ($MN)
Table 68 Middle East & Africa E-commerce Plastic Packaging Market Outlook, By Pouches and Bags (2018-2027) ($MN)
Table 69 Middle East & Africa E-commerce Plastic Packaging Market Outlook, By Protective Packaging (2018-2027) ($MN)
Table 70 Middle East & Africa E-commerce Plastic Packaging Market Outlook, By Air Pillows (2018-2027) ($MN)
Table 71 Middle East & Africa E-commerce Plastic Packaging Market Outlook, By Bubble Packaging (2018-2027) ($MN)
Table 72 Middle East & Africa E-commerce Plastic Packaging Market Outlook, By Shrink Films (2018-2027) ($MN)
Table 73 Middle East & Africa E-commerce Plastic Packaging Market Outlook, By End User (2018-2027) ($MN)
Table 74 Middle East & Africa E-commerce Plastic Packaging Market Outlook, By Consumer Electronics and Media (2018-2027) ($MN)
Table 75 Middle East & Africa E-commerce Plastic Packaging Market Outlook, By Fashion and Apparel (2018-2027) ($MN)
Table 76 Middle East & Africa E-commerce Plastic Packaging Market Outlook, By Food and Beverage (2018-2027) ($MN)
Table 77 Middle East & Africa E-commerce Plastic Packaging Market Outlook, By Home Care and Furnishing (2018-2027) ($MN)
Table 78 Middle East & Africa E-commerce Plastic Packaging Market Outlook, By Personal Care Products (2018-2027) ($MN)
List of Figures
RESEARCH METHODOLOGY

We at ‘Stratistics’ opt for an extensive research approach which involves data mining, data validation, and data analysis. The various research sources include in-house repository, secondary research, competitor’s sources, social media research, client internal data, and primary research.
Our team of analysts prefers the most reliable and authenticated data sources in order to perform the comprehensive literature search. With access to most of the authenticated data bases our team highly considers the best mix of information through various sources to obtain extensive and accurate analysis.
Each report takes an average time of a month and a team of 4 industry analysts. The time may vary depending on the scope and data availability of the desired market report. The various parameters used in the market assessment are standardized in order to enhance the data accuracy.
Data Mining
The data is collected from several authenticated, reliable, paid and unpaid sources and is filtered depending on the scope & objective of the research. Our reports repository acts as an added advantage in this procedure. Data gathering from the raw material suppliers, distributors and the manufacturers is performed on a regular basis, this helps in the comprehensive understanding of the products value chain. Apart from the above mentioned sources the data is also collected from the industry consultants to ensure the objective of the study is in the right direction.
Market trends such as technological advancements, regulatory affairs, market dynamics (Drivers, Restraints, Opportunities and Challenges) are obtained from scientific journals, market related national & international associations and organizations.
Data Analysis
From the data that is collected depending on the scope & objective of the research the data is subjected for the analysis. The critical steps that we follow for the data analysis include:
- Product Lifecycle Analysis
- Competitor analysis
- Risk analysis
- Porters Analysis
- PESTEL Analysis
- SWOT Analysis
The data engineering is performed by the core industry experts considering both the Marketing Mix Modeling and the Demand Forecasting. The marketing mix modeling makes use of multiple-regression techniques to predict the optimal mix of marketing variables. Regression factor is based on a number of variables and how they relate to an outcome such as sales or profits.
Data Validation
The data validation is performed by the exhaustive primary research from the expert interviews. This includes telephonic interviews, focus groups, face to face interviews, and questionnaires to validate our research from all aspects. The industry experts we approach come from the leading firms, involved in the supply chain ranging from the suppliers, distributors to the manufacturers and consumers so as to ensure an unbiased analysis.
We are in touch with more than 15,000 industry experts with the right mix of consultants, CEO's, presidents, vice presidents, managers, experts from both supply side and demand side, executives and so on.
The data validation involves the primary research from the industry experts belonging to:
- Leading Companies
- Suppliers & Distributors
- Manufacturers
- Consumers
- Industry/Strategic Consultants
Apart from the data validation the primary research also helps in performing the fill gap research, i.e. providing solutions for the unmet needs of the research which helps in enhancing the reports quality.
For more details about research methodology, kindly write to us at info@strategymrc.com
Frequently Asked Questions
In case of any queries regarding this report, you can contact the customer service by filing the “Inquiry Before Buy” form available on the right hand side. You may also contact us through email: info@strategymrc.com or phone: +1-301-202-5929
Yes, the samples are available for all the published reports. You can request them by filling the “Request Sample” option available in this page.
Yes, you can request a sample with your specific requirements. All the customized samples will be provided as per the requirement with the real data masked.
All our reports are available in Digital PDF format. In case if you require them in any other formats, such as PPT, Excel etc you can submit a request through “Inquiry Before Buy” form available on the right hand side. You may also contact us through email: info@strategymrc.com or phone: +1-301-202-5929
We offer a free 15% customization with every purchase. This requirement can be fulfilled for both pre and post sale. You may send your customization requirements through email at info@strategymrc.com or call us on +1-301-202-5929.
We have 3 different licensing options available in electronic format.
- Single User Licence: Allows one person, typically the buyer, to have access to the ordered product. The ordered product cannot be distributed to anyone else.
- 2-5 User Licence: Allows the ordered product to be shared among a maximum of 5 people within your organisation.
- Corporate License: Allows the product to be shared among all employees of your organisation regardless of their geographical location.
All our reports are typically be emailed to you as an attachment.
To order any available report you need to register on our website. The payment can be made either through CCAvenue or PayPal payments gateways which accept all international cards.
We extend our support to 6 months post sale. A post sale customization is also provided to cover your unmet needs in the report.
Request Customization
We provide a free 15% customization on every purchase. This requirement can be fulfilled for both pre and post sale. You may send your customization requirements through email at info@strategymrc.com or call us on +1-301-202-5929.
Note: This customization is absolutely free until it falls under the 15% bracket. If your requirement exceeds this a feasibility check will be performed. Post that, a quote will be provided along with the timelines.
WHY CHOOSE US ?

Assured Quality
Best in class reports with high standard of research integrity

24X7 Research Support
Continuous support to ensure the best customer experience.

Free Customization
Adding more values to your product of interest.

Safe & Secure Access
Providing a secured environment for all online transactions.

Trusted by 600+ Brands
Serving the most reputed brands across the world.