
Hydrogen Energy Storage Market
Hydrogen Energy Storage Market Forecasts to 2030 - Global Analysis By Storage Type (Stationary Storage, Chemical Storage and Physical Storage), State (Gas, Liquid and Solid), Technology, End User and By Geography

|
Years Covered |
2021-2030 |
|
Estimated Year Value (2023) |
US $35.7 BN |
|
Projected Year Value (2030) |
US $669.1 BN |
|
CAGR (2023 - 2030) |
52% |
|
Regions Covered |
North America, Europe, Asia Pacific, South America, and Middle East & Africa |
|
Countries Covered |
US, Canada, Mexico, Germany, UK, Italy, France, Spain, Japan, China, India, Australia, New Zealand, South Korea, Rest of Asia Pacific, South America, Argentina, Brazil, Chile, Middle East & Africa, Saudi Arabia, UAE, Qatar, and South Africa |
|
Largest Market |
Asia Pacific |
|
Highest Growing Market |
North America |
According to Stratistics MRC, the Global Hydrogen Energy Storage Market is accounted for $35.7 billion in 2023 and is expected to reach $669.1 billion by 2030 growing at a CAGR of 52.0% during the forecast period. Hydrogen energy storage is a type of chemical energy storage that uses hydrogen to store electric power. Hydrogen is produced by the electrolysis of water, and the gas is stored in medium or large containers depending on its requirements. The gas can be used to generate energy in a combustion engine or a fuel cell. Hydrogen energy is often held in three forms: liquid, solid, and gaseous. To store hydrogen in gas form, high-pressure tanks are required, whereas it can only be held in liquid form at cryogenic temperatures. Fuel cell solutions for stationary power and transportation utilize hydrogen storage extensively.
According to the International Renewable Energy Agency (IRENA), for renewable hydrogen to be competitive with fossil fuel-produced hydrogen, it should be generated at less than USD 2.5 per kg.
Market Dynamics:
Driver:
Increasing government initiatives for promoting usage of hydrogen storage technologies
Many energy sector professionals consider hydrogen as a way to store excess renewable energy from sources such as wind, solar, and waves for later use. It is also thought to have market potential for vehicle fueling in both urban and rural locations. Furthermore, severe emission laws in China, South Korea, Japan, and India, as well as rising demand for ammonia and methanol, are likely to drive market expansion. As a result of the increasing government measures to promote the use of hydrogen storage technologies, the hydrogen storage market has high development potential throughout the forecast period.
Restraint:
Low efficiency of turnaround
Despite the benefits and possibilities of hydrogen energy storage, the market is threatened by the low turn-around efficiency (i.e., electricity to hydrogen stored, then back to electricity). The industry is making significant efforts to address both efficiency and cost challenges. Furthermore, many governments are starting to publish draft guidelines for the use of hydrogen energy storage technology. Appropriate finance structures and adequate modeling tools are being created to aid in the effective and widespread application of hydrogen technology.
Opportunity:
Environment friendly technique
Hydrogen is a kind of energy storage. Energy stored as hydrogen in the form of a gas or a liquid would never dissipate until it was required, making it a perfect option for emergency generators and other mission-critical energy applications. In comparison to other methods of energy storage, such as batteries and capacitors, which lose the energy stored in them over time and must be recharged on a regular basis even while not in use, hydrogen energy storage is more desirable. These are cleaner and more efficient, and they can also be used to power automobiles and mobile power packs in mobile applications.
Threat:
Large investment
Most hybrid vehicles are powered mostly by hydrogen energy. It requires a lot of study and ingenuity to find cheap and sustainable ways to harness this type of energy. Until then, hydrogen energy would be reserved for the wealthy. One of the characteristics of hydrogen is its low density. To ensure its usefulness and efficiency as an energy source, it must be compressed to a liquid state and stored in the same manner at lower temperatures. This explains why hydrogen must always be stored and carried under high pressure, making transit and frequent usage impractical.
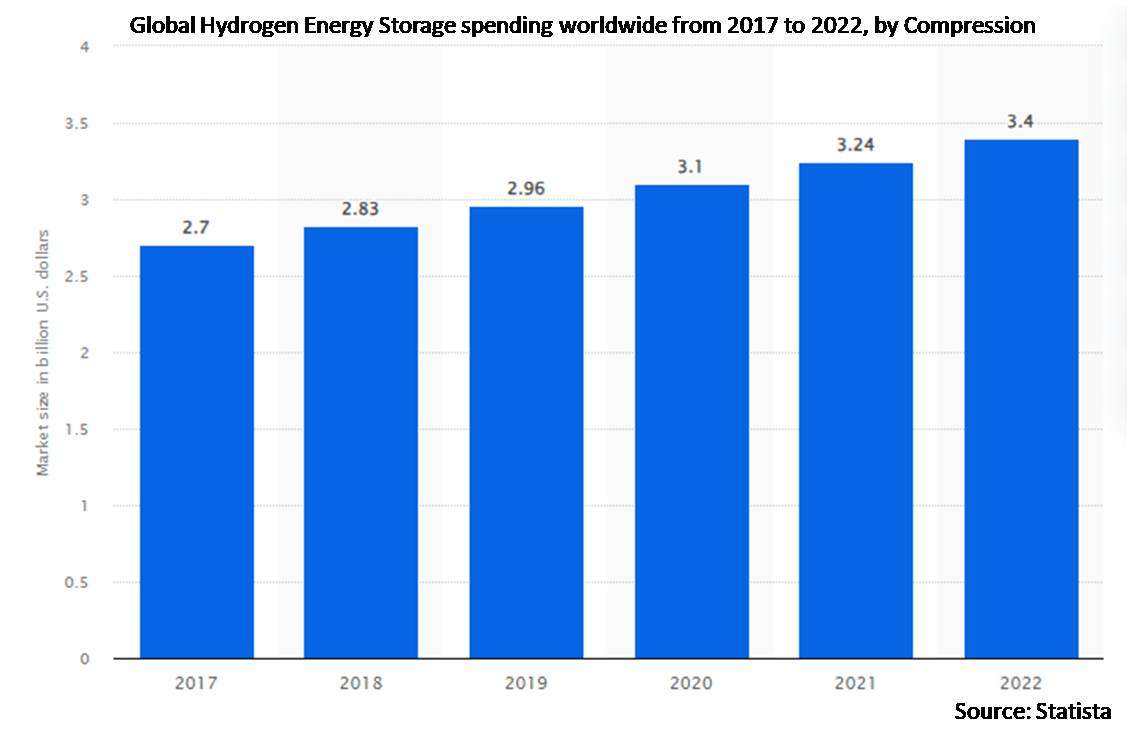
The compression segment is expected to be the largest during the forecast period
Due to the widespread use of compressed hydrogen in a variety of industries, the compression segment is estimated to hold the largest share throughout the forecast period. Compressed hydrogen is used in on-site stationary power generation, hydrogen filling stations, and fuel cell vehicles for road mobility. Furthermore, the compression process is used in the manufacturing and chemical industries to store hydrogen in cylinders for industrial uses.
The industrial segment is expected to have the highest CAGR during the forecast period
Owing to the limited usage of hydrogen energy storage for residential applications globally, the industrial segment is predicted to increase rapidly throughout the forecast period. Japan, Germany, France, and Belgium are tightening their regulatory frameworks, which is anticipated to accelerate the use of fuel cells in residential applications for micro-combined heat and power. Japan's ENE-FARM program, for instance, has accelerated the adoption of fuel cell-based systems for use as fuel cell micro-cogeneration in the residential sector.
Region with largest share:
Because of the impact of productivity increases, Asia-Pacific held the largest share throughout the projection period. The Asia-Pacific's growing economies are adopting varied foreign equipment, increasing manufacturing efficiency. However, the Asia-Pacific region's growing economies are increasingly reliant on a wide range of foreign machinery, resulting in a rise in the quantity of commodities produced per unit of labor.
Region with highest CAGR:
The market in North America is expected to grow rapidly as a result of strict pollution control regulations, the use of cleaner fuels, and a surge in fuel cell applications. The United States is experiencing rapid expansion in this area as a result of increased hydrogen demand in chemical businesses and oil refineries across the country. However, the development of large-scale hydrogen energy storage installations across North America is growing market demand.

Key players in the market
Some of the key players in Hydrogen Energy Storage market include Inoxcva, Grz Technologies, ITN Power, Hydrogenics, Chart Industries, Plug Power, Hydrogenious Lohc Technologies, Fuelcell Energy, Mcphy Energy, Air Products and Chemicals, Pragma Industries, Nel Hydrogen, Worthington Industries, Hexagon Composites, Linde and Air Liquide.
Key Developments:
In May 2022, Air Liquide and Lotte Chemical form a strategic partnership to deploy the hydrogen supply chain in South Korea.
In May 2022, Air Products, OQ, and ACWA Power Sign Joint Development Agreement for Hydrogen-Based Ammonia Production Facility on a Global Scale in Oman.
In March 2020, Nel Hydrogen partnered with the global EPC company Kværner AS. The companies will collaborate on specific green hydrogen projects and standardisation of solutions for large scale hydrogen production plants. This is a long-term commitment, and Kvaerner is excited to enter into collaboration with a partner like Nel.
In March 2020, Inoxcva partnered with Memorandum of Understanding (MoU) with Shell Energy India Pvt Ltd for developing the market for LNG supply by Road from Shell's LNG Terminal. This will help in increasing the penetration and consumption of clean, reliable and cost-efficient LNG to commercial and industrial (C&I) users all over the country.
Storage Types Covered:
• Stationary Storage
• Chemical Storage
• Physical Storage
States Covered:
• Gas
• Liquid
• Solid
Technologies Covered:
• Liquid Hydrogen
• Underground Salt Caverns
• Carbon Absorption
• Material Based
• Liquefaction
• Compression
End Users Covered:
• Utilities/Power Generation
• Industrial
• Commercial
• Residential
• Other End Users
Regions Covered:
• North America
o US
o Canada
o Mexico
• Europe
o Germany
o UK
o Italy
o France
o Spain
o Rest of Europe
• Asia Pacific
o Japan
o China
o India
o Australia
o New Zealand
o South Korea
o Rest of Asia Pacific
• South America
o Argentina
o Brazil
o Chile
o Rest of South America
• Middle East & Africa
o Saudi Arabia
o UAE
o Qatar
o South Africa
o Rest of Middle East & Africa
What our report offers:
- Market share assessments for the regional and country-level segments
- Strategic recommendations for the new entrants
- Covers Market data for the years 2021, 2022, 2023, 2026, and 2030
- Market Trends (Drivers, Constraints, Opportunities, Threats, Challenges, Investment Opportunities, and recommendations)
- Strategic recommendations in key business segments based on the market estimations
- Competitive landscaping mapping the key common trends
- Company profiling with detailed strategies, financials, and recent developments
- Supply chain trends mapping the latest technological advancements
Free Customization Offerings:
All the customers of this report will be entitled to receive one of the following free customization options:
• Company Profiling
o Comprehensive profiling of additional market players (up to 3)
o SWOT Analysis of key players (up to 3)
• Regional Segmentation
o Market estimations, Forecasts and CAGR of any prominent country as per the client's interest (Note: Depends on feasibility check)
• Competitive Benchmarking
Benchmarking of key players based on product portfolio, geographical presence, and strategic alliances
Table of Contents
1 Executive Summary
2 Preface
2.1 Abstract
2.2 Stake Holders
2.3 Research Scope
2.4 Research Methodology
2.4.1 Data Mining
2.4.2 Data Analysis
2.4.3 Data Validation
2.4.4 Research Approach
2.5 Research Sources
2.5.1 Primary Research Sources
2.5.2 Secondary Research Sources
2.5.3 Assumptions
3 Market Trend Analysis
3.1 Introduction
3.2 Drivers
3.3 Restraints
3.4 Opportunities
3.5 Threats
3.6 Technology Analysis
3.7 End User Analysis
3.8 Emerging Markets
3.9 Impact of Covid-19
4 Porters Five Force Analysis
4.1 Bargaining power of suppliers
4.2 Bargaining power of buyers
4.3 Threat of substitutes
4.4 Threat of new entrants
4.5 Competitive rivalry
5 Global Hydrogen Energy Storage Market, By Storage Type
5.1 Introduction
5.2 Stationary Storage
5.3 Chemical Storage
5.4 Physical Storage
6 Global Hydrogen Energy Storage Market, By State
6.1 Introduction
6.2 Gas
6.3 Liquid
6.4 Solid
7 Global Hydrogen Energy Storage Market, By Technology
7.1 Introduction
7.2 Liquid Hydrogen
7.3 Underground Salt Caverns
7.4 Carbon Absorption
7.5 Material Based
7.5.1 Chemical Hydrides
7.5.2 Metal Hydrides
7.6 Liquefaction
7.7 Compression
8 Global Hydrogen Energy Storage Market, By End User
8.1 Introduction
8.2 Utilities/Power Generation
8.3 Industrial
8.3.1 Chemical Industry
8.3.2 Steel & Metal Works
8.3.3 Oil Refineries
8.4 Commercial
8.4.1 Space Heating
8.4.2 Transportation
8.5 Residential
8.6 Other End Users
8.6.1 Transportation
8.6.2 Stationary Power
9 Global Hydrogen Energy Storage Market, By Geography
9.1 Introduction
9.2 North America
9.2.1 US
9.2.2 Canada
9.2.3 Mexico
9.3 Europe
9.3.1 Germany
9.3.2 UK
9.3.3 Italy
9.3.4 France
9.3.5 Spain
9.3.6 Rest of Europe
9.4 Asia Pacific
9.4.1 Japan
9.4.2 China
9.4.3 India
9.4.4 Australia
9.4.5 New Zealand
9.4.6 South Korea
9.4.7 Rest of Asia Pacific
9.5 South America
9.5.1 Argentina
9.5.2 Brazil
9.5.3 Chile
9.5.4 Rest of South America
9.6 Middle East & Africa
9.6.1 Saudi Arabia
9.6.2 UAE
9.6.3 Qatar
9.6.4 South Africa
9.6.5 Rest of Middle East & Africa
10 Key Developments
10.1 Agreements, Partnerships, Collaborations and Joint Ventures
10.2 Acquisitions & Mergers
10.3 New Product Launch
10.4 Expansions
10.5 Other Key Strategies
11 Company Profiling
11.1 Inoxcva
11.2 Grz Technologies
11.3 ITN Power
11.4 Hydrogenics
11.5 Chart Industries
11.6 Plug Power
11.7 Hydrogenious Lohc Technologies
11.8 Fuelcell Energy
11.9 Mcphy Energy
11.10 Air Products and Chemicals
11.11 Pragma Industries
11.12 Nel Hydrogen
11.13 Worthington Industries
11.14 Hexagon Composites
11.15 Linde
11.16 Air Liquide
List of Tables
1 Global Hydrogen Energy Storage Market Outlook, By Region (2021-2030) ($MN)
2 Global Hydrogen Energy Storage Market Outlook, By Storage Type (2021-2030) ($MN)
3 Global Hydrogen Energy Storage Market Outlook, By Stationary Storage (2021-2030) ($MN)
4 Global Hydrogen Energy Storage Market Outlook, By Chemical Storage (2021-2030) ($MN)
5 Global Hydrogen Energy Storage Market Outlook, By Physical Storage (2021-2030) ($MN)
6 Global Hydrogen Energy Storage Market Outlook, By State (2021-2030) ($MN)
7 Global Hydrogen Energy Storage Market Outlook, By Gas (2021-2030) ($MN)
8 Global Hydrogen Energy Storage Market Outlook, By Liquid (2021-2030) ($MN)
9 Global Hydrogen Energy Storage Market Outlook, By Solid (2021-2030) ($MN)
10 Global Hydrogen Energy Storage Market Outlook, By Technology (2021-2030) ($MN)
11 Global Hydrogen Energy Storage Market Outlook, By Liquid Hydrogen (2021-2030) ($MN)
12 Global Hydrogen Energy Storage Market Outlook, By Underground Salt Caverns (2021-2030) ($MN)
13 Global Hydrogen Energy Storage Market Outlook, By Carbon Absorption (2021-2030) ($MN)
14 Global Hydrogen Energy Storage Market Outlook, By Material Based (2021-2030) ($MN)
15 Global Hydrogen Energy Storage Market Outlook, By Chemical Hydrides (2021-2030) ($MN)
16 Global Hydrogen Energy Storage Market Outlook, By Metal Hydrides (2021-2030) ($MN)
17 Global Hydrogen Energy Storage Market Outlook, By Liquefaction (2021-2030) ($MN)
18 Global Hydrogen Energy Storage Market Outlook, By Compression (2021-2030) ($MN)
19 Global Hydrogen Energy Storage Market Outlook, By End User (2021-2030) ($MN)
20 Global Hydrogen Energy Storage Market Outlook, By Utilities/Power Generation (2021-2030) ($MN)
21 Global Hydrogen Energy Storage Market Outlook, By Industrial (2021-2030) ($MN)
22 Global Hydrogen Energy Storage Market Outlook, By Chemical Industry (2021-2030) ($MN)
23 Global Hydrogen Energy Storage Market Outlook, By Steel & Metal Works (2021-2030) ($MN)
24 Global Hydrogen Energy Storage Market Outlook, By Oil Refineries (2021-2030) ($MN)
25 Global Hydrogen Energy Storage Market Outlook, By Commercial (2021-2030) ($MN)
26 Global Hydrogen Energy Storage Market Outlook, By Space Heating (2021-2030) ($MN)
27 Global Hydrogen Energy Storage Market Outlook, By Transportation (2021-2030) ($MN)
28 Global Hydrogen Energy Storage Market Outlook, By Residential (2021-2030) ($MN)
29 Global Hydrogen Energy Storage Market Outlook, By Other End Users (2021-2030) ($MN)
30 Global Hydrogen Energy Storage Market Outlook, By Transportation (2021-2030) ($MN)
31 Global Hydrogen Energy Storage Market Outlook, By Stationary Power (2021-2030) ($MN)
Note: Tables for North America, Europe, APAC, South America, and Middle East & Africa Regions are also represented in the same manner as above.
List of Figures
RESEARCH METHODOLOGY

We at ‘Stratistics’ opt for an extensive research approach which involves data mining, data validation, and data analysis. The various research sources include in-house repository, secondary research, competitor’s sources, social media research, client internal data, and primary research.
Our team of analysts prefers the most reliable and authenticated data sources in order to perform the comprehensive literature search. With access to most of the authenticated data bases our team highly considers the best mix of information through various sources to obtain extensive and accurate analysis.
Each report takes an average time of a month and a team of 4 industry analysts. The time may vary depending on the scope and data availability of the desired market report. The various parameters used in the market assessment are standardized in order to enhance the data accuracy.
Data Mining
The data is collected from several authenticated, reliable, paid and unpaid sources and is filtered depending on the scope & objective of the research. Our reports repository acts as an added advantage in this procedure. Data gathering from the raw material suppliers, distributors and the manufacturers is performed on a regular basis, this helps in the comprehensive understanding of the products value chain. Apart from the above mentioned sources the data is also collected from the industry consultants to ensure the objective of the study is in the right direction.
Market trends such as technological advancements, regulatory affairs, market dynamics (Drivers, Restraints, Opportunities and Challenges) are obtained from scientific journals, market related national & international associations and organizations.
Data Analysis
From the data that is collected depending on the scope & objective of the research the data is subjected for the analysis. The critical steps that we follow for the data analysis include:
- Product Lifecycle Analysis
- Competitor analysis
- Risk analysis
- Porters Analysis
- PESTEL Analysis
- SWOT Analysis
The data engineering is performed by the core industry experts considering both the Marketing Mix Modeling and the Demand Forecasting. The marketing mix modeling makes use of multiple-regression techniques to predict the optimal mix of marketing variables. Regression factor is based on a number of variables and how they relate to an outcome such as sales or profits.
Data Validation
The data validation is performed by the exhaustive primary research from the expert interviews. This includes telephonic interviews, focus groups, face to face interviews, and questionnaires to validate our research from all aspects. The industry experts we approach come from the leading firms, involved in the supply chain ranging from the suppliers, distributors to the manufacturers and consumers so as to ensure an unbiased analysis.
We are in touch with more than 15,000 industry experts with the right mix of consultants, CEO's, presidents, vice presidents, managers, experts from both supply side and demand side, executives and so on.
The data validation involves the primary research from the industry experts belonging to:
- Leading Companies
- Suppliers & Distributors
- Manufacturers
- Consumers
- Industry/Strategic Consultants
Apart from the data validation the primary research also helps in performing the fill gap research, i.e. providing solutions for the unmet needs of the research which helps in enhancing the reports quality.
For more details about research methodology, kindly write to us at info@strategymrc.com
Frequently Asked Questions
In case of any queries regarding this report, you can contact the customer service by filing the “Inquiry Before Buy” form available on the right hand side. You may also contact us through email: info@strategymrc.com or phone: +1-301-202-5929
Yes, the samples are available for all the published reports. You can request them by filling the “Request Sample” option available in this page.
Yes, you can request a sample with your specific requirements. All the customized samples will be provided as per the requirement with the real data masked.
All our reports are available in Digital PDF format. In case if you require them in any other formats, such as PPT, Excel etc you can submit a request through “Inquiry Before Buy” form available on the right hand side. You may also contact us through email: info@strategymrc.com or phone: +1-301-202-5929
We offer a free 15% customization with every purchase. This requirement can be fulfilled for both pre and post sale. You may send your customization requirements through email at info@strategymrc.com or call us on +1-301-202-5929.
We have 3 different licensing options available in electronic format.
- Single User Licence: Allows one person, typically the buyer, to have access to the ordered product. The ordered product cannot be distributed to anyone else.
- 2-5 User Licence: Allows the ordered product to be shared among a maximum of 5 people within your organisation.
- Corporate License: Allows the product to be shared among all employees of your organisation regardless of their geographical location.
All our reports are typically be emailed to you as an attachment.
To order any available report you need to register on our website. The payment can be made either through CCAvenue or PayPal payments gateways which accept all international cards.
We extend our support to 6 months post sale. A post sale customization is also provided to cover your unmet needs in the report.
Request Customization
We provide a free 15% customization on every purchase. This requirement can be fulfilled for both pre and post sale. You may send your customization requirements through email at info@strategymrc.com or call us on +1-301-202-5929.
Note: This customization is absolutely free until it falls under the 15% bracket. If your requirement exceeds this a feasibility check will be performed. Post that, a quote will be provided along with the timelines.
WHY CHOOSE US ?

Assured Quality
Best in class reports with high standard of research integrity

24X7 Research Support
Continuous support to ensure the best customer experience.

Free Customization
Adding more values to your product of interest.

Safe & Secure Access
Providing a secured environment for all online transactions.

Trusted by 600+ Brands
Serving the most reputed brands across the world.