
Hydrogen Generation Market
Hydrogen Generation Market Forecasts to 2030 - Global Analysis By Type (Portable, On-site and Other Types), System (Merchant, Captive and Other Systems), Source, Technology, Application and By Geography

|
Years Covered |
2021-2030 |
|
Estimated Year Value (2023) |
US $172.9BN |
|
Projected Year Value (2030) |
US $365.8 BN |
|
CAGR (2023 - 2030) |
11.2% |
|
Regions Covered |
North America, Europe, Asia Pacific, South America, and Middle East & Africa |
|
Countries Covered |
US, Canada, Mexico, Germany, UK, Italy, France, Spain, Japan, China, India, Australia, New Zealand, South Korea, Rest of Asia Pacific, South America, Argentina, Brazil, Chile, Middle East & Africa, Saudi Arabia, UAE, Qatar, and South Africa |
|
Largest Market |
Asia Pacific |
|
Highest Growing Market |
Europe |
According to Stratistics MRC, the Global Hydrogen Generation Market is accounted for $172.9 billion in 2023 and is expected to reach $365.8 billion by 2030 growing at a CAGR of 11.2% during the forecast period. A plentiful and flavourless element, hydrogen, often known as H2, can be found in nature in a variety of forms. The chemical element can be created as a result of several processes and is typically present in the environment in a gaseous state. Additionally, hydrogen is widely used to power automobiles and as a clean fuel option for the production of electricity, and also several techniques, including electrolysis and steam methane reforming, are used throughout the sector to produce H2 in order to meet the rising demand for it in a variety of applications.
According to IEA, in January 2022, there were at least 50 blue hydrogen projects in the works around the world, with capacity expected to grow more than tenfold by 2030.
Market Dynamics:
Driver:
Green hydrogen generation technology development
About 95% of the total hydrogen produced is produced primarily by the gasification of coal and the steam reforming of natural gas. Electrolysis and carbon capture and storage (CCS) technologies are some of these hydrogen production processes. The carbon dioxide that is captured and stored in the blue hydrogen produced by CCS technology is released during the production process. As a result, these hydrogen technologies are projected to contribute to the market's expansion.
Restraint:
Energy loss in value chain
A synthetic energy carrier is hydrogen. Energy generated by numerous other processes is transported by it. Hydrogen must be produced using energy. The energy input and the energy content of the synthetic gas should ideally match. Energy transformation occurs throughout any process, including electrolysis and reforming, that produces hydrogen. Unfortunately, the production of hydrogen always involves energy losses. Every stage of the value chain for producing hydrogen results in energy loss. As a result, these elements are limiting the market's expansion.
Opportunity:
Favorable government policies and initiatives
The governments of various industrialised and rising nations have expressed a strong interest in reaching carbon neutrality. As transportation is the main source of air pollution, governments in various countries have been compelled to enact strict emission restrictions for passenger cars, light and heavy trucks, and other types of vehicles. Additionally, to support the growth of the industry, the administrations have modified their strategies to incorporate clean energy sectors in their future prospects.
Threat:
High capital cost of hydrogen energy storage
The most popular way to store hydrogen for small-scale mobile and stationary applications is as a gas or liquid in tanks. Hydrogen storage and transit both require compression and cooling systems. Hydrogen should be adsorbable quickly and reversibly in non-reactive media at low temperatures in storage tanks without the use of thermal energy. As a result, the hydrogen storage for the customised tanks comes at a high cost. This is the main issue impeding the market's expansion.
Covid-19 Impact
The financial stability of nations has been harmed by tight government laws designed to contain the virus, such as lockdowns at the national and state levels, restrictions on international travel, and social segregation practises. Due to declining demand and cash-deficit issues among small operators and clients, the global market for hydrogen generation has consequently been affected by the pandemic. However, various governments have revealed their plans to take advantage of the low carbon pollution conditions brought on by the shutdown of the industrial and transportation sectors, hence boosting demand for clean fuel alternatives.
The ammonia production segment is expected to be the largest during the forecast period
The ammonia production segment is estimated to have a lucrative growth, due to the rising government regulations in order to encourage desulphurization of fuels to conserve the environment. The largest users of hydrogen energy are the factories that make ammonia. Hydrogen usage in the ammonia factories has increased as a result of the on-site production of the gas. On the other hand, the industries with the most profitable prospects for expansion are transportation and electricity generating.
The steam methane reforming segment is expected to have the highest CAGR during the forecast period
The steam methane reforming segment is anticipated to witness the fastest CAGR growth during the forecast period, due to the extensive use of the steam methane reforming technology in the hydrogen generation process. Globally, this market had been expanding exponentially due to the constantly expanding need for hydrogen energy. Because hydrogen is a versatile commodity with a wide range of applications, steam reforming has become increasingly popular to satisfy rising consumer demand in a variety of industry sectors.
Region with Largest share:
Asia Pacific is projected to hold the largest market share during the forecast period owing to the rising demand for hydrogen for power generation in countries. A strong economic development that fuelled the expansion of the market in this area was demonstrated by the swift growth of numerous industries in the varied. The increasing demand for fuel cell-powered electric vehicles in the area is primarily responsible for the region's favourable growth.
Region with highest CAGR:
Europe is projected to have the highest CAGR over the forecast period, owing to the increased research and deployment of fuel cell systems. The market is expanding as a result of the increasing use of hydrogen-powered vehicles in the area. Demand in the area is expected to increase due to the region's rising emphasis on using cleaner fuel and adopting sustainable power generation methods. Additionally, the region's acceptance of R&D initiatives will probably increase market demand.

Key players in the market
Some of the key players profiled in the Hydrogen Generation Market include Cummins Inc., Linde plc, Nel ASA, Uniper SE, Messer Group, Air Liquide S.A., Xebec Adsorption Inc., Engie, Ballard Power systems, Air Products and Chemicals Inc., Hydrogenics,m Fuelcell Energy, Siemens, Praxair Inc., ITM Power, Plug Power and Hiringa Energy Limited.
Key Developments:
In March 2022, Air Products Inc. announced constructing and operating the new green liquid hydrogen production plant in Casa Grande, Arizona. It will be zero-carbon liquid hydrogen facility and will stream in the market by 2023.
In January 2022, Linde plc signed an agreement with Yara to construct and deliver a 24 MW green hydrogen plant.
Types Covered:
• Portable
• On-site
• Other Types
Systems Covered:
• Merchant
• Captive
• Other Systems
Sources Covered:
• Biomass
• Water
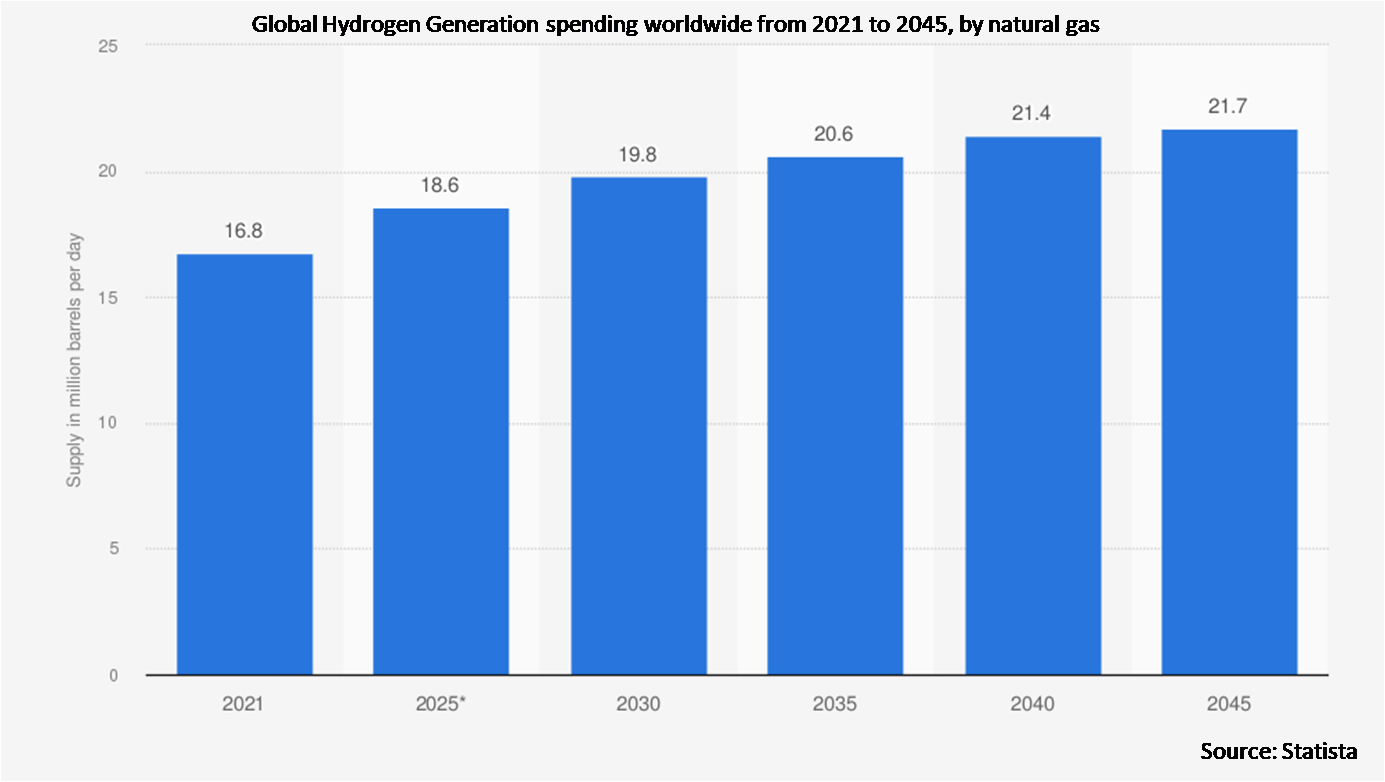
• Natural Gas
• Coal
• Other Sources
Technologies Covered:
• Coal Gasification
• Electrolysis
• Steam Methane Reforming
• Partial Oxidation
• Other Technologies
Applications Covered:
• Transportation
• Methanol production
• Petroleum Refining
• Ammonia Production
• Power Generation
• Chemical
• Metal
• Other Applications
Regions Covered:
• North America
o US
o Canada
o Mexico
• Europe
o Germany
o UK
o Italy
o France
o Spain
o Rest of Europe
• Asia Pacific
o Japan
o China
o India
o Australia
o New Zealand
o South Korea
o Rest of Asia Pacific
• South America
o Argentina
o Brazil
o Chile
o Rest of South America
• Middle East & Africa
o Saudi Arabia
o UAE
o Qatar
o South Africa
o Rest of Middle East & Africa
What our report offers:
- Market share assessments for the regional and country-level segments
- Strategic recommendations for the new entrants
- Covers Market data for the years 2021, 2022, 2023, 2026, and 2030
- Market Trends (Drivers, Constraints, Opportunities, Threats, Challenges, Investment Opportunities, and recommendations)
- Strategic recommendations in key business segments based on the market estimations
- Competitive landscaping mapping the key common trends
- Company profiling with detailed strategies, financials, and recent developments
- Supply chain trends mapping the latest technological advancements
Free Customization Offerings:
All the customers of this report will be entitled to receive one of the following free customization options:
• Company Profiling
o Comprehensive profiling of additional market players (up to 3)
o SWOT Analysis of key players (up to 3)
• Regional Segmentation
o Market estimations, Forecasts and CAGR of any prominent country as per the client's interest (Note: Depends on feasibility check)
• Competitive Benchmarking
o Benchmarking of key players based on product portfolio, geographical presence, and strategic alliances
Table of Contents
1 Executive Summary
2 Preface
2.1 Abstract
2.2 Stake Holders
2.3 Research Scope
2.4 Research Methodology
2.4.1 Data Mining
2.4.2 Data Analysis
2.4.3 Data Validation
2.4.4 Research Approach
2.5 Research Sources
2.5.1 Primary Research Sources
2.5.2 Secondary Research Sources
2.5.3 Assumptions
3 Market Trend Analysis
3.1 Introduction
3.2 Drivers
3.3 Restraints
3.4 Opportunities
3.5 Threats
3.6 Technology Analysis
3.7 Application Analysis
3.8 Emerging Markets
3.9 Impact of Covid-19
4 Porters Five Force Analysis
4.1 Bargaining power of suppliers
4.2 Bargaining power of buyers
4.3 Threat of substitutes
4.4 Threat of new entrants
4.5 Competitive rivalry
5 Global Hydrogen Generation Market, By Type
5.1 Introduction
5.2 Portable
5.3 On-site
5.4 Other Types
6 Global Hydrogen Generation Market, By System
6.1 Introduction
6.2 Merchant
6.3 Captive
6.4 Other Systems
7 Global Hydrogen Generation Market, By Source
7.1 Introduction
7.2 Biomass
7.3 Water
7.4 Natural Gas
7.5 Coal
7.6 Other Sources
8 Global Hydrogen Generation Market, By Technology
8.1 Introduction
8.2 Coal Gasification
8.3 Electrolysis
8.4 Steam Methane Reforming
8.5 Partial Oxidation
8.6 Other Technologies
9 Global Hydrogen Generation Market, By Application
9.1 Introduction
9.2 Transportation
9.3 Methanol production
9.4 Petroleum Refining
9.5 Ammonia Production
9.6 Power Generation
9.7 Chemical
9.8 Metal
9.9 Other Applications
10 Global Hydrogen Generation Market, By Geography
10.1 Introduction
10.2 North America
10.2.1 US
10.2.2 Canada
10.2.3 Mexico
10.3 Europe
10.3.1 Germany
10.3.2 UK
10.3.3 Italy
10.3.4 France
10.3.5 Spain
10.3.6 Rest of Europe
10.4 Asia Pacific
10.4.1 Japan
10.4.2 China
10.4.3 India
10.4.4 Australia
10.4.5 New Zealand
10.4.6 South Korea
10.4.7 Rest of Asia Pacific
10.5 South America
10.5.1 Argentina
10.5.2 Brazil
10.5.3 Chile
10.5.4 Rest of South America
10.6 Middle East & Africa
10.6.1 Saudi Arabia
10.6.2 UAE
10.6.3 Qatar
10.6.4 South Africa
10.6.5 Rest of Middle East & Africa
11 Key Developments
11.1 Agreements, Partnerships, Collaborations and Joint Ventures
11.2 Acquisitions & Mergers
11.3 New Product Launch
11.4 Expansions
11.5 Other Key Strategies
12 Company Profiling
12.1 Cummins Inc.
12.2 Linde plc
12.3 Nel ASA
12.4 Uniper SE
12.5 Messer Group
12.6 Air Liquide S.A.
12.7 Xebec Adsorption Inc.
12.8 Engie
12.9 Ballard Power systems
12.10 Air Products and Chemicals Inc.
12.11 Hydrogenics
12.12 Fuelcell Energy
12.13 Siemens
12.14 Praxair Inc.
12.15 ITM Power
12.16 Plug Power
12.17 Hiringa Energy Limited
List of Tables
1 Global Hydrogen Generation Market Outlook, By Region (2021-2030) ($MN)
2 Global Hydrogen Generation Market Outlook, By Type (2021-2030) ($MN)
3 Global Hydrogen Generation Market Outlook, By Portable (2021-2030) ($MN)
4 Global Hydrogen Generation Market Outlook, By On-site (2021-2030) ($MN)
5 Global Hydrogen Generation Market Outlook, By Other Types (2021-2030) ($MN)
6 Global Hydrogen Generation Market Outlook, By System (2021-2030) ($MN)
7 Global Hydrogen Generation Market Outlook, By Merchant (2021-2030) ($MN)
8 Global Hydrogen Generation Market Outlook, By Captive (2021-2030) ($MN)
9 Global Hydrogen Generation Market Outlook, By Other Systems (2021-2030) ($MN)
10 Global Hydrogen Generation Market Outlook, By Source (2021-2030) ($MN)
11 Global Hydrogen Generation Market Outlook, By Biomass (2021-2030) ($MN)
12 Global Hydrogen Generation Market Outlook, By Water (2021-2030) ($MN)
13 Global Hydrogen Generation Market Outlook, By Natural Gas (2021-2030) ($MN)
14 Global Hydrogen Generation Market Outlook, By Coal (2021-2030) ($MN)
15 Global Hydrogen Generation Market Outlook, By Other Sources (2021-2030) ($MN)
16 Global Hydrogen Generation Market Outlook, By Technology (2021-2030) ($MN)
17 Global Hydrogen Generation Market Outlook, By Coal Gasification (2021-2030) ($MN)
18 Global Hydrogen Generation Market Outlook, By Electrolysis (2021-2030) ($MN)
19 Global Hydrogen Generation Market Outlook, By Steam Methane Reforming (2021-2030) ($MN)
20 Global Hydrogen Generation Market Outlook, By Partial Oxidation (2021-2030) ($MN)
21 Global Hydrogen Generation Market Outlook, By Other Technologies (2021-2030) ($MN)
22 Global Hydrogen Generation Market Outlook, By Application (2021-2030) ($MN)
23 Global Hydrogen Generation Market Outlook, By Transportation (2021-2030) ($MN)
24 Global Hydrogen Generation Market Outlook, By Methanol production (2021-2030) ($MN)
25 Global Hydrogen Generation Market Outlook, By Petroleum Refining (2021-2030) ($MN)
26 Global Hydrogen Generation Market Outlook, By Ammonia Production (2021-2030) ($MN)
27 Global Hydrogen Generation Market Outlook, By Power Generation (2021-2030) ($MN)
28 Global Hydrogen Generation Market Outlook, By Chemical (2021-2030) ($MN)
29 Global Hydrogen Generation Market Outlook, By Metal (2021-2030) ($MN)
30 Global Hydrogen Generation Market Outlook, By Other Applications (2021-2030) ($MN)
Note: Tables for North America, Europe, APAC, South America, and Middle East & Africa Regions are also represented in the same manner as above.
List of Figures
RESEARCH METHODOLOGY

We at ‘Stratistics’ opt for an extensive research approach which involves data mining, data validation, and data analysis. The various research sources include in-house repository, secondary research, competitor’s sources, social media research, client internal data, and primary research.
Our team of analysts prefers the most reliable and authenticated data sources in order to perform the comprehensive literature search. With access to most of the authenticated data bases our team highly considers the best mix of information through various sources to obtain extensive and accurate analysis.
Each report takes an average time of a month and a team of 4 industry analysts. The time may vary depending on the scope and data availability of the desired market report. The various parameters used in the market assessment are standardized in order to enhance the data accuracy.
Data Mining
The data is collected from several authenticated, reliable, paid and unpaid sources and is filtered depending on the scope & objective of the research. Our reports repository acts as an added advantage in this procedure. Data gathering from the raw material suppliers, distributors and the manufacturers is performed on a regular basis, this helps in the comprehensive understanding of the products value chain. Apart from the above mentioned sources the data is also collected from the industry consultants to ensure the objective of the study is in the right direction.
Market trends such as technological advancements, regulatory affairs, market dynamics (Drivers, Restraints, Opportunities and Challenges) are obtained from scientific journals, market related national & international associations and organizations.
Data Analysis
From the data that is collected depending on the scope & objective of the research the data is subjected for the analysis. The critical steps that we follow for the data analysis include:
- Product Lifecycle Analysis
- Competitor analysis
- Risk analysis
- Porters Analysis
- PESTEL Analysis
- SWOT Analysis
The data engineering is performed by the core industry experts considering both the Marketing Mix Modeling and the Demand Forecasting. The marketing mix modeling makes use of multiple-regression techniques to predict the optimal mix of marketing variables. Regression factor is based on a number of variables and how they relate to an outcome such as sales or profits.
Data Validation
The data validation is performed by the exhaustive primary research from the expert interviews. This includes telephonic interviews, focus groups, face to face interviews, and questionnaires to validate our research from all aspects. The industry experts we approach come from the leading firms, involved in the supply chain ranging from the suppliers, distributors to the manufacturers and consumers so as to ensure an unbiased analysis.
We are in touch with more than 15,000 industry experts with the right mix of consultants, CEO's, presidents, vice presidents, managers, experts from both supply side and demand side, executives and so on.
The data validation involves the primary research from the industry experts belonging to:
- Leading Companies
- Suppliers & Distributors
- Manufacturers
- Consumers
- Industry/Strategic Consultants
Apart from the data validation the primary research also helps in performing the fill gap research, i.e. providing solutions for the unmet needs of the research which helps in enhancing the reports quality.
For more details about research methodology, kindly write to us at info@strategymrc.com
Frequently Asked Questions
In case of any queries regarding this report, you can contact the customer service by filing the “Inquiry Before Buy” form available on the right hand side. You may also contact us through email: info@strategymrc.com or phone: +1-301-202-5929
Yes, the samples are available for all the published reports. You can request them by filling the “Request Sample” option available in this page.
Yes, you can request a sample with your specific requirements. All the customized samples will be provided as per the requirement with the real data masked.
All our reports are available in Digital PDF format. In case if you require them in any other formats, such as PPT, Excel etc you can submit a request through “Inquiry Before Buy” form available on the right hand side. You may also contact us through email: info@strategymrc.com or phone: +1-301-202-5929
We offer a free 15% customization with every purchase. This requirement can be fulfilled for both pre and post sale. You may send your customization requirements through email at info@strategymrc.com or call us on +1-301-202-5929.
We have 3 different licensing options available in electronic format.
- Single User Licence: Allows one person, typically the buyer, to have access to the ordered product. The ordered product cannot be distributed to anyone else.
- 2-5 User Licence: Allows the ordered product to be shared among a maximum of 5 people within your organisation.
- Corporate License: Allows the product to be shared among all employees of your organisation regardless of their geographical location.
All our reports are typically be emailed to you as an attachment.
To order any available report you need to register on our website. The payment can be made either through CCAvenue or PayPal payments gateways which accept all international cards.
We extend our support to 6 months post sale. A post sale customization is also provided to cover your unmet needs in the report.
Request Customization
We provide a free 15% customization on every purchase. This requirement can be fulfilled for both pre and post sale. You may send your customization requirements through email at info@strategymrc.com or call us on +1-301-202-5929.
Note: This customization is absolutely free until it falls under the 15% bracket. If your requirement exceeds this a feasibility check will be performed. Post that, a quote will be provided along with the timelines.
WHY CHOOSE US ?

Assured Quality
Best in class reports with high standard of research integrity

24X7 Research Support
Continuous support to ensure the best customer experience.

Free Customization
Adding more values to your product of interest.

Safe & Secure Access
Providing a secured environment for all online transactions.

Trusted by 600+ Brands
Serving the most reputed brands across the world.