
Oil Shale Market
Oil Shale Market Forecasts to 2028 - Global Analysis By Product (Shale Gasoline, Shale Diesel, Kerosene and Other Products), By Technology (In-Situ Technology and Ex-Situ Technology), By Process (Oil Shale Exploration, Ore Preparation, Oil Shale Retorting and Shale Oil Refining & Specialty Services), By Application (Fuel, Electricity, Cement, Chemicals and Other Applications) and Geography

|
Years Covered |
2020-2028 |
|
Estimated Year Value (2022) |
US $3.36 BN |
|
Projected Year Value (2028) |
US $5.87 BN |
|
CAGR (2022 - 2028) |
9.7% |
|
Regions Covered |
North America, Europe, Asia Pacific, South America, and Middle East & Africa |
|
Countries Covered |
US, Canada, Mexico, Germany, UK, Italy, France, Spain, Japan, China, India, Australia, New Zealand, South Korea, Rest of Asia Pacific, South America, Argentina, Brazil, Chile, Middle East & Africa, Saudi Arabia, UAE, Qatar, and South Africa |
|
Largest Market |
North America |
|
Highest Growing Market |
Asia Pacific |
According to Stratistics MRC, the Global Oil Shale Market is accounted for $3.36 billion in 2022 and is expected to reach $5.87 billion by 2028 growing at a CAGR of 9.7% during the forecast period. Oil shale is a particular kind of rock that is rich in organic materials and contains kerogen, a solid mixture of organic chemical compounds. Due to its low cost of extraction, oil shale is a type of substitute that is used more frequently for conventional crude oil. Growing industrialization and rising energy demand are the key factors propelling the market's expansion.
According to the Organization for Economic Co-operation and Development (OECD), a surge in the price of crude oil began during the lockdown, due to extensive supply and less demand. However, there is no impact of COVID-19 on the oil shale market due to the extensive production of oil.
Market Dynamics:
Driver:
Growing petrochemical industry to drive the market
Many nations have significant shale oil reserves that could be used to reduce their reliance on oil imports to meet the needs of the domestic petrochemical industry. By offering an incentive to invest in shale oil production, this helps the shale oil industry in the country grow. Additionally, the market has been supplanted by better and cleaner alternatives, which has decreased the share of shale oil in transportation and power generation. The petrochemical industry is anticipated to grow significantly during the forecast period as a result of rising petrochemical product usage, the adoption of novel processes like direct crude cracking, and rising investments in the industry.
Restraint:
Expensive production and continuous usage of fossil fuels
As there is no alternative technology that is suitable for shale gas and because the current technology is still so expensive, shale gas drilling is two times more expensive than natural gas drilling. Additionally, even though these are different dates, oil, natural gas, and coal will all run out at some point. To lessen environmental pollution, the use of these resources ought to be decreased. By converting shale gas potential into actual production, fossil fuel use will last for a very long time.
Opportunity:
Rapid urbanization
The market is influenced by rising income levels and increased urbanization-related car sales. In addition, soaring energy demand and the construction of new power plants are fueling the market's expansion and boosting demand for shale oil. Shale oil can be used as a boiler fuel in a furnace to produce steam for electricity. Due to a sharp increase in construction development around the world, there is also an increase in demand for cement and other products which is driving the industry.
Threat:
Quickens the global warming
The environment could be seriously impacted by the extraction of oil from shale. The discussion surrounding the development of the resource is dominated by four specific areas of concern: greenhouse gas output, water consumption and pollution, surface disturbance, and socioeconomic effects. Concerns about shale gas production were expressed by environmentalists and specialists in climate change. This development led to the banning of shale gas drilling by many governments, including the French government.
Covid-19 Impact
The emergence of COVID-19 has coincided with a core oil market management dispute. The issue of oversupply and the global demand situation have a negative effect on the demand and price of oil shale. Due to the fluctuating prices of crude oil and natural gas, US shale oil and gas demand fell precipitously, prices fell precipitously, and bankruptcies were reported at a shockingly high rate. Natural gas proved reserves decreased by just under 22 trillion cubic feet (TCF), a decrease of 4%, while proved reserves of crude oil and lease condensate decreased by 9 billion barrels, a decrease of 19%. However, as travel restrictions were lifted as a result of the widespread vaccination campaigns in 2021, the demand for liquid fuels increased. This is anticipated to lead to an increase in the demand for oil shale, which will fuel the expansion of the regional oil shale market over the course of the forecast period.
The In-Situ Technology segment is expected to be the largest during the forecast period
The In-Situ technology segment had the largest market share and is anticipated to maintain its dominance throughout the forecast period. Since then, this technology has been widely employed; in-situ retorting is the only method to achieve large-scale industrial exploitation. When oil shale is heated directly underground during in-situ exploitation, other products such as gas and oil are also recovered through dry distillation and collected through the production well. Due to its advantages, such as low environmental contamination, a high oil recovery rate, good product quality, and minimal floor space requirements, in-situ mining technology has gradually replaced oil shale mining.
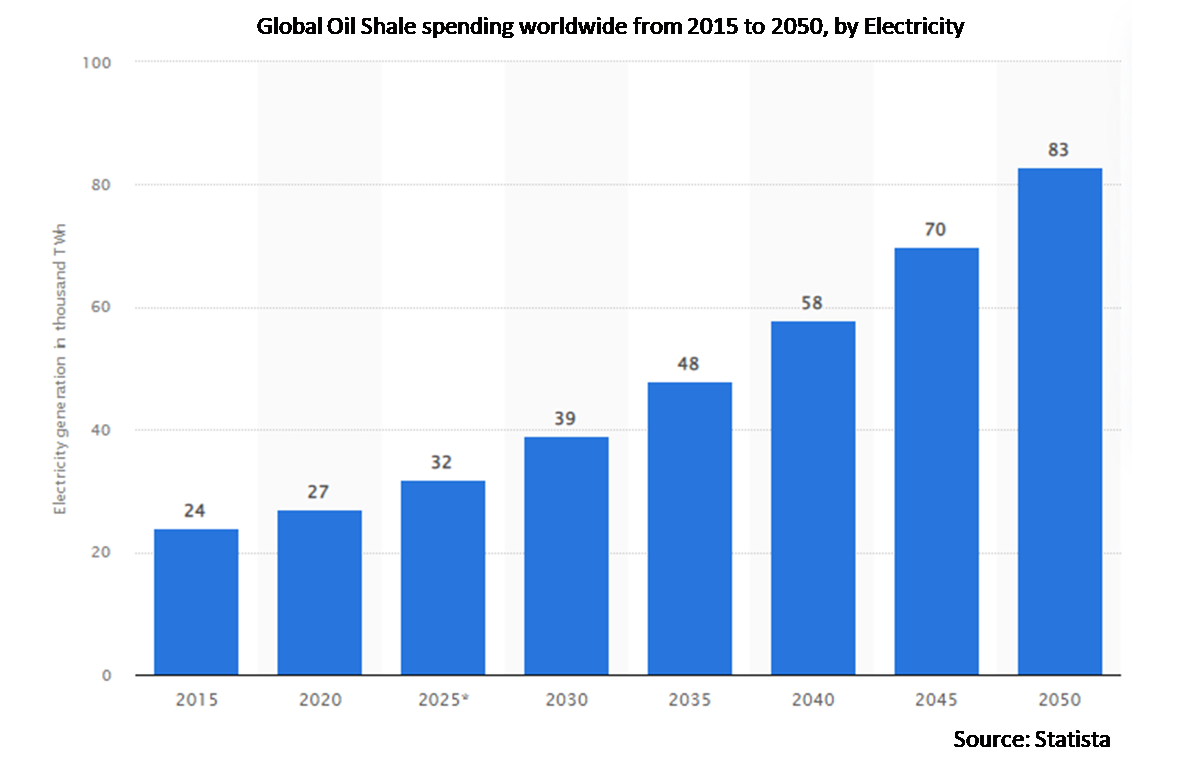
The Electricity segment is expected to have the highest CAGR during the forecast period
During the forecast period, the electricity segment is anticipated to witness the highest CAGR. The electricity segment will post lucrative growth during this period. Moreover, the appeal of producing shale oil and/or electric energy from oil shale has grown to the point where the nation's energy diversity has increased in terms of both economic and strategic importance in today's world, where oil and electricity are becoming more and more difficult to obtain. These factors are anticipated to support the expansion of the electricity segment.
Region with largest share:
Due to the rising need for affordable alternatives to conventional energy, the region's growing oil and energy industries, and the increasing depletion of non-renewable energy sources, the North American region is anticipated to dominate the oil shale market throughout the forecast period. The two biggest markets in North America for oil shale are the US and Canada. Moreover, with a significant increase in production, US shale oil is now competitive with Saudi Arabia and Russia in terms of market share.
Region with highest CAGR:
The Asia Pacific region is anticipated to witness the highest CAGR during the forecast period, owing to the region's growing preference for oil shale as a substitute component in conventional fuels and its expanding oil and energy industries. Furthermore, the demand for cutting-edge technology, tools, and equipment to boost the effectiveness of exploration and production activities in onshore and offshore areas is also anticipated to fuel the growth of the oil shale services market in the Asia-Pacific region.

Key players in the market
Some of the key players profiled in the Oil Shale Market include Electro-Petroleum Inc., Exxon Mobil Corp., Fushun Mining Group Co., Ltd, Global Resource Corp, Imperial Petroleum Recovery Corp., Independent Energy Partners, Millennium Synfuels, Llc, Mountain West Energy, Afsk Hom Tov, American Resource Petroleum Corp., American Shale Oil Corp., Aurasource Inc., Blue Ensign Technologies Ltd., Chattanooga Corp., Chevron Shale Oil Company, Narva Oil Plant, Petro Probe, Inc, Petrobras, Schlumberger, Shale Technologies, Llc and Shell Oil Co.
Key Developments:
In January 2023, Matador Resources that a wholly-owned subsidiary of Matador has entered into a definitive agreement to acquire Advance Energy Partners Holdings, LLC (“Advance”), including certain oil and natural gas producing properties and undeveloped acreage located in Lea County, New Mexico and Ward County, Texas (the “Advance Transaction”). The consideration for the Advance Transaction will consist of an initial cash payment of $1.6 billion.
In January 2021, OPEC has cut its 2021 forecast for US tight crude, another term for shale, and expects production to decline by 140,000 barrels per day to 7.16 million bpd. The US government expects shale output in March 2020 to fall about 78,000 bpd to 7.5 million. This is even when the price of crude is expected to rise, giving much-needed leeway to the shale oil and gas producers.
Products Covered:
• Shale Gasoline
• Shale Diesel
• Kerosene
• Other Products
Technologies Covered:
• In-Situ Technology
• Ex-Situ Technology
Process Covered:
• Oil Shale Exploration
• Ore Preparation
• Oil Shale Retorting
• Shale Oil Refining & Specialty Services
Applications Covered:
• Fuel
• Electricity
• Cement
• Chemicals
• Other Applications
Regions Covered:
• North America
o US
o Canada
o Mexico
• Europe
o Germany
o UK
o Italy
o France
o Spain
o Rest of Europe
• Asia Pacific
o Japan
o China
o India
o Australia
o New Zealand
o South Korea
o Rest of Asia Pacific
• South America
o Argentina
o Brazil
o Chile
o Rest of South America
• Middle East & Africa
o Saudi Arabia
o UAE
o Qatar
o South Africa
o Rest of Middle East & Africa
What our report offers:
- Market share assessments for the regional and country-level segments
- Strategic recommendations for the new entrants
- Covers Market data for the years 2020, 2021, 2022, 2025, and 2028
- Market Trends (Drivers, Constraints, Opportunities, Threats, Challenges, Investment Opportunities, and recommendations)
- Strategic recommendations in key business segments based on the market estimations
- Competitive landscaping mapping the key common trends
- Company profiling with detailed strategies, financials, and recent developments
- Supply chain trends mapping the latest technological advancements
Free Customization Offerings:
All the customers of this report will be entitled to receive one of the following free customization options:
• Company Profiling
o Comprehensive profiling of additional market players (up to 3)
o SWOT Analysis of key players (up to 3)
• Regional Segmentation
o Market estimations, Forecasts and CAGR of any prominent country as per the client's interest (Note: Depends on feasibility check)
• Competitive Benchmarking
o Benchmarking of key players based on product portfolio, geographical presence, and strategic alliances
Table of Contents
1 Executive Summary
2 Preface
2.1 Abstract
2.2 Stake Holders
2.3 Research Scope
2.4 Research Methodology
2.4.1 Data Mining
2.4.2 Data Analysis
2.4.3 Data Validation
2.4.4 Research Approach
2.5 Research Sources
2.5.1 Primary Research Sources
2.5.2 Secondary Research Sources
2.5.3 Assumptions
3 Market Trend Analysis
3.1 Introduction
3.2 Drivers
3.3 Restraints
3.4 Opportunities
3.5 Threats
3.6 Product Analysis
3.7 Technology Analysis
3.8 Application Analysis
3.9 Emerging Markets
3.10 Impact of Covid-19
4 Porters Five Force Analysis
4.1 Bargaining power of suppliers
4.2 Bargaining power of buyers
4.3 Threat of substitutes
4.4 Threat of new entrants
4.5 Competitive rivalry
5 Global Oil Shale Market, By Product
5.1 Introduction
5.2 Shale Gasoline
5.3 Shale Diesel
5.4 Kerosene
5.5 Other Products
6 Global Oil Shale Market, By Technology
6.1 Introduction
6.2 In-Situ Technology
6.3 Ex-Situ Technology
7 Global Oil Shale Market, By Process
7.1 Introduction
7.2 Oil Shale Exploration
7.3 Ore Preparation
7.4 Oil Shale Retorting
7.5 Shale Oil Refining & Specialty Services
8 Global Oil Shale Market, By Application
8.1 Introduction
8.2 Fuel
8.3 Electricity
8.4 Cement
8.5 Chemicals
8.6 Other Applications
9 Global Oil Shale Market, By Geography
9.1 Introduction
9.2 North America
9.2.1 US
9.2.2 Canada
9.2.3 Mexico
9.3 Europe
9.3.1 Germany
9.3.2 UK
9.3.3 Italy
9.3.4 France
9.3.5 Spain
9.3.6 Rest of Europe
9.4 Asia Pacific
9.4.1 Japan
9.4.2 China
9.4.3 India
9.4.4 Australia
9.4.5 New Zealand
9.4.6 South Korea
9.4.7 Rest of Asia Pacific
9.5 South America
9.5.1 Argentina
9.5.2 Brazil
9.5.3 Chile
9.5.4 Rest of South America
9.6 Middle East & Africa
9.6.1 Saudi Arabia
9.6.2 UAE
9.6.3 Qatar
9.6.4 South Africa
9.6.5 Rest of Middle East & Africa
10 Key Developments
10.1 Agreements, Partnerships, Collaborations and Joint Ventures
10.2 Acquisitions & Mergers
10.3 New Product Launch
10.4 Expansions
10.5 Other Key Strategies
11 Company Profiling
11.1 Afsk Hom Tov
11.2 American Resource Petroleum Corp.
11.3 American Shale Oil Corp.
11.4 Aurasource Inc.
11.5 Blue Ensign Technologies Ltd.
11.6 Chattanooga Corp.
11.7 Chevron Shale Oil Company
11.8 Electro-Petroleum Inc.
11.9 Exxon Mobil Corp.
11.10 Fushun Mining Group Co., Ltd
11.11 Global Resource Corp
11.12 Imperial Petroleum Recovery Corp.
11.13 Independent Energy Partners
11.14 Millennium Synfuels, Llc
11.15 Mountain West Energy
11.16 Narva Oil Plant
11.17 Petro Probe, Inc
11.18 Petrobras
11.19 Queensland Energy Resources
11.20 Schlumberger
11.21 Shale Technologies, Llc
11.22 Shell Oil Co.
11.23 Viru Keemia Group
11.24 Xtract Energy Plc
List of Tables
1 Global Oil Shale Market Outlook, By Region (2020-2028) ($MN)
2 Global Oil Shale Market Outlook, By Product (2020-2028) ($MN)
3 Global Oil Shale Market Outlook, By Shale Gasoline (2020-2028) ($MN)
4 Global Oil Shale Market Outlook, By Shale Diesel (2020-2028) ($MN)
5 Global Oil Shale Market Outlook, By Kerosene (2020-2028) ($MN)
6 Global Oil Shale Market Outlook, By Other Products (2020-2028) ($MN)
7 Global Oil Shale Market Outlook, By Technology (2020-2028) ($MN)
8 Global Oil Shale Market Outlook, By In-Situ Technology (2020-2028) ($MN)
9 Global Oil Shale Market Outlook, By Ex-Situ Technology (2020-2028) ($MN)
10 Global Oil Shale Market Outlook, By Process (2020-2028) ($MN)
11 Global Oil Shale Market Outlook, By Oil Shale Exploration (2020-2028) ($MN)
12 Global Oil Shale Market Outlook, By Ore Preparation (2020-2028) ($MN)
13 Global Oil Shale Market Outlook, By Oil Shale Retorting (2020-2028) ($MN)
14 Global Oil Shale Market Outlook, By Shale Oil Refining & Specialty Services (2020-2028) ($MN)
15 Global Oil Shale Market Outlook, By Application (2020-2028) ($MN)
16 Global Oil Shale Market Outlook, By Fuel (2020-2028) ($MN)
17 Global Oil Shale Market Outlook, By Electricity (2020-2028) ($MN)
18 Global Oil Shale Market Outlook, By Cement (2020-2028) ($MN)
19 Global Oil Shale Market Outlook, By Chemicals (2020-2028) ($MN)
20 Global Oil Shale Market Outlook, By Other Applications (2020-2028) ($MN)
21 North America Oil Shale Market Outlook, By Country (2020-2028) ($MN)
22 North America Oil Shale Market Outlook, By Product (2020-2028) ($MN)
23 North America Oil Shale Market Outlook, By Shale Gasoline (2020-2028) ($MN)
24 North America Oil Shale Market Outlook, By Shale Diesel (2020-2028) ($MN)
25 North America Oil Shale Market Outlook, By Kerosene (2020-2028) ($MN)
26 North America Oil Shale Market Outlook, By Other Products (2020-2028) ($MN)
27 North America Oil Shale Market Outlook, By Technology (2020-2028) ($MN)
28 North America Oil Shale Market Outlook, By In-Situ Technology (2020-2028) ($MN)
29 North America Oil Shale Market Outlook, By Ex-Situ Technology (2020-2028) ($MN)
30 North America Oil Shale Market Outlook, By Process (2020-2028) ($MN)
31 North America Oil Shale Market Outlook, By Oil Shale Exploration (2020-2028) ($MN)
32 North America Oil Shale Market Outlook, By Ore Preparation (2020-2028) ($MN)
33 North America Oil Shale Market Outlook, By Oil Shale Retorting (2020-2028) ($MN)
34 North America Oil Shale Market Outlook, By Shale Oil Refining & Specialty Services (2020-2028) ($MN)
35 North America Oil Shale Market Outlook, By Application (2020-2028) ($MN)
36 North America Oil Shale Market Outlook, By Fuel (2020-2028) ($MN)
37 North America Oil Shale Market Outlook, By Electricity (2020-2028) ($MN)
38 North America Oil Shale Market Outlook, By Cement (2020-2028) ($MN)
39 North America Oil Shale Market Outlook, By Chemicals (2020-2028) ($MN)
40 North America Oil Shale Market Outlook, By Other Applications (2020-2028) ($MN)
41 Europe Oil Shale Market Outlook, By Country (2020-2028) ($MN)
42 Europe Oil Shale Market Outlook, By Product (2020-2028) ($MN)
43 Europe Oil Shale Market Outlook, By Shale Gasoline (2020-2028) ($MN)
44 Europe Oil Shale Market Outlook, By Shale Diesel (2020-2028) ($MN)
45 Europe Oil Shale Market Outlook, By Kerosene (2020-2028) ($MN)
46 Europe Oil Shale Market Outlook, By Other Products (2020-2028) ($MN)
47 Europe Oil Shale Market Outlook, By Technology (2020-2028) ($MN)
48 Europe Oil Shale Market Outlook, By In-Situ Technology (2020-2028) ($MN)
49 Europe Oil Shale Market Outlook, By Ex-Situ Technology (2020-2028) ($MN)
50 Europe Oil Shale Market Outlook, By Process (2020-2028) ($MN)
51 Europe Oil Shale Market Outlook, By Oil Shale Exploration (2020-2028) ($MN)
52 Europe Oil Shale Market Outlook, By Ore Preparation (2020-2028) ($MN)
53 Europe Oil Shale Market Outlook, By Oil Shale Retorting (2020-2028) ($MN)
54 Europe Oil Shale Market Outlook, By Shale Oil Refining & Specialty Services (2020-2028) ($MN)
55 Europe Oil Shale Market Outlook, By Application (2020-2028) ($MN)
56 Europe Oil Shale Market Outlook, By Fuel (2020-2028) ($MN)
57 Europe Oil Shale Market Outlook, By Electricity (2020-2028) ($MN)
58 Europe Oil Shale Market Outlook, By Cement (2020-2028) ($MN)
59 Europe Oil Shale Market Outlook, By Chemicals (2020-2028) ($MN)
60 Europe Oil Shale Market Outlook, By Other Applications (2020-2028) ($MN)
61 Asia Pacific Oil Shale Market Outlook, By Country (2020-2028) ($MN)
62 Asia Pacific Oil Shale Market Outlook, By Product (2020-2028) ($MN)
63 Asia Pacific Oil Shale Market Outlook, By Shale Gasoline (2020-2028) ($MN)
64 Asia Pacific Oil Shale Market Outlook, By Shale Diesel (2020-2028) ($MN)
65 Asia Pacific Oil Shale Market Outlook, By Kerosene (2020-2028) ($MN)
66 Asia Pacific Oil Shale Market Outlook, By Other Products (2020-2028) ($MN)
67 Asia Pacific Oil Shale Market Outlook, By Technology (2020-2028) ($MN)
68 Asia Pacific Oil Shale Market Outlook, By In-Situ Technology (2020-2028) ($MN)
69 Asia Pacific Oil Shale Market Outlook, By Ex-Situ Technology (2020-2028) ($MN)
70 Asia Pacific Oil Shale Market Outlook, By Process (2020-2028) ($MN)
71 Asia Pacific Oil Shale Market Outlook, By Oil Shale Exploration (2020-2028) ($MN)
72 Asia Pacific Oil Shale Market Outlook, By Ore Preparation (2020-2028) ($MN)
73 Asia Pacific Oil Shale Market Outlook, By Oil Shale Retorting (2020-2028) ($MN)
74 Asia Pacific Oil Shale Market Outlook, By Shale Oil Refining & Specialty Services (2020-2028) ($MN)
75 Asia Pacific Oil Shale Market Outlook, By Application (2020-2028) ($MN)
76 Asia Pacific Oil Shale Market Outlook, By Fuel (2020-2028) ($MN)
77 Asia Pacific Oil Shale Market Outlook, By Electricity (2020-2028) ($MN)
78 Asia Pacific Oil Shale Market Outlook, By Cement (2020-2028) ($MN)
79 Asia Pacific Oil Shale Market Outlook, By Chemicals (2020-2028) ($MN)
80 Asia Pacific Oil Shale Market Outlook, By Other Applications (2020-2028) ($MN)
81 South America Oil Shale Market Outlook, By Country (2020-2028) ($MN)
82 South America Oil Shale Market Outlook, By Product (2020-2028) ($MN)
83 South America Oil Shale Market Outlook, By Shale Gasoline (2020-2028) ($MN)
84 South America Oil Shale Market Outlook, By Shale Diesel (2020-2028) ($MN)
85 South America Oil Shale Market Outlook, By Kerosene (2020-2028) ($MN)
86 South America Oil Shale Market Outlook, By Other Products (2020-2028) ($MN)
87 South America Oil Shale Market Outlook, By Technology (2020-2028) ($MN)
88 South America Oil Shale Market Outlook, By In-Situ Technology (2020-2028) ($MN)
89 South America Oil Shale Market Outlook, By Ex-Situ Technology (2020-2028) ($MN)
90 South America Oil Shale Market Outlook, By Process (2020-2028) ($MN)
91 South America Oil Shale Market Outlook, By Oil Shale Exploration (2020-2028) ($MN)
92 South America Oil Shale Market Outlook, By Ore Preparation (2020-2028) ($MN)
93 South America Oil Shale Market Outlook, By Oil Shale Retorting (2020-2028) ($MN)
94 South America Oil Shale Market Outlook, By Shale Oil Refining & Specialty Services (2020-2028) ($MN)
95 South America Oil Shale Market Outlook, By Application (2020-2028) ($MN)
96 South America Oil Shale Market Outlook, By Fuel (2020-2028) ($MN)
97 South America Oil Shale Market Outlook, By Electricity (2020-2028) ($MN)
98 South America Oil Shale Market Outlook, By Cement (2020-2028) ($MN)
99 South America Oil Shale Market Outlook, By Chemicals (2020-2028) ($MN)
100 South America Oil Shale Market Outlook, By Other Applications (2020-2028) ($MN)
101 Middle East & Africa Oil Shale Market Outlook, By Country (2020-2028) ($MN)
102 Middle East & Africa Oil Shale Market Outlook, By Product (2020-2028) ($MN)
103 Middle East & Africa Oil Shale Market Outlook, By Shale Gasoline (2020-2028) ($MN)
104 Middle East & Africa Oil Shale Market Outlook, By Shale Diesel (2020-2028) ($MN)
105 Middle East & Africa Oil Shale Market Outlook, By Kerosene (2020-2028) ($MN)
106 Middle East & Africa Oil Shale Market Outlook, By Other Products (2020-2028) ($MN)
107 Middle East & Africa Oil Shale Market Outlook, By Technology (2020-2028) ($MN)
108 Middle East & Africa Oil Shale Market Outlook, By In-Situ Technology (2020-2028) ($MN)
109 Middle East & Africa Oil Shale Market Outlook, By Ex-Situ Technology (2020-2028) ($MN)
110 Middle East & Africa Oil Shale Market Outlook, By Process (2020-2028) ($MN)
111 Middle East & Africa Oil Shale Market Outlook, By Oil Shale Exploration (2020-2028) ($MN)
112 Middle East & Africa Oil Shale Market Outlook, By Ore Preparation (2020-2028) ($MN)
113 Middle East & Africa Oil Shale Market Outlook, By Oil Shale Retorting (2020-2028) ($MN)
114 Middle East & Africa Oil Shale Market Outlook, By Shale Oil Refining & Specialty Services (2020-2028) ($MN)
115 Middle East & Africa Oil Shale Market Outlook, By Application (2020-2028) ($MN)
116 Middle East & Africa Oil Shale Market Outlook, By Fuel (2020-2028) ($MN)
117 Middle East & Africa Oil Shale Market Outlook, By Electricity (2020-2028) ($MN)
118 Middle East & Africa Oil Shale Market Outlook, By Cement (2020-2028) ($MN)
119 Middle East & Africa Oil Shale Market Outlook, By Chemicals (2020-2028) ($MN)
120 Middle East & Africa Oil Shale Market Outlook, By Other Applications (2020-2028) ($MN)
List of Figures
RESEARCH METHODOLOGY

We at ‘Stratistics’ opt for an extensive research approach which involves data mining, data validation, and data analysis. The various research sources include in-house repository, secondary research, competitor’s sources, social media research, client internal data, and primary research.
Our team of analysts prefers the most reliable and authenticated data sources in order to perform the comprehensive literature search. With access to most of the authenticated data bases our team highly considers the best mix of information through various sources to obtain extensive and accurate analysis.
Each report takes an average time of a month and a team of 4 industry analysts. The time may vary depending on the scope and data availability of the desired market report. The various parameters used in the market assessment are standardized in order to enhance the data accuracy.
Data Mining
The data is collected from several authenticated, reliable, paid and unpaid sources and is filtered depending on the scope & objective of the research. Our reports repository acts as an added advantage in this procedure. Data gathering from the raw material suppliers, distributors and the manufacturers is performed on a regular basis, this helps in the comprehensive understanding of the products value chain. Apart from the above mentioned sources the data is also collected from the industry consultants to ensure the objective of the study is in the right direction.
Market trends such as technological advancements, regulatory affairs, market dynamics (Drivers, Restraints, Opportunities and Challenges) are obtained from scientific journals, market related national & international associations and organizations.
Data Analysis
From the data that is collected depending on the scope & objective of the research the data is subjected for the analysis. The critical steps that we follow for the data analysis include:
- Product Lifecycle Analysis
- Competitor analysis
- Risk analysis
- Porters Analysis
- PESTEL Analysis
- SWOT Analysis
The data engineering is performed by the core industry experts considering both the Marketing Mix Modeling and the Demand Forecasting. The marketing mix modeling makes use of multiple-regression techniques to predict the optimal mix of marketing variables. Regression factor is based on a number of variables and how they relate to an outcome such as sales or profits.
Data Validation
The data validation is performed by the exhaustive primary research from the expert interviews. This includes telephonic interviews, focus groups, face to face interviews, and questionnaires to validate our research from all aspects. The industry experts we approach come from the leading firms, involved in the supply chain ranging from the suppliers, distributors to the manufacturers and consumers so as to ensure an unbiased analysis.
We are in touch with more than 15,000 industry experts with the right mix of consultants, CEO's, presidents, vice presidents, managers, experts from both supply side and demand side, executives and so on.
The data validation involves the primary research from the industry experts belonging to:
- Leading Companies
- Suppliers & Distributors
- Manufacturers
- Consumers
- Industry/Strategic Consultants
Apart from the data validation the primary research also helps in performing the fill gap research, i.e. providing solutions for the unmet needs of the research which helps in enhancing the reports quality.
For more details about research methodology, kindly write to us at info@strategymrc.com
Frequently Asked Questions
In case of any queries regarding this report, you can contact the customer service by filing the “Inquiry Before Buy” form available on the right hand side. You may also contact us through email: info@strategymrc.com or phone: +1-301-202-5929
Yes, the samples are available for all the published reports. You can request them by filling the “Request Sample” option available in this page.
Yes, you can request a sample with your specific requirements. All the customized samples will be provided as per the requirement with the real data masked.
All our reports are available in Digital PDF format. In case if you require them in any other formats, such as PPT, Excel etc you can submit a request through “Inquiry Before Buy” form available on the right hand side. You may also contact us through email: info@strategymrc.com or phone: +1-301-202-5929
We offer a free 15% customization with every purchase. This requirement can be fulfilled for both pre and post sale. You may send your customization requirements through email at info@strategymrc.com or call us on +1-301-202-5929.
We have 3 different licensing options available in electronic format.
- Single User Licence: Allows one person, typically the buyer, to have access to the ordered product. The ordered product cannot be distributed to anyone else.
- 2-5 User Licence: Allows the ordered product to be shared among a maximum of 5 people within your organisation.
- Corporate License: Allows the product to be shared among all employees of your organisation regardless of their geographical location.
All our reports are typically be emailed to you as an attachment.
To order any available report you need to register on our website. The payment can be made either through CCAvenue or PayPal payments gateways which accept all international cards.
We extend our support to 6 months post sale. A post sale customization is also provided to cover your unmet needs in the report.
Request Customization
We provide a free 15% customization on every purchase. This requirement can be fulfilled for both pre and post sale. You may send your customization requirements through email at info@strategymrc.com or call us on +1-301-202-5929.
Note: This customization is absolutely free until it falls under the 15% bracket. If your requirement exceeds this a feasibility check will be performed. Post that, a quote will be provided along with the timelines.
WHY CHOOSE US ?

Assured Quality
Best in class reports with high standard of research integrity

24X7 Research Support
Continuous support to ensure the best customer experience.

Free Customization
Adding more values to your product of interest.

Safe & Secure Access
Providing a secured environment for all online transactions.

Trusted by 600+ Brands
Serving the most reputed brands across the world.