
Recloser Market
Recloser Market Forecasts to 2028 - Global Analysis By Phase (Single Phase, Three Phase, Triple Single Phase and Other Phases), Control, Voltage, Interruption and By Geography

|
Years Covered |
2020-2028 |
|
Estimated Year Value (2022) |
US $1.5 BN |
|
Projected Year Value (2028) |
US $2.3 BN |
|
CAGR (2022 - 2028) |
7.3% |
|
Regions Covered |
North America, Europe, Asia Pacific, South America, and Middle East & Africa |
|
Countries Covered |
US, Canada, Mexico, Germany, UK, Italy, France, Spain, Japan, China, India, Australia, New Zealand, South Korea, Rest of Asia Pacific, South America, Argentina, Brazil, Chile, Middle East & Africa, Saudi Arabia, UAE, Qatar, and South Africa |
|
Largest Market |
Asia Pacific |
|
Highest Growing Market |
Europe |
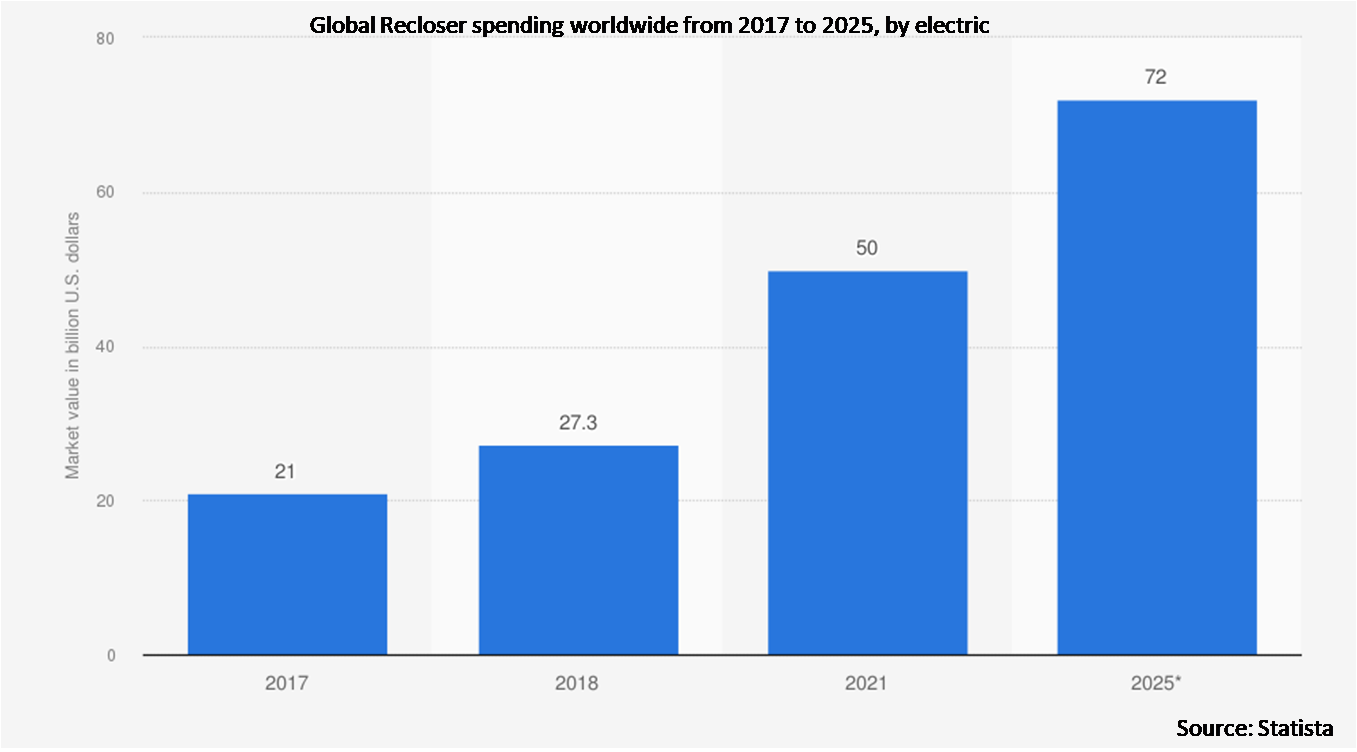
According to Stratistics MRC, the Global Recloser Market is accounted for $1.5 billion in 2022 and is expected to reach $2.3 billion by 2028 growing at a CAGR of 7.3% during the forecast period. Reclosers are a type of electrical power device that serves as a circuit's electric switch. They automatically interrupt the circuit when they notice any errors or anomalies in the power supply to prevent short circuits. Reclosers identify the problematic line first, and then they automatically fix the problem as well. They are able to manually or automatically reset the faults and then restore the power supply. To prevent short circuit-related events, they are mostly employed in businesses, manufacturing facilities, malls, and office settings.
According to the World Investment Report, developing economies had poised a growth in foreign direct investment worth USD 671 billion. According to the UN environment association, China accounted for 32% of total global investment in renewable energy, followed by Europe at 21%, the U.S. at 17%, and Asia-Oceania at 15%.
Market Dynamics:
Driver:
Increased automation
Demand for power supply has greatly increased due to the significant increase in urbanisation and industrialisation activities. To fulfil the daily demands, this has put an excessive burden on the facilities that produce and supply electricity. Also, the need for recloser systems to automate the process and eliminate manual intervention for restoring power supply has been driven by the expansion of automated activities. Therefore, this is the major factor propelling the growth of the market.
Restraint:
Availability of Cheap alternatives
Reclosers are now being replaced by less expensive models made by a number of safety system manufacturers. The recloser sector is under pressure from increased competition to deliver better after-sales services. Nonetheless, because they are cost-conscious markets, price is a key consideration when making purchases. Reclosers are vulnerable to competition from less expensive alternatives, which could impede market expansion.
Opportunity:
Increasing investments in smart grids
Electricity transmission from the point of generation to the final consumer is tracked and managed by a smart grid. It maximises system dependability, stability, and resilience while minimising costs and serving as a key facilitator of energy security. Also, numerous government agencies have amended the rules governing performance-based revenue to include a reliability element. Hence, this factor is fuelling the expansion of the market.
Threat:
Lack of adequate financing from governments
Funding renewable energy continues to encounter numerous obstacles, including high capital costs, a lack of suitable government financing, and loan terms that are too short. The installation of reclosers requires line modernisation and modifications, resulting in a substantial capital cost. However, the lack of adequate government financing, especially in developing countries, is expected to hinder the market growth in the coming years.
Covid-19 Impact
COVID-19 has had a negative influence on the worldwide recloser industry because employees are being requested to work from home and industrial sectors are temporarily shuttered. As a result, a lot of businesses have cut back on their production and supply activities, which has eliminated the demand for recloser. Nonetheless, factors boosting market growth include increased investments in the renewable energy industry, expanding transmission and distribution networks, and smart grid initiatives. A lucrative demand for this market would also be created by technological advancements and other strategic collaborations among the leading players in the sector.
The hydraulic segment is expected to be the largest during the forecast period
The hydraulic segment is estimated to have a lucrative growth, as they are reliable and require low maintenance. The majority of single phase and three phase reclosers use hydraulic reclosers. They are installed within a recloser and have the ability to instantly detect an over current and shut off the circuit. Also, because hydraulic reclosers are quite inexpensive, their demand is growing in the market.
The vacuum segment is expected to have the highest CAGR during the forecast period
The vacuum segment is anticipated to witness the fastest CAGR growth during the forecast period, owing to its advantageous features such as improved reliability, environment-friendly nature, cost-efficiency, easily recyclable technology, and arc quenching property. To provide a dependable solution, the distribution requirements of electrical utilities, combined with easy recyclability and eco-friendly technologies, are likely to drive segment expansion.
Region with Largest share:
Asia Pacific is projected to hold the largest market share during the growing demand for electrical energy due to industrialization and urbanization, distribution network upgrade, and rising need for power reliability. Additionally, growing investments in smart grid infrastructure projects, effective governmental initiatives, existing projects, and the increased need for a consistent and dependable supply of power are all expected to contribute to the region's growth.
Region with highest CAGR:
Europe is projected to have the highest CAGR over the forecast period, owing to the growing residential demand for reclosers. The primary reason having a beneficial effect on the market is the rising demand for electrical energy from diverse sources, including residential settlements and commercial outlets. Recloser devices are in higher demand as a result of further developing industrialization and rising investments in smart grid infrastructure projects.

Key players in the market
Some of the key players profiled in the Recloser Market include ABB, OMICRON, Siemens, Solomon Corporation, Schneider Electric, Eaton, Hughes Power System, Ergon Energy, Entec Electric and Electronic, Arteche, Noja Power, General Electrics, Tavrida Electrical Global, G&W Electric Co., Inmarsat, CPS Energy, S&C Electric Company, BRUSH Group, Iljin Electric. and Hubbell.
Key Developments:
In February 2022, Eaton Corporation announced the launch of its new Cooper Power series NOVA NX-T recloser, which features improved reliability, enhanced communication capabilities, and a compact design aiming at improving the efficiency and reliability of power distribution networks. Earlier this spring, Eaton and LG announced the launch of a ground-breaking project, “Residential Virtual Power Plant.”
In April 2021, OMICRON hosted a live virtual 6th annual recloser & distribution automation workshop for reclosers and recloser controls & utilities manufacturers. It facilitated the manufacturers to share their experiences regarding testing, distribution automation, and knowledge in reclosers.
Phases Covered:
• Single Phase
• Three Phase
• Triple Single Phase
• Other Phases
Controls Covered:
• Hydraulic
• Electric
• Resettable Electronic
• Programmable Resettable
• Other Controls
Voltages Covered:
• Low Voltage
• Medium Voltage
• High Voltage
• Other Voltages
Interruptions Covered:
• Air
• Vacuum
• Oil
• Other Interruptions
Regions Covered:
• North America
o US
o Canada
o Mexico
• Europe
o Germany
o UK
o Italy
o France
o Spain
o Rest of Europe
• Asia Pacific
o Japan
o China
o India
o Australia
o New Zealand
o South Korea
o Rest of Asia Pacific
• South America
o Argentina
o Brazil
o Chile
o Rest of South America
• Middle East & Africa
o Saudi Arabia
o UAE
o Qatar
o South Africa
o Rest of Middle East & Africa
What our report offers:
- Market share assessments for the regional and country-level segments
- Strategic recommendations for the new entrants
- Covers Market data for the years 2020, 2021, 2022, 2025, and 2028
- Market Trends (Drivers, Constraints, Opportunities, Threats, Challenges, Investment Opportunities, and recommendations)
- Strategic recommendations in key business segments based on the market estimations
- Competitive landscaping mapping the key common trends
- Company profiling with detailed strategies, financials, and recent developments
- Supply chain trends mapping the latest technological advancements
Free Customization Offerings:
All the customers of this report will be entitled to receive one of the following free customization options:
• Company Profiling
o Comprehensive profiling of additional market players (up to 3)
o SWOT Analysis of key players (up to 3)
• Regional Segmentation
o Market estimations, Forecasts and CAGR of any prominent country as per the client's interest (Note: Depends on feasibility check)
• Competitive Benchmarking
o Benchmarking of key players based on product portfolio, geographical presence, and strategic alliances
Table of Contents
1 Executive Summary
2 Preface
2.1 Abstract
2.2 Stake Holders
2.3 Research Scope
2.4 Research Methodology
2.4.1 Data Mining
2.4.2 Data Analysis
2.4.3 Data Validation
2.4.4 Research Approach
2.5 Research Sources
2.5.1 Primary Research Sources
2.5.2 Secondary Research Sources
2.5.3 Assumptions
3 Market Trend Analysis
3.1 Introduction
3.2 Drivers
3.3 Restraints
3.4 Opportunities
3.5 Threats
3.6 Emerging Markets
3.7 Impact of Covid-19
4 Porters Five Force Analysis
4.1 Bargaining power of suppliers
4.2 Bargaining power of buyers
4.3 Threat of substitutes
4.4 Threat of new entrants
4.5 Competitive rivalry
5 Global Recloser Market, By Phase
5.1 Introduction
5.2 Single Phase
5.3 Three Phase
5.4 Triple Single Phase
5.5 Other Phases
6 Global Recloser Market, By Control
6.1 Introduction
6.2 Hydraulic
6.3 Electric
6.4 Resettable Electronic
6.5 Programmable Resettable
6.6 Other Controls
7 Global Recloser Market, By Voltage
7.1 Introduction
7.2 Low Voltage
7.3 Medium Voltage
7.4 High Voltage
7.5 Other Voltages
8 Global Recloser Market, By Interruption
8.1 Introduction
8.2 Air
8.3 Vacuum
8.4 Oil
8.5 Other Interruptions
9 Global Recloser Market, By Geography
9.1 Introduction
9.2 North America
9.2.1 US
9.2.2 Canada
9.2.3 Mexico
9.3 Europe
9.3.1 Germany
9.3.2 UK
9.3.3 Italy
9.3.4 France
9.3.5 Spain
9.3.6 Rest of Europe
9.4 Asia Pacific
9.4.1 Japan
9.4.2 China
9.4.3 India
9.4.4 Australia
9.4.5 New Zealand
9.4.6 South Korea
9.4.7 Rest of Asia Pacific
9.5 South America
9.5.1 Argentina
9.5.2 Brazil
9.5.3 Chile
9.5.4 Rest of South America
9.6 Middle East & Africa
9.6.1 Saudi Arabia
9.6.2 UAE
9.6.3 Qatar
9.6.4 South Africa
9.6.5 Rest of Middle East & Africa
10 Key Developments
10.1 Agreements, Partnerships, Collaborations and Joint Ventures
10.2 Acquisitions & Mergers
10.3 New Product Launch
10.4 Expansions
10.5 Other Key Strategies
11 Company Profiling
11.1 ABB
11.2 OMICRON
11.3 Siemens
11.4 Solomon Corporation
11.5 Schneider Electric
11.6 Eaton
11.7 Hughes Power System
11.8 Ergon Energy
11.9 Entec Electric and Electronic
11.10 Arteche
11.11 Noja Power
11.10 General Electrics
11.11 Tavrida Electrical Global
11.14 G&W Electric Co.
11.15 Inmarsat
11.16 CPS Energy
11.17 S&C Electric Company
11.18 BRUSH Group
11.19 Iljin Electric.
11.20 Hubbell
List of Tables
1 Global Recloser Market Outlook, By Region (2020-2028) ($MN)
2 Global Recloser Market Outlook, By Phase (2020-2028) ($MN)
3 Global Recloser Market Outlook, By Single Phase (2020-2028) ($MN)
4 Global Recloser Market Outlook, By Three Phase (2020-2028) ($MN)
5 Global Recloser Market Outlook, By Triple Single Phase (2020-2028) ($MN)
6 Global Recloser Market Outlook, By Other Phases (2020-2028) ($MN)
7 Global Recloser Market Outlook, By Control (2020-2028) ($MN)
8 Global Recloser Market Outlook, By Hydraulic (2020-2028) ($MN)
9 Global Recloser Market Outlook, By Electric (2020-2028) ($MN)
10 Global Recloser Market Outlook, By Resettable Electronic (2020-2028) ($MN)
11 Global Recloser Market Outlook, By Programmable Resettable (2020-2028) ($MN)
10 Global Recloser Market Outlook, By Other Controls (2020-2028) ($MN)
13 Global Recloser Market Outlook, By Voltage (2020-2028) ($MN)
14 Global Recloser Market Outlook, By Low Voltage (2020-2028) ($MN)
15 Global Recloser Market Outlook, By Medium Voltage (2020-2028) ($MN)
16 Global Recloser Market Outlook, By High Voltage (2020-2028) ($MN)
17 Global Recloser Market Outlook, By Other Voltages (2020-2028) ($MN)
18 Global Recloser Market Outlook, By Interruption (2020-2028) ($MN)
19 Global Recloser Market Outlook, By Air (2020-2028) ($MN)
20 Global Recloser Market Outlook, By Vacuum (2020-2028) ($MN)
21 Global Recloser Market Outlook, By Oil (2020-2028) ($MN)
22 Global Recloser Market Outlook, By Other Interruptions (2020-2028) ($MN)
23 North America Recloser Market Outlook, By Country (2020-2028) ($MN)
24 North America Recloser Market Outlook, By Phase (2020-2028) ($MN)
25 North America Recloser Market Outlook, By Single Phase (2020-2028) ($MN)
26 North America Recloser Market Outlook, By Three Phase (2020-2028) ($MN)
27 North America Recloser Market Outlook, By Triple Single Phase (2020-2028) ($MN)
28 North America Recloser Market Outlook, By Other Phases (2020-2028) ($MN)
29 North America Recloser Market Outlook, By Control (2020-2028) ($MN)
30 North America Recloser Market Outlook, By Hydraulic (2020-2028) ($MN)
31 North America Recloser Market Outlook, By Electric (2020-2028) ($MN)
32 North America Recloser Market Outlook, By Resettable Electronic (2020-2028) ($MN)
33 North America Recloser Market Outlook, By Programmable Resettable (2020-2028) ($MN)
34 North America Recloser Market Outlook, By Other Controls (2020-2028) ($MN)
35 North America Recloser Market Outlook, By Voltage (2020-2028) ($MN)
36 North America Recloser Market Outlook, By Low Voltage (2020-2028) ($MN)
37 North America Recloser Market Outlook, By Medium Voltage (2020-2028) ($MN)
38 North America Recloser Market Outlook, By High Voltage (2020-2028) ($MN)
39 North America Recloser Market Outlook, By Other Voltages (2020-2028) ($MN)
40 North America Recloser Market Outlook, By Interruption (2020-2028) ($MN)
41 North America Recloser Market Outlook, By Air (2020-2028) ($MN)
42 North America Recloser Market Outlook, By Vacuum (2020-2028) ($MN)
43 North America Recloser Market Outlook, By Oil (2020-2028) ($MN)
44 North America Recloser Market Outlook, By Other Interruptions (2020-2028) ($MN)
45 Europe Recloser Market Outlook, By Country (2020-2028) ($MN)
46 Europe Recloser Market Outlook, By Phase (2020-2028) ($MN)
47 Europe Recloser Market Outlook, By Single Phase (2020-2028) ($MN)
48 Europe Recloser Market Outlook, By Three Phase (2020-2028) ($MN)
49 Europe Recloser Market Outlook, By Triple Single Phase (2020-2028) ($MN)
50 Europe Recloser Market Outlook, By Other Phases (2020-2028) ($MN)
51 Europe Recloser Market Outlook, By Control (2020-2028) ($MN)
52 Europe Recloser Market Outlook, By Hydraulic (2020-2028) ($MN)
53 Europe Recloser Market Outlook, By Electric (2020-2028) ($MN)
54 Europe Recloser Market Outlook, By Resettable Electronic (2020-2028) ($MN)
55 Europe Recloser Market Outlook, By Programmable Resettable (2020-2028) ($MN)
56 Europe Recloser Market Outlook, By Other Controls (2020-2028) ($MN)
57 Europe Recloser Market Outlook, By Voltage (2020-2028) ($MN)
58 Europe Recloser Market Outlook, By Low Voltage (2020-2028) ($MN)
59 Europe Recloser Market Outlook, By Medium Voltage (2020-2028) ($MN)
60 Europe Recloser Market Outlook, By High Voltage (2020-2028) ($MN)
61 Europe Recloser Market Outlook, By Other Voltages (2020-2028) ($MN)
62 Europe Recloser Market Outlook, By Interruption (2020-2028) ($MN)
63 Europe Recloser Market Outlook, By Air (2020-2028) ($MN)
64 Europe Recloser Market Outlook, By Vacuum (2020-2028) ($MN)
65 Europe Recloser Market Outlook, By Oil (2020-2028) ($MN)
66 Europe Recloser Market Outlook, By Other Interruptions (2020-2028) ($MN)
67 Asia Pacific Recloser Market Outlook, By Country (2020-2028) ($MN)
68 Asia Pacific Recloser Market Outlook, By Phase (2020-2028) ($MN)
69 Asia Pacific Recloser Market Outlook, By Single Phase (2020-2028) ($MN)
70 Asia Pacific Recloser Market Outlook, By Three Phase (2020-2028) ($MN)
71 Asia Pacific Recloser Market Outlook, By Triple Single Phase (2020-2028) ($MN)
72 Asia Pacific Recloser Market Outlook, By Other Phases (2020-2028) ($MN)
73 Asia Pacific Recloser Market Outlook, By Control (2020-2028) ($MN)
74 Asia Pacific Recloser Market Outlook, By Hydraulic (2020-2028) ($MN)
75 Asia Pacific Recloser Market Outlook, By Electric (2020-2028) ($MN)
76 Asia Pacific Recloser Market Outlook, By Resettable Electronic (2020-2028) ($MN)
77 Asia Pacific Recloser Market Outlook, By Programmable Resettable (2020-2028) ($MN)
78 Asia Pacific Recloser Market Outlook, By Other Controls (2020-2028) ($MN)
79 Asia Pacific Recloser Market Outlook, By Voltage (2020-2028) ($MN)
80 Asia Pacific Recloser Market Outlook, By Low Voltage (2020-2028) ($MN)
81 Asia Pacific Recloser Market Outlook, By Medium Voltage (2020-2028) ($MN)
82 Asia Pacific Recloser Market Outlook, By High Voltage (2020-2028) ($MN)
83 Asia Pacific Recloser Market Outlook, By Other Voltages (2020-2028) ($MN)
84 Asia Pacific Recloser Market Outlook, By Interruption (2020-2028) ($MN)
85 Asia Pacific Recloser Market Outlook, By Air (2020-2028) ($MN)
86 Asia Pacific Recloser Market Outlook, By Vacuum (2020-2028) ($MN)
87 Asia Pacific Recloser Market Outlook, By Oil (2020-2028) ($MN)
88 Asia Pacific Recloser Market Outlook, By Other Interruptions (2020-2028) ($MN)
89 South America Recloser Market Outlook, By Country (2020-2028) ($MN)
90 South America Recloser Market Outlook, By Phase (2020-2028) ($MN)
91 South America Recloser Market Outlook, By Single Phase (2020-2028) ($MN)
92 South America Recloser Market Outlook, By Three Phase (2020-2028) ($MN)
93 South America Recloser Market Outlook, By Triple Single Phase (2020-2028) ($MN)
94 South America Recloser Market Outlook, By Other Phases (2020-2028) ($MN)
95 South America Recloser Market Outlook, By Control (2020-2028) ($MN)
96 South America Recloser Market Outlook, By Hydraulic (2020-2028) ($MN)
97 South America Recloser Market Outlook, By Electric (2020-2028) ($MN)
98 South America Recloser Market Outlook, By Resettable Electronic (2020-2028) ($MN)
99 South America Recloser Market Outlook, By Programmable Resettable (2020-2028) ($MN)
100 South America Recloser Market Outlook, By Other Controls (2020-2028) ($MN)
101 South America Recloser Market Outlook, By Voltage (2020-2028) ($MN)
102 South America Recloser Market Outlook, By Low Voltage (2020-2028) ($MN)
103 South America Recloser Market Outlook, By Medium Voltage (2020-2028) ($MN)
104 South America Recloser Market Outlook, By High Voltage (2020-2028) ($MN)
105 South America Recloser Market Outlook, By Other Voltages (2020-2028) ($MN)
106 South America Recloser Market Outlook, By Interruption (2020-2028) ($MN)
107 South America Recloser Market Outlook, By Air (2020-2028) ($MN)
108 South America Recloser Market Outlook, By Vacuum (2020-2028) ($MN)
109 South America Recloser Market Outlook, By Oil (2020-2028) ($MN)
110 South America Recloser Market Outlook, By Other Interruptions (2020-2028) ($MN)
111 Middle East & Africa Recloser Market Outlook, By Country (2020-2028) ($MN)
112 Middle East & Africa Recloser Market Outlook, By Phase (2020-2028) ($MN)
113 Middle East & Africa Recloser Market Outlook, By Single Phase (2020-2028) ($MN)
114 Middle East & Africa Recloser Market Outlook, By Three Phase (2020-2028) ($MN)
115 Middle East & Africa Recloser Market Outlook, By Triple Single Phase (2020-2028) ($MN)
116 Middle East & Africa Recloser Market Outlook, By Other Phases (2020-2028) ($MN)
117 Middle East & Africa Recloser Market Outlook, By Control (2020-2028) ($MN)
118 Middle East & Africa Recloser Market Outlook, By Hydraulic (2020-2028) ($MN)
119 Middle East & Africa Recloser Market Outlook, By Electric (2020-2028) ($MN)
120 Middle East & Africa Recloser Market Outlook, By Resettable Electronic (2020-2028) ($MN)
121 Middle East & Africa Recloser Market Outlook, By Programmable Resettable (2020-2028) ($MN)
122 Middle East & Africa Recloser Market Outlook, By Other Controls (2020-2028) ($MN)
123 Middle East & Africa Recloser Market Outlook, By Voltage (2020-2028) ($MN)
124 Middle East & Africa Recloser Market Outlook, By Low Voltage (2020-2028) ($MN)
125 Middle East & Africa Recloser Market Outlook, By Medium Voltage (2020-2028) ($MN)
126 Middle East & Africa Recloser Market Outlook, By High Voltage (2020-2028) ($MN)
127 Middle East & Africa Recloser Market Outlook, By Other Voltages (2020-2028) ($MN)
128 Middle East & Africa Recloser Market Outlook, By Interruption (2020-2028) ($MN)
129 Middle East & Africa Recloser Market Outlook, By Air (2020-2028) ($MN)
130 Middle East & Africa Recloser Market Outlook, By Vacuum (2020-2028) ($MN)
131 Middle East & Africa Recloser Market Outlook, By Oil (2020-2028) ($MN)
132 Middle East & Africa Recloser Market Outlook, By Other Interruptions (2020-2028) ($MN)
List of Figures
RESEARCH METHODOLOGY

We at ‘Stratistics’ opt for an extensive research approach which involves data mining, data validation, and data analysis. The various research sources include in-house repository, secondary research, competitor’s sources, social media research, client internal data, and primary research.
Our team of analysts prefers the most reliable and authenticated data sources in order to perform the comprehensive literature search. With access to most of the authenticated data bases our team highly considers the best mix of information through various sources to obtain extensive and accurate analysis.
Each report takes an average time of a month and a team of 4 industry analysts. The time may vary depending on the scope and data availability of the desired market report. The various parameters used in the market assessment are standardized in order to enhance the data accuracy.
Data Mining
The data is collected from several authenticated, reliable, paid and unpaid sources and is filtered depending on the scope & objective of the research. Our reports repository acts as an added advantage in this procedure. Data gathering from the raw material suppliers, distributors and the manufacturers is performed on a regular basis, this helps in the comprehensive understanding of the products value chain. Apart from the above mentioned sources the data is also collected from the industry consultants to ensure the objective of the study is in the right direction.
Market trends such as technological advancements, regulatory affairs, market dynamics (Drivers, Restraints, Opportunities and Challenges) are obtained from scientific journals, market related national & international associations and organizations.
Data Analysis
From the data that is collected depending on the scope & objective of the research the data is subjected for the analysis. The critical steps that we follow for the data analysis include:
- Product Lifecycle Analysis
- Competitor analysis
- Risk analysis
- Porters Analysis
- PESTEL Analysis
- SWOT Analysis
The data engineering is performed by the core industry experts considering both the Marketing Mix Modeling and the Demand Forecasting. The marketing mix modeling makes use of multiple-regression techniques to predict the optimal mix of marketing variables. Regression factor is based on a number of variables and how they relate to an outcome such as sales or profits.
Data Validation
The data validation is performed by the exhaustive primary research from the expert interviews. This includes telephonic interviews, focus groups, face to face interviews, and questionnaires to validate our research from all aspects. The industry experts we approach come from the leading firms, involved in the supply chain ranging from the suppliers, distributors to the manufacturers and consumers so as to ensure an unbiased analysis.
We are in touch with more than 15,000 industry experts with the right mix of consultants, CEO's, presidents, vice presidents, managers, experts from both supply side and demand side, executives and so on.
The data validation involves the primary research from the industry experts belonging to:
- Leading Companies
- Suppliers & Distributors
- Manufacturers
- Consumers
- Industry/Strategic Consultants
Apart from the data validation the primary research also helps in performing the fill gap research, i.e. providing solutions for the unmet needs of the research which helps in enhancing the reports quality.
For more details about research methodology, kindly write to us at info@strategymrc.com
Frequently Asked Questions
In case of any queries regarding this report, you can contact the customer service by filing the “Inquiry Before Buy” form available on the right hand side. You may also contact us through email: info@strategymrc.com or phone: +1-301-202-5929
Yes, the samples are available for all the published reports. You can request them by filling the “Request Sample” option available in this page.
Yes, you can request a sample with your specific requirements. All the customized samples will be provided as per the requirement with the real data masked.
All our reports are available in Digital PDF format. In case if you require them in any other formats, such as PPT, Excel etc you can submit a request through “Inquiry Before Buy” form available on the right hand side. You may also contact us through email: info@strategymrc.com or phone: +1-301-202-5929
We offer a free 15% customization with every purchase. This requirement can be fulfilled for both pre and post sale. You may send your customization requirements through email at info@strategymrc.com or call us on +1-301-202-5929.
We have 3 different licensing options available in electronic format.
- Single User Licence: Allows one person, typically the buyer, to have access to the ordered product. The ordered product cannot be distributed to anyone else.
- 2-5 User Licence: Allows the ordered product to be shared among a maximum of 5 people within your organisation.
- Corporate License: Allows the product to be shared among all employees of your organisation regardless of their geographical location.
All our reports are typically be emailed to you as an attachment.
To order any available report you need to register on our website. The payment can be made either through CCAvenue or PayPal payments gateways which accept all international cards.
We extend our support to 6 months post sale. A post sale customization is also provided to cover your unmet needs in the report.
Request Customization
We provide a free 15% customization on every purchase. This requirement can be fulfilled for both pre and post sale. You may send your customization requirements through email at info@strategymrc.com or call us on +1-301-202-5929.
Note: This customization is absolutely free until it falls under the 15% bracket. If your requirement exceeds this a feasibility check will be performed. Post that, a quote will be provided along with the timelines.
WHY CHOOSE US ?

Assured Quality
Best in class reports with high standard of research integrity

24X7 Research Support
Continuous support to ensure the best customer experience.

Free Customization
Adding more values to your product of interest.

Safe & Secure Access
Providing a secured environment for all online transactions.

Trusted by 600+ Brands
Serving the most reputed brands across the world.