
Service Delivery Automation
Service Delivery Automation Market Forecasts to 2028 - Global Analysis By Type (IT Process Automation and Business Process Automation), Organization Size (Small Enterprises, Medium Enterprises and Large Enterprises), End User (IT, Telecommunication & Media, BFSI, Hospitality & Transportation, Retail & Consumer Goods, Manufacturing & Logistics, Healthcare & Pharmaceuticals and Other End Users), and By Geography

|
Years Covered |
2020-2028 |
|
Estimated Year Value (2022) |
US $8.21 BN |
|
Projected Year Value (2028) |
US $40.02 BN |
|
CAGR (2022 - 2028) |
30.2% |
|
Regions Covered |
North America, Europe, Asia Pacific, South America, and Middle East & Africa |
|
Countries Covered |
US, Canada, Mexico, Germany, UK, Italy, France, Spain, Japan, China, India, Australia, New Zealand, South Korea, Rest of Asia Pacific, South America, Argentina, Brazil, Chile, Middle East & Africa, Saudi Arabia, UAE, Qatar, and South Africa |
|
Largest Market |
Asia Pacific |
|
Highest Growing Market |
Europe |
According to Stratistics MRC, the Global Service Delivery Automation Market is accounted for $8.21 billion in 2022 and is expected to reach $40.02 billion by 2028 growing at a CAGR of 30.2% during the forecast period. Process automation known as "Service Delivery Automation" deals with customer-facing tasks including creating and tracking tickets, responding to inquiries, resolving requests, etc. By leveraging artificial intelligence technology, service delivery automation automates manual human actions. To obtain the intended results, it is necessary to coordinate a number of corporate functions. Different customer-facing departments are responsible for these business operations. A data flow thus enhances knowledge about the consumer journey. Understanding the advantages and rationale for service delivery automation is so important which are driving the market growth.
According to the National Development and Reform Commission (NDRC), China's investment in the high-tech manufacturing industry grew in the first eight months of 2019. From January 2019 to August 2019, the investment increased by 12% Year-on-Year, quickening 0.9% indicates from that in the January-July period.
Market Dynamics:
Driver:
Adoption of various companies to the service delivery automation
As industries have expanding, automation has become increasingly necessary in order to increase process agility and deliver high-quality services within strict time constraints. As new and improved technologies are integrated into various service delivery automation types, the market will grow as a result of advancements in artificial intelligence. However the demand for business process automation has been increasing due to the growing need to automate generic and industrial specific processes which thereby are propelling the market growth.
Restraint:
Lack of awareness and understanding among the vendors
Vendors need to understand the automation need of organisations to deliver a solution that best fits and meets their business needs. Moreover, the lack of communication between the vendor and the organisation can also lead to consistency in delivering the adequate solution. The high monetary expenses for the initial implementation in developed as well as developing countries. The cost of maintaining and automating the software and scripts are incremental investments that are hindering growth. Furthermore, service delivery automation leads to a reduction in full-time equivalents (FTE) numbers which lead to the consolidation of delivery centers which is further restraining the growth of the service delivery automation market.
Opportunity:
Change in lifestyle patterns
The increased functional benefits of automation solutions for business process automation across many end-user industries, along with the increasing acceptance of a digital workforce. Moreover, by including new capabilities in areas like automation lifecycle management, workload management, credential management, and Citrix automation as well as by including new data APIs, market suppliers improve their services. These improvements are drawing in new sectors of industry that demand more operational and security capabilities are driving the market growth.
Threat:
High training cost
Computerised training increases the efficiency and automation of the employee training process as well as requires lots of time and money for the company to invest. It suggests that some of the duties that were previously carried out manually by a human are now handled by a programme. Usually, it automates tedious and repetitive processes in a very resourceful manner. As a result, the training team has more time to devote to important responsibilities like developing learning objectives, designing courses, and producing high-quality content. This procedure is frequently completed online using a learning management system, which serves as the main automation platform which hampers the market growth.
Covid-19 Impact
The COVID-19 outbreak has had a significant impact on the majority of enterprises, from supermarkets to luxury goods companies. Retailers are closing their physical locations and shifting their service online as a result of the corona virus quarantine and self-isolation. Additionally, since more individuals stay at home, there is a growing need for online ordering and delivery services. Numerous businesses have been complaining that their current delivery services are constrained, and some customers may experience a few day delays in receiving their products. To keep up with the enormous rise in orders and deliveries, some prominent corporations have announced widespread hiring’s which have accelerated the market.
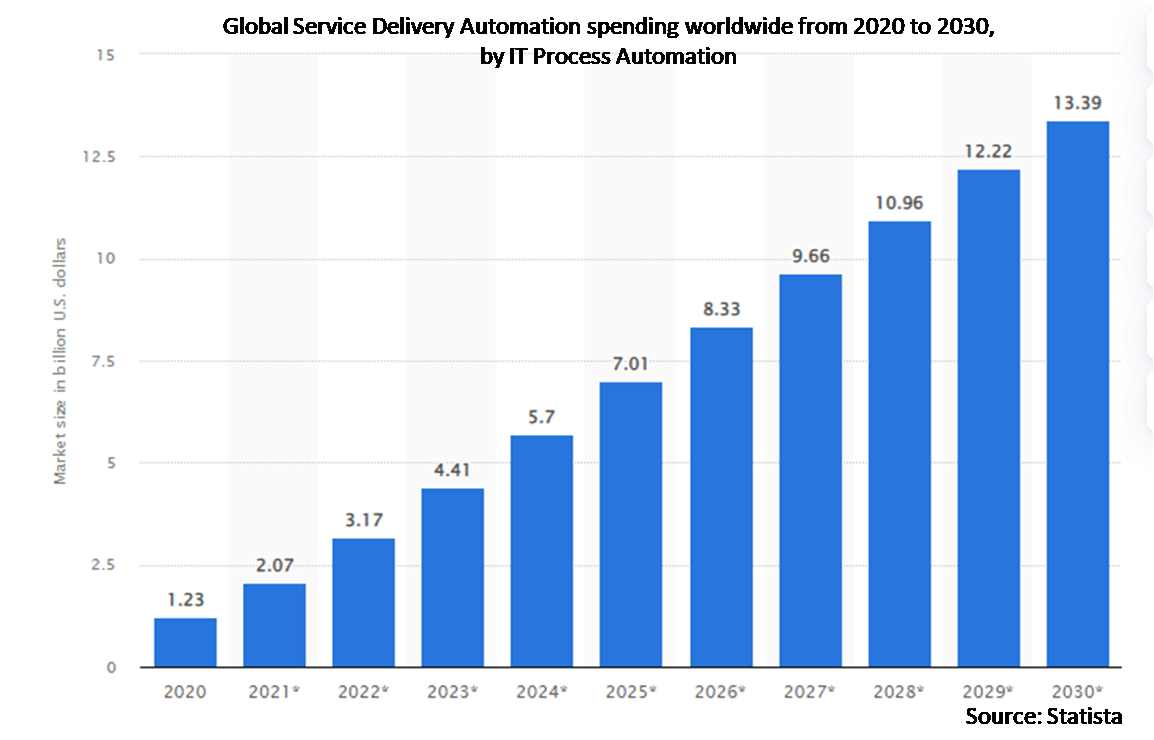
The IT Process Automation segment is expected to be the largest during the forecast period
The IT Process Automation segment is estimated to have a lucrative growth, due to faster processing, which employs software robots to mimic repetitive human movements, can finish several times as many tasks. Additionally, a quicker processing time improves customer satisfaction by reducing the amount of time it takes to react to requests. Additionally, process automation software robots operate around-the-clock, ensuring that some business activities and duties are carried out at all times. They also have the option to defer work until the next day if something requires human intervention, which helps to eliminate the great bulk of human error from processes because they are created to adhere to approved sources. Thus all the above benefits are propelling the market growth.
The BFSI segment is expected to have the highest CAGR during the forecast period
The BFSI segment is anticipated to witness the fastest CAGR growth during the forecast period, due to its higher operational efficiencies which significantly reduce human errors, operational costs, and processing time using bots that work alongside different systems to automate tasks delivering speed and accuracy and enhanced data accuracy which let software bots execute data extraction and entry tasks for hundreds of records in a couple of hours, delivering exceptional accuracy without human intervention. Improved customer experiences in which fast-track deployment of customer self-service options allows free reps to focus on improved customer interactions through which the growth of the service delivery automation market is further grown.
Region with highest share:
Asia Pacific is projected to hold the largest market share during the forecast period owing to the growing acceptance of automation among large- and medium-sized businesses; the Asia-Pacific market is expanding healthily. The industry 4.0 transformation and the expansion of digital technology adaptation are currently threatening the Asian manufacturing sector. In order to hasten the adoption of robots by small- to medium-sized firms, some robot manufacturers are producing leasing models thereby enhancing the market growth.
Region with highest CAGR:
Europe is projected to have the highest CAGR over the forecast period, owing to the implementation of the service delivery automation solutions across varied industries in this region, the It departments as well as the business processing across the enterprises are dramatically changing and adopting various advanced technologies in which the service delivery automation has been gaining popularity in the market in this region which has been boosting the market growth in this region.

Key players in the market
Some of the key players profiled in the Service Delivery Automation Market include Automation Anywhere Inc., IPsoft Inc., Xerox Corporation, NICE Systems Ltd, Uipath SRL, Blue Prism, Celaton Limited, Accenture Inc., AutomationEdge Technologies Inc., Arago GmbH, Exilant Technologies Pvt Ltd, Openspan Pvt Ltd, CA Technologies, International Business Machine Corporation and Sutherland Global Services
Key Developments:
In Jan 2023, Xerox Acquires Advanced UK, UK-based hardware and managed print services provider, and long-standing Xerox Platinum partner. This acquisition allows Xerox to further vertically integrate, continue to strengthen its presence in the UK, and provide continuity to Advanced UK’s customer base.
In Jan 2023, Xerox Announces Entry into Forward Funding Solution with PEAC Solutions to Drive Continued Growth of FITTLE Financing Business, The Forward Funding Agreement primarily covers U.S. direct originations and has an initial term of one-year, with automatic one-year extensions thereafter, unless terminated by either party.
Types Covered:
• IT Process Automation
• Business Process Automation
Organization Sizes Covered:
• Small Enterprises
• Medium Enterprises
• Large Enterprises
End Users Covered:
• IT, Telecommunication & Media
• BFSI
• Hospitality & Transportation
• Retail & Consumer Goods
• Manufacturing & Logistics
• Healthcare & Pharmaceuticals
• Other End Users
Regions Covered:
• North America
o US
o Canada
o Mexico
• Europe
o Germany
o UK
o Italy
o France
o Spain
o Rest of Europe
• Asia Pacific
o Japan
o China
o India
o Australia
o New Zealand
o South Korea
o Rest of Asia Pacific
• South America
o Argentina
o Brazil
o Chile
o Rest of South America
• Middle East & Africa
o Saudi Arabia
o UAE
o Qatar
o South Africa
o Rest of Middle East & Africa
What our report offers:
- Market share assessments for the regional and country-level segments
- Strategic recommendations for the new entrants
- Covers Market data for the years 2020, 2021, 2022, 2025, and 2028
- Market Trends (Drivers, Constraints, Opportunities, Threats, Challenges, Investment Opportunities, and recommendations)
- Strategic recommendations in key business segments based on the market estimations
- Competitive landscaping mapping the key common trends
- Company profiling with detailed strategies, financials, and recent developments
- Supply chain trends mapping the latest technological advancements
Free Customization Offerings:
All the customers of this report will be entitled to receive one of the following free customization options:
• Company Profiling
o Comprehensive profiling of additional market players (up to 3)
o SWOT Analysis of key players (up to 3)
• Regional Segmentation
o Market estimations, Forecasts and CAGR of any prominent country as per the client's interest (Note: Depends on feasibility check)
• Competitive Benchmarking
o Benchmarking of key players based on product portfolio, geographical presence, and strategic alliances
Table of Contents
1 Executive Summary
2 Preface
2.1 Abstract
2.2 Stake Holders
2.3 Research Scope
2.4 Research Methodology
2.4.1 Data Mining
2.4.2 Data Analysis
2.4.3 Data Validation
2.4.4 Research Approach
2.5 Research Sources
2.5.1 Primary Research Sources
2.5.2 Secondary Research Sources
2.5.3 Assumptions
3 Market Trend Analysis
3.1 Introduction
3.2 Drivers
3.3 Restraints
3.4 Opportunities
3.5 Threats
3.6 End User Analysis
3.7 Emerging Markets
3.8 Impact of Covid-19
4 Porters Five Force Analysis
4.1 Bargaining power of suppliers
4.2 Bargaining power of buyers
4.3 Threat of substitutes
4.4 Threat of new entrants
4.5 Competitive rivalry
5 Global Service Delivery Automation Market, By Type
5.1 Introduction
5.2 IT Process Automation
5.3 Business Process Automation
6 Global Service Delivery Automation Market, By Organization Size
6.1 Introduction
6.2 Small Enterprises
6.3 Medium Enterprises
6.4 Large Enterprises
7 Global Service Delivery Automation Market, By End User
7.1 Introduction
7.2 IT, Telecommunication & Media
7.3 BFSI
7.4 Hospitality & Transportation
7.5 Retail & Consumer Goods
7.6 Manufacturing & Logistics
7.7 Healthcare & Pharmaceuticals
7.8 Other End Users
8 Global Service Delivery Automation Market, By Geography
8.1 Introduction
8.2 North America
8.2.1 US
8.2.2 Canada
8.2.3 Mexico
8.3 Europe
8.3.1 Germany
8.3.2 UK
8.3.3 Italy
8.3.4 France
8.3.5 Spain
8.3.6 Rest of Europe
8.4 Asia Pacific
8.4.1 Japan
8.4.2 China
8.4.3 India
8.4.4 Australia
8.4.5 New Zealand
8.4.6 South Korea
8.4.7 Rest of Asia Pacific
8.5 South America
8.5.1 Argentina
8.5.2 Brazil
8.5.3 Chile
8.5.4 Rest of South America
8.6 Middle East & Africa
8.6.1 Saudi Arabia
8.6.2 UAE
8.6.3 Qatar
8.6.4 South Africa
8.6.5 Rest of Middle East & Africa
9 Key Developments
9.1 Agreements, Partnerships, Collaborations and Joint Ventures
9.2 Acquisitions & Mergers
9.3 New Product Launch
9.4 Expansions
9.5 Other Key Strategies
10 Company Profiling
10.1 Automation Anywhere Inc.
10.2 IPsoft Inc.
10.3 Xerox Corporation
10.4 NICE Systems Ltd
10.5 Uipath SRL
10.6 Blue Prism
10.7 Celaton Limited
10.8 Accenture Inc.
10.9 AutomationEdge Technologies Inc.
10.10 Arago GmbH
10.11 Exilant Technologies Pvt Ltd
10.12 Openspan Pvt Ltd
10.13 CA Technologies
10.14 International Business Machine Corporation
10.15 Sutherland Global Services
List of Tables
1 Global Service Delivery Automation Market Outlook, By Region (2020-2028) ($MN)
2 Global Service Delivery Automation Market Outlook, By Type (2020-2028) ($MN)
3 Global Service Delivery Automation Market Outlook, By IT Process Automation (2020-2028) ($MN)
4 Global Service Delivery Automation Market Outlook, By Business Process Automation (2020-2028) ($MN)
5 Global Service Delivery Automation Market Outlook, By Organization Size (2020-2028) ($MN)
6 Global Service Delivery Automation Market Outlook, By Small Enterprises (2020-2028) ($MN)
7 Global Service Delivery Automation Market Outlook, By Medium Enterprises (2020-2028) ($MN)
8 Global Service Delivery Automation Market Outlook, By Large Enterprises (2020-2028) ($MN)
9 Global Service Delivery Automation Market Outlook, By End User (2020-2028) ($MN)
10 Global Service Delivery Automation Market Outlook, By IT, Telecommunication & Media (2020-2028) ($MN)
11 Global Service Delivery Automation Market Outlook, By BFSI (2020-2028) ($MN)
12 Global Service Delivery Automation Market Outlook, By Hospitality & Transportation (2020-2028) ($MN)
13 Global Service Delivery Automation Market Outlook, By Retail & Consumer Goods (2020-2028) ($MN)
14 Global Service Delivery Automation Market Outlook, By Manufacturing & Logistics (2020-2028) ($MN)
15 Global Service Delivery Automation Market Outlook, By Healthcare & Pharmaceuticals (2020-2028) ($MN)
16 Global Service Delivery Automation Market Outlook, By Other End Users (2020-2028) ($MN)
17 North America Service Delivery Automation Market Outlook, By Country (2020-2028) ($MN)
18 North America Service Delivery Automation Market Outlook, By Type (2020-2028) ($MN)
19 North America Service Delivery Automation Market Outlook, By IT Process Automation (2020-2028) ($MN)
20 North America Service Delivery Automation Market Outlook, By Business Process Automation (2020-2028) ($MN)
21 North America Service Delivery Automation Market Outlook, By Organization Size (2020-2028) ($MN)
22 North America Service Delivery Automation Market Outlook, By Small Enterprises (2020-2028) ($MN)
23 North America Service Delivery Automation Market Outlook, By Medium Enterprises (2020-2028) ($MN)
24 North America Service Delivery Automation Market Outlook, By Large Enterprises (2020-2028) ($MN)
25 North America Service Delivery Automation Market Outlook, By End User (2020-2028) ($MN)
26 North America Service Delivery Automation Market Outlook, By IT, Telecommunication & Media (2020-2028) ($MN)
27 North America Service Delivery Automation Market Outlook, By BFSI (2020-2028) ($MN)
28 North America Service Delivery Automation Market Outlook, By Hospitality & Transportation (2020-2028) ($MN)
29 North America Service Delivery Automation Market Outlook, By Retail & Consumer Goods (2020-2028) ($MN)
30 North America Service Delivery Automation Market Outlook, By Manufacturing & Logistics (2020-2028) ($MN)
31 North America Service Delivery Automation Market Outlook, By Healthcare & Pharmaceuticals (2020-2028) ($MN)
32 North America Service Delivery Automation Market Outlook, By Other End Users (2020-2028) ($MN)
33 Europe Service Delivery Automation Market Outlook, By Country (2020-2028) ($MN)
34 Europe Service Delivery Automation Market Outlook, By Type (2020-2028) ($MN)
35 Europe Service Delivery Automation Market Outlook, By IT Process Automation (2020-2028) ($MN)
36 Europe Service Delivery Automation Market Outlook, By Business Process Automation (2020-2028) ($MN)
37 Europe Service Delivery Automation Market Outlook, By Organization Size (2020-2028) ($MN)
38 Europe Service Delivery Automation Market Outlook, By Small Enterprises (2020-2028) ($MN)
39 Europe Service Delivery Automation Market Outlook, By Medium Enterprises (2020-2028) ($MN)
40 Europe Service Delivery Automation Market Outlook, By Large Enterprises (2020-2028) ($MN)
41 Europe Service Delivery Automation Market Outlook, By End User (2020-2028) ($MN)
42 Europe Service Delivery Automation Market Outlook, By IT, Telecommunication & Media (2020-2028) ($MN)
43 Europe Service Delivery Automation Market Outlook, By BFSI (2020-2028) ($MN)
44 Europe Service Delivery Automation Market Outlook, By Hospitality & Transportation (2020-2028) ($MN)
45 Europe Service Delivery Automation Market Outlook, By Retail & Consumer Goods (2020-2028) ($MN)
46 Europe Service Delivery Automation Market Outlook, By Manufacturing & Logistics (2020-2028) ($MN)
47 Europe Service Delivery Automation Market Outlook, By Healthcare & Pharmaceuticals (2020-2028) ($MN)
48 Europe Service Delivery Automation Market Outlook, By Other End Users (2020-2028) ($MN)
49 Asia Pacific Service Delivery Automation Market Outlook, By Country (2020-2028) ($MN)
50 Asia Pacific Service Delivery Automation Market Outlook, By Type (2020-2028) ($MN)
51 Asia Pacific Service Delivery Automation Market Outlook, By IT Process Automation (2020-2028) ($MN)
52 Asia Pacific Service Delivery Automation Market Outlook, By Business Process Automation (2020-2028) ($MN)
53 Asia Pacific Service Delivery Automation Market Outlook, By Organization Size (2020-2028) ($MN)
54 Asia Pacific Service Delivery Automation Market Outlook, By Small Enterprises (2020-2028) ($MN)
55 Asia Pacific Service Delivery Automation Market Outlook, By Medium Enterprises (2020-2028) ($MN)
56 Asia Pacific Service Delivery Automation Market Outlook, By Large Enterprises (2020-2028) ($MN)
57 Asia Pacific Service Delivery Automation Market Outlook, By End User (2020-2028) ($MN)
58 Asia Pacific Service Delivery Automation Market Outlook, By IT, Telecommunication & Media (2020-2028) ($MN)
59 Asia Pacific Service Delivery Automation Market Outlook, By BFSI (2020-2028) ($MN)
60 Asia Pacific Service Delivery Automation Market Outlook, By Hospitality & Transportation (2020-2028) ($MN)
61 Asia Pacific Service Delivery Automation Market Outlook, By Retail & Consumer Goods (2020-2028) ($MN)
62 Asia Pacific Service Delivery Automation Market Outlook, By Manufacturing & Logistics (2020-2028) ($MN)
63 Asia Pacific Service Delivery Automation Market Outlook, By Healthcare & Pharmaceuticals (2020-2028) ($MN)
64 Asia Pacific Service Delivery Automation Market Outlook, By Other End Users (2020-2028) ($MN)
65 South America Service Delivery Automation Market Outlook, By Country (2020-2028) ($MN)
66 South America Service Delivery Automation Market Outlook, By Type (2020-2028) ($MN)
67 South America Service Delivery Automation Market Outlook, By IT Process Automation (2020-2028) ($MN)
68 South America Service Delivery Automation Market Outlook, By Business Process Automation (2020-2028) ($MN)
69 South America Service Delivery Automation Market Outlook, By Organization Size (2020-2028) ($MN)
70 South America Service Delivery Automation Market Outlook, By Small Enterprises (2020-2028) ($MN)
71 South America Service Delivery Automation Market Outlook, By Medium Enterprises (2020-2028) ($MN)
72 South America Service Delivery Automation Market Outlook, By Large Enterprises (2020-2028) ($MN)
73 South America Service Delivery Automation Market Outlook, By End User (2020-2028) ($MN)
74 South America Service Delivery Automation Market Outlook, By IT, Telecommunication & Media (2020-2028) ($MN)
75 South America Service Delivery Automation Market Outlook, By BFSI (2020-2028) ($MN)
76 South America Service Delivery Automation Market Outlook, By Hospitality & Transportation (2020-2028) ($MN)
77 South America Service Delivery Automation Market Outlook, By Retail & Consumer Goods (2020-2028) ($MN)
78 South America Service Delivery Automation Market Outlook, By Manufacturing & Logistics (2020-2028) ($MN)
79 South America Service Delivery Automation Market Outlook, By Healthcare & Pharmaceuticals (2020-2028) ($MN)
80 South America Service Delivery Automation Market Outlook, By Other End Users (2020-2028) ($MN)
81 Middle East & Africa Service Delivery Automation Market Outlook, By Country (2020-2028) ($MN)
82 Middle East & Africa Service Delivery Automation Market Outlook, By Type (2020-2028) ($MN)
83 Middle East & Africa Service Delivery Automation Market Outlook, By IT Process Automation (2020-2028) ($MN)
84 Middle East & Africa Service Delivery Automation Market Outlook, By Business Process Automation (2020-2028) ($MN)
85 Middle East & Africa Service Delivery Automation Market Outlook, By Organization Size (2020-2028) ($MN)
86 Middle East & Africa Service Delivery Automation Market Outlook, By Small Enterprises (2020-2028) ($MN)
87 Middle East & Africa Service Delivery Automation Market Outlook, By Medium Enterprises (2020-2028) ($MN)
88 Middle East & Africa Service Delivery Automation Market Outlook, By Large Enterprises (2020-2028) ($MN)
89 Middle East & Africa Service Delivery Automation Market Outlook, By End User (2020-2028) ($MN)
90 Middle East & Africa Service Delivery Automation Market Outlook, By IT, Telecommunication & Media (2020-2028) ($MN)
91 Middle East & Africa Service Delivery Automation Market Outlook, By BFSI (2020-2028) ($MN)
92 Middle East & Africa Service Delivery Automation Market Outlook, By Hospitality & Transportation (2020-2028) ($MN)
93 Middle East & Africa Service Delivery Automation Market Outlook, By Retail & Consumer Goods (2020-2028) ($MN)
94 Middle East & Africa Service Delivery Automation Market Outlook, By Manufacturing & Logistics (2020-2028) ($MN)
95 Middle East & Africa Service Delivery Automation Market Outlook, By Healthcare & Pharmaceuticals (2020-2028) ($MN)
96 Middle East & Africa Service Delivery Automation Market Outlook, By Other End Users (2020-2028) ($MN)
List of Figures
RESEARCH METHODOLOGY

We at ‘Stratistics’ opt for an extensive research approach which involves data mining, data validation, and data analysis. The various research sources include in-house repository, secondary research, competitor’s sources, social media research, client internal data, and primary research.
Our team of analysts prefers the most reliable and authenticated data sources in order to perform the comprehensive literature search. With access to most of the authenticated data bases our team highly considers the best mix of information through various sources to obtain extensive and accurate analysis.
Each report takes an average time of a month and a team of 4 industry analysts. The time may vary depending on the scope and data availability of the desired market report. The various parameters used in the market assessment are standardized in order to enhance the data accuracy.
Data Mining
The data is collected from several authenticated, reliable, paid and unpaid sources and is filtered depending on the scope & objective of the research. Our reports repository acts as an added advantage in this procedure. Data gathering from the raw material suppliers, distributors and the manufacturers is performed on a regular basis, this helps in the comprehensive understanding of the products value chain. Apart from the above mentioned sources the data is also collected from the industry consultants to ensure the objective of the study is in the right direction.
Market trends such as technological advancements, regulatory affairs, market dynamics (Drivers, Restraints, Opportunities and Challenges) are obtained from scientific journals, market related national & international associations and organizations.
Data Analysis
From the data that is collected depending on the scope & objective of the research the data is subjected for the analysis. The critical steps that we follow for the data analysis include:
- Product Lifecycle Analysis
- Competitor analysis
- Risk analysis
- Porters Analysis
- PESTEL Analysis
- SWOT Analysis
The data engineering is performed by the core industry experts considering both the Marketing Mix Modeling and the Demand Forecasting. The marketing mix modeling makes use of multiple-regression techniques to predict the optimal mix of marketing variables. Regression factor is based on a number of variables and how they relate to an outcome such as sales or profits.
Data Validation
The data validation is performed by the exhaustive primary research from the expert interviews. This includes telephonic interviews, focus groups, face to face interviews, and questionnaires to validate our research from all aspects. The industry experts we approach come from the leading firms, involved in the supply chain ranging from the suppliers, distributors to the manufacturers and consumers so as to ensure an unbiased analysis.
We are in touch with more than 15,000 industry experts with the right mix of consultants, CEO's, presidents, vice presidents, managers, experts from both supply side and demand side, executives and so on.
The data validation involves the primary research from the industry experts belonging to:
- Leading Companies
- Suppliers & Distributors
- Manufacturers
- Consumers
- Industry/Strategic Consultants
Apart from the data validation the primary research also helps in performing the fill gap research, i.e. providing solutions for the unmet needs of the research which helps in enhancing the reports quality.
For more details about research methodology, kindly write to us at info@strategymrc.com
Frequently Asked Questions
In case of any queries regarding this report, you can contact the customer service by filing the “Inquiry Before Buy” form available on the right hand side. You may also contact us through email: info@strategymrc.com or phone: +1-301-202-5929
Yes, the samples are available for all the published reports. You can request them by filling the “Request Sample” option available in this page.
Yes, you can request a sample with your specific requirements. All the customized samples will be provided as per the requirement with the real data masked.
All our reports are available in Digital PDF format. In case if you require them in any other formats, such as PPT, Excel etc you can submit a request through “Inquiry Before Buy” form available on the right hand side. You may also contact us through email: info@strategymrc.com or phone: +1-301-202-5929
We offer a free 15% customization with every purchase. This requirement can be fulfilled for both pre and post sale. You may send your customization requirements through email at info@strategymrc.com or call us on +1-301-202-5929.
We have 3 different licensing options available in electronic format.
- Single User Licence: Allows one person, typically the buyer, to have access to the ordered product. The ordered product cannot be distributed to anyone else.
- 2-5 User Licence: Allows the ordered product to be shared among a maximum of 5 people within your organisation.
- Corporate License: Allows the product to be shared among all employees of your organisation regardless of their geographical location.
All our reports are typically be emailed to you as an attachment.
To order any available report you need to register on our website. The payment can be made either through CCAvenue or PayPal payments gateways which accept all international cards.
We extend our support to 6 months post sale. A post sale customization is also provided to cover your unmet needs in the report.
Request Customization
We provide a free 15% customization on every purchase. This requirement can be fulfilled for both pre and post sale. You may send your customization requirements through email at info@strategymrc.com or call us on +1-301-202-5929.
Note: This customization is absolutely free until it falls under the 15% bracket. If your requirement exceeds this a feasibility check will be performed. Post that, a quote will be provided along with the timelines.
WHY CHOOSE US ?

Assured Quality
Best in class reports with high standard of research integrity

24X7 Research Support
Continuous support to ensure the best customer experience.

Free Customization
Adding more values to your product of interest.

Safe & Secure Access
Providing a secured environment for all online transactions.

Trusted by 600+ Brands
Serving the most reputed brands across the world.