
Smart Retail Market
Smart Retail Market Forecasts to 2030 - Global Analysis By Offering (Hardware, Software and Service), Technology (Robotics, Cloud Computing, Big Data Analytics, Artificial Intelligence, Internet of Things (IoT) and Other Technologies), Application, End User and By Geography

|
Years Covered |
2021-2030 |
|
Estimated Year Value (2023) |
US $42.57 BN |
|
Projected Year Value (2030) |
US $206.42 BN |
|
CAGR (2023 - 2030) |
25.3% |
|
Regions Covered |
North America, Europe, Asia Pacific, South America, and Middle East & Africa |
|
Countries Covered |
US, Canada, Mexico, Germany, UK, Italy, France, Spain, Japan, China, India, Australia, New Zealand, South Korea, Rest of Asia Pacific, South America, Argentina, Brazil, Chile, Middle East & Africa, Saudi Arabia, UAE, Qatar, and South Africa |
|
Largest Market |
North America |
|
Highest Growing Market |
Asia Pacific |
According to Stratistics MRC, the Global Smart Retail Market is accounted for $42.57 billion in 2023 and is expected to reach $206.42 billion by 2030 growing at a CAGR of 25.3% during the forecast period. Smart retail describes a fusion of conventional retail practises with cutting-edge "smart" technologies. Data is gathered through the Internet of Things through a connection between implanted devices and computers. Smart retail shops can recognize the characteristics of their customers to gather demographic information, but they can also keep an eye on their actions inside the store to enhance how they do business. Due to better supply chain management, smart retail is a profitable process for both customers and merchants. Smart retailing enables businesses to monitor consumer input and make improvements to maintain consumer interest.
Market Dynamics:
Driver:
Increasing adoption of RFID technology
Retail brands benefit from better inventory accuracy and stock reliability as a result of RFID, which boosts revenue and consumer happiness. Additionally, it offers precise, real-time information on stock specifics, including volume, models, colours, and sizes, as well as inventory levels. It enables better production control and delivers more detailed management information. For scanning a huge number of things, RFID systems are far more effective. Retailers now consider RFID technology essential since it has the ability to significantly reduce costs and open up new income streams.
Restraint:
Lack of customer trust
Establishing and sustaining long-term connections with the target audience depends on customer trust. After all, it makes it possible for companies to provide better services, foster more customer loyalty, and keep more clients. Without a tangible company with a history and face-to-face interactions between consumers and sales employees, it can be challenging to build a reliable brand identity. The market's expansion is being hampered by the aforementioned issue.
Opportunity:
Growing digitalization
Digitalization has the potential to be very motivating for retail staff. Smart retail stores are expected to benefit from technological advancements, better connection, the introduction of novel sensors, and the availability of seamless communication solutions. Retailers gain from it in the form of more consumers and lower operating expenses. Digital payment methods have grown significantly in recent years, including electronic wallets, debit cards, credit cards, prepaid cards, and other digital platforms. In particular, it is anticipated that the market will grow due to the shifting consumer preference for cashless transactions and the subsequent rise in the adoption of digital payment solutions across retail stores, including specialty shops, supermarkets, and department stores.
Threat:
Risks of data theft
Customer data helps marketing and sales teams to pinpoint the demands of their target market and effectively adjust their messaging and solutions to satisfy those needs. Retailers are dealing with several cybersecurity attacks that now target sensitive personal data as well as credit data. Database security is lacking, which allows for the theft of personal information. Cyberattacks have the power to knock firms out of business and cause severe financial hardship, legal consequences, and reputational harm. Customers' ability to make smart payments is in jeopardy due to this factor, which is impeding the market's expansion.
Covid-19 Impact
Almost every country on the globe had been severely impacted by the COVID-19 epidemic. Production facilities had either entirely shut down or operated at reduced capacity as a result of the lockdown limitations. As a result, businesses found new ways to access their resources, customers, assets, and data. The adoption of smart retail services and solutions was sparked by this pandemic. The epidemic gave retailers the opportunity to accelerate their preparations for digital transformation and modify their customer experiences in order to successfully adapt during these challenging times. Incorporating increasing digitalization and automation into daily operations forced larger organisations to re-evaluate their company strategy, enhance processes, and modify operations which reduced the losses during the pandemic.
The software segment is expected to be the largest during the forecast period
The software segment is estimated to have a lucrative growth, owing to the growing digitization and expanding adoption of analytics tools in the retail industry. Enhanced software implementation facilitates inventory processing, such as redesigning marketing strategies and organizing offers and promotions. Software in smart retail may enhance customer satisfaction and product handling since it automates laborious and time-consuming operations including reporting, inventory management, pricing regulation, recording payroll, billing, and processing returns. Real-time pricing, hassle-free inventory management, and high quality customer service are the driving forces behind this market's need.
The smart payments segment is expected to have the highest CAGR during the forecast period
The smart payments segment is anticipated to witness the fastest CAGR growth during the forecast period. Smart payments are contactless transactions that may be finished in less than 15 seconds and operate twice as quickly as traditional cards. The retailers benefit from its convenience. It lowers processing costs and opens the door to the addition of numerous payment options. They provide a genuinely frictionless experience for customers or business users, simplifying routine or low-value transactions, saving time and effort, and lowering the possibility of low inventory as a result of a postponed purchase. The segment's prominence is being promoted by its simple payments and security.
Region with largest share:
North America is projected to hold the largest market share during the forecast period. There is a significant market in this region for high-end products and luxury goods. The retail sector has been touched by the post-pandemic effect, which has accelerated the digital transformation of enterprises. Customers presently expect less time-consuming and more convenient purchasing experiences. The US economy is being restructured as digital technology is being adopted more widely in all application areas. It also has a lot of supermarkets and other different kinds of retail establishments, such Food City (US) and Schnucks Markets, Inc. (US), which has self-checkout, automatic storage & retrieval, and POS solutions installed in their architecture.
Region with highest CAGR:
Asia Pacific is projected to have the highest CAGR over the forecast period. Major retailing firms like Amazon and Alibaba are present in this region. The important need for retailers to digitalize their current traditional business processes is primarily responsible for a substantial proportion of this region. Cloud computing and mobile technologies are being quickly embraced in the area. Additionally, the government is fostering booming economic growth by permitting foreign investment and pushing businesses to adopt cutting-edge high-tech solutions.

Key players in the market
Some of the key players profiled in the Smart Retail Market include Honeywell International Inc, Intel Corporation, IBM Corporation, Google LLC, Microsoft Corporation, Amazon Inc, Ingenico Group, Huawei Technologies Co Ltd, Cisco Systems, Zebra Technologies Corporation, Unitech Electronics Co., LTD., IEI Integration Corporation, Samsung Electronics, Verifone Systems, NCR Corporation, Motorola Mobility LLC, NXP Semiconductors N.V., PAX Global Technology Limited, Trigo Vision Limited and Zippin.
Key Developments:
In May 2023, Honeywell announced the launch of its Next Generation Cellular Module (NXCM) enabling Advanced Metering Infrastructure (AMI), a groundbreaking solution that upgrades legacy gas and water meters into smart meters without requiring expenditure on additional infrastructure. The NXCM helps utility providers gather data from gas and water meters, improving operational efficiency, reducing costs, and providing customers with accurate usage information.
In September 2022, Microsoft Corporation partnered with Hanshow, a professional digital store solution provider (SP) and Intel Corporation to accelerate “Smart Retail Innovation”. It summarizes changes in the global retail industry and best practices in the retail + AI sector.
In May 2022, Amazon launched Smart Commerce to change local stores into digital dukaans. Stores will now be able to digitise their operations, enhance in-store experience for walk-in customers, and create their own online storefront in minutes powered by Amazon.
Offerings Covered:
• Hardware
• Software
• Service
Technologies Covered:
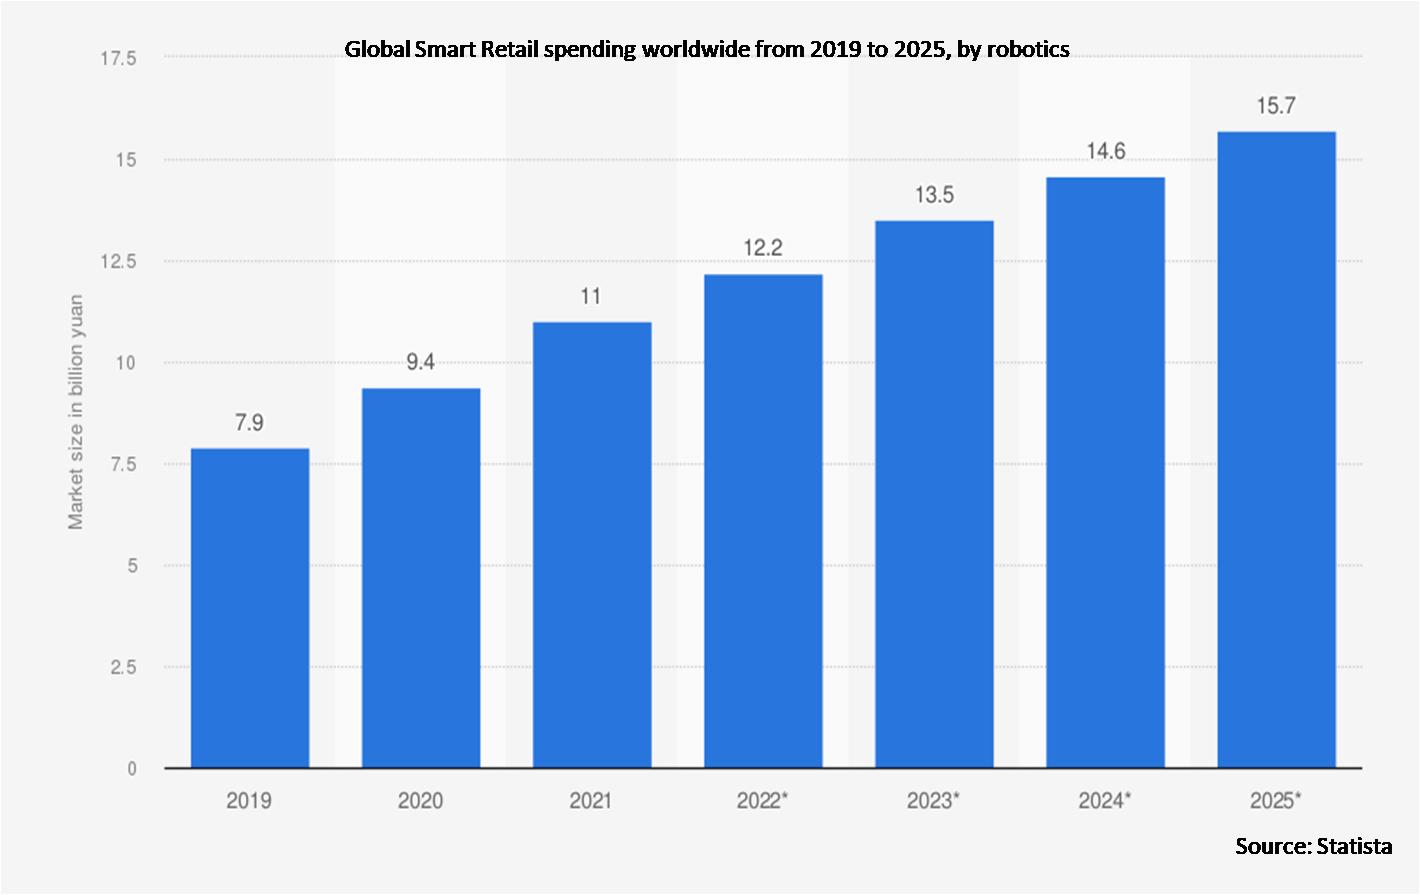
• Robotics
• Cloud Computing
• Big Data Analytics
• Artificial Intelligence
• Internet of Things (IoT)
• Other Technologies
Applications Covered:
• Supply Chain Management
• Store Operations
• Smart Payments
• Customer Experience Management
• Inventory Management
• Other Applications
End Users Covered:
• Supermarkets
• Hypermarkets
• Specialty Stores
• Department Stores
• Other End Users
Regions Covered:
• North America
o US
o Canada
o Mexico
• Europe
o Germany
o UK
o Italy
o France
o Spain
o Rest of Europe
• Asia Pacific
o Japan
o China
o India
o Australia
o New Zealand
o South Korea
o Rest of Asia Pacific
• South America
o Argentina
o Brazil
o Chile
o Rest of South America
• Middle East & Africa
o Saudi Arabia
o UAE
o Qatar
o South Africa
o Rest of Middle East & Africa
What our report offers:
- Market share assessments for the regional and country-level segments
- Strategic recommendations for the new entrants
- Covers Market data for the years 2021, 2022, 2023, 2026, and 2030
- Market Trends (Drivers, Constraints, Opportunities, Threats, Challenges, Investment Opportunities, and recommendations)
- Strategic recommendations in key business segments based on the market estimations
- Competitive landscaping mapping the key common trends
- Company profiling with detailed strategies, financials, and recent developments
- Supply chain trends mapping the latest technological advancements
Free Customization Offerings:
All the customers of this report will be entitled to receive one of the following free customization options:
• Company Profiling
o Comprehensive profiling of additional market players (up to 3)
o SWOT Analysis of key players (up to 3)
• Regional Segmentation
o Market estimations, Forecasts and CAGR of any prominent country as per the client's interest (Note: Depends on feasibility check)
• Competitive Benchmarking
o Benchmarking of key players based on product portfolio, geographical presence, and strategic alliances
Table of Contents
1 Executive Summary
2 Preface
2.1 Abstract
2.2 Stake Holders
2.3 Research Scope
2.4 Research Methodology
2.4.1 Data Mining
2.4.2 Data Analysis
2.4.3 Data Validation
2.4.4 Research Approach
2.5 Research Sources
2.5.1 Primary Research Sources
2.5.2 Secondary Research Sources
2.5.3 Assumptions
3 Market Trend Analysis
3.1 Introduction
3.2 Drivers
3.3 Restraints
3.4 Opportunities
3.5 Threats
3.6 Technology Analysis
3.7 Application Analysis
3.8 End User Analysis
3.9 Emerging Markets
3.10 Impact of Covid-19
4 Porters Five Force Analysis
4.1 Bargaining power of suppliers
4.2 Bargaining power of buyers
4.3 Threat of substitutes
4.4 Threat of new entrants
4.5 Competitive rivalry
5 Global Smart Retail Market, By Offering
5.1 Introduction
5.2 Hardware
5.2.1 Scanners/Readers
5.2.2 RFID Tags & Labels
5.2.3 Point-of-Sale (POS) Terminals
5.2.4 Intelligent Vending Machines
5.2.5 Digital Signage
5.2.6 Mobile Computers
5.3 Software
5.3.1 Business Intelligence
5.3.2 Sales Forecasting
5.3.3 Demand Forecasting
5.3.4 Other Software & Analytics
5.4 Service
5.4.1 Integration & Deployment Services
5.4.2 Support & Maintenance Services
5.4.3 Consulting Services
6 Global Smart Retail Market, By Technology
6.1 Introduction
6.2 Robotics
6.3 Cloud Computing
6.4 Big Data Analytics
6.5 Artificial Intelligence
6.6 Internet of Things (IoT)
6.7 Other Technologies
7 Global Smart Retail Market, By Application
7.1 Introduction
7.2 Supply Chain Management
7.3 Store Operations
7.4 Smart Payments
7.5 Customer Experience Management
7.6 Inventory Management
7.7 Other Applications
8 Global Smart Retail Market, By End User
8.1 Introduction
8.2 Supermarkets
8.3 Hypermarkets
8.4 Specialty Stores
8.5 Department Stores
8.6 Other End Users
9 Global Smart Retail Market, By Geography
9.1 Introduction
9.2 North America
9.2.1 US
9.2.2 Canada
9.2.3 Mexico
9.3 Europe
9.3.1 Germany
9.3.2 UK
9.3.3 Italy
9.3.4 France
9.3.5 Spain
9.3.6 Rest of Europe
9.4 Asia Pacific
9.4.1 Japan
9.4.2 China
9.4.3 India
9.4.4 Australia
9.4.5 New Zealand
9.4.6 South Korea
9.4.7 Rest of Asia Pacific
9.5 South America
9.5.1 Argentina
9.5.2 Brazil
9.5.3 Chile
9.5.4 Rest of South America
9.6 Middle East & Africa
9.6.1 Saudi Arabia
9.6.2 UAE
9.6.3 Qatar
9.6.4 South Africa
9.6.5 Rest of Middle East & Africa
10 Key Developments
10.1 Agreements, Partnerships, Collaborations and Joint Ventures
10.2 Acquisitions & Mergers
10.3 New Product Launch
10.4 Expansions
10.5 Other Key Strategies
11 Company Profiling
11.1 Honeywell International Inc
11.2 Intel Corporation
11.3 IBM Corporation
11.4 Google LLC
11.5 Microsoft Corporation
11.6 Amazon Inc
11.7 Ingenico Group
11.8 Huawei Technologies Co Ltd
11.9 Cisco Systems
11.10 Zebra Technologies Corporation
11.11 Unitech Electronics Co., LTD.
11.12 IEI Integration Corporation
11.13 Samsung Electronics
11.14 Verifone Systems
11.15 NCR Corporation
11.16 Motorola Mobility LLC
11.17 NXP Semiconductors N.V.
11.18 PAX Global Technology Limited
11.19 Trigo Vision Limited
11.20 Zippin
List of Tables
1 Global Smart Retail Market Outlook, By Region (2021-2030) ($MN)
2 Global Smart Retail Market Outlook, By Offering (2021-2030) ($MN)
3 Global Smart Retail Market Outlook, By Hardware (2021-2030) ($MN)
4 Global Smart Retail Market Outlook, By Scanners/Readers (2021-2030) ($MN)
5 Global Smart Retail Market Outlook, By RFID Tags & Labels (2021-2030) ($MN)
6 Global Smart Retail Market Outlook, By Point-of-Sale (POS) Terminals (2021-2030) ($MN)
7 Global Smart Retail Market Outlook, By Intelligent Vending Machines (2021-2030) ($MN)
8 Global Smart Retail Market Outlook, By Digital Signage (2021-2030) ($MN)
9 Global Smart Retail Market Outlook, By Mobile Computers (2021-2030) ($MN)
10 Global Smart Retail Market Outlook, By Software (2021-2030) ($MN)
11 Global Smart Retail Market Outlook, By Business Intelligence (2021-2030) ($MN)
12 Global Smart Retail Market Outlook, By Sales Forecasting (2021-2030) ($MN)
13 Global Smart Retail Market Outlook, By Demand Forecasting (2021-2030) ($MN)
14 Global Smart Retail Market Outlook, By Other Software & Analytics (2021-2030) ($MN)
15 Global Smart Retail Market Outlook, By Service (2021-2030) ($MN)
16 Global Smart Retail Market Outlook, By Integration & Deployment Services (2021-2030) ($MN)
17 Global Smart Retail Market Outlook, By Support & Maintenance Services (2021-2030) ($MN)
18 Global Smart Retail Market Outlook, By Consulting Services (2021-2030) ($MN)
19 Global Smart Retail Market Outlook, By Technology (2021-2030) ($MN)
20 Global Smart Retail Market Outlook, By Robotics (2021-2030) ($MN)
21 Global Smart Retail Market Outlook, By Cloud Computing (2021-2030) ($MN)
22 Global Smart Retail Market Outlook, By Big Data Analytics (2021-2030) ($MN)
23 Global Smart Retail Market Outlook, By Artificial Intelligence (2021-2030) ($MN)
24 Global Smart Retail Market Outlook, By Internet of Things (IoT) (2021-2030) ($MN)
25 Global Smart Retail Market Outlook, By Other Technologies (2021-2030) ($MN)
26 Global Smart Retail Market Outlook, By Application (2021-2030) ($MN)
27 Global Smart Retail Market Outlook, By Supply Chain Management (2021-2030) ($MN)
28 Global Smart Retail Market Outlook, By Store Operations (2021-2030) ($MN)
29 Global Smart Retail Market Outlook, By Smart Payments (2021-2030) ($MN)
30 Global Smart Retail Market Outlook, By Customer Experience Management (2021-2030) ($MN)
31 Global Smart Retail Market Outlook, By Inventory Management (2021-2030) ($MN)
32 Global Smart Retail Market Outlook, By Other Applications (2021-2030) ($MN)
33 Global Smart Retail Market Outlook, By End User (2021-2030) ($MN)
34 Global Smart Retail Market Outlook, By Supermarkets (2021-2030) ($MN)
35 Global Smart Retail Market Outlook, By Hypermarkets (2021-2030) ($MN)
36 Global Smart Retail Market Outlook, By Specialty Stores (2021-2030) ($MN)
37 Global Smart Retail Market Outlook, By Department Stores (2021-2030) ($MN)
38 Global Smart Retail Market Outlook, By Other End Users (2021-2030) ($MN)
Note: Tables for North America, Europe, APAC, South America, and Middle East & Africa Regions are also represented in the same manner as above.
List of Figures
RESEARCH METHODOLOGY

We at ‘Stratistics’ opt for an extensive research approach which involves data mining, data validation, and data analysis. The various research sources include in-house repository, secondary research, competitor’s sources, social media research, client internal data, and primary research.
Our team of analysts prefers the most reliable and authenticated data sources in order to perform the comprehensive literature search. With access to most of the authenticated data bases our team highly considers the best mix of information through various sources to obtain extensive and accurate analysis.
Each report takes an average time of a month and a team of 4 industry analysts. The time may vary depending on the scope and data availability of the desired market report. The various parameters used in the market assessment are standardized in order to enhance the data accuracy.
Data Mining
The data is collected from several authenticated, reliable, paid and unpaid sources and is filtered depending on the scope & objective of the research. Our reports repository acts as an added advantage in this procedure. Data gathering from the raw material suppliers, distributors and the manufacturers is performed on a regular basis, this helps in the comprehensive understanding of the products value chain. Apart from the above mentioned sources the data is also collected from the industry consultants to ensure the objective of the study is in the right direction.
Market trends such as technological advancements, regulatory affairs, market dynamics (Drivers, Restraints, Opportunities and Challenges) are obtained from scientific journals, market related national & international associations and organizations.
Data Analysis
From the data that is collected depending on the scope & objective of the research the data is subjected for the analysis. The critical steps that we follow for the data analysis include:
- Product Lifecycle Analysis
- Competitor analysis
- Risk analysis
- Porters Analysis
- PESTEL Analysis
- SWOT Analysis
The data engineering is performed by the core industry experts considering both the Marketing Mix Modeling and the Demand Forecasting. The marketing mix modeling makes use of multiple-regression techniques to predict the optimal mix of marketing variables. Regression factor is based on a number of variables and how they relate to an outcome such as sales or profits.
Data Validation
The data validation is performed by the exhaustive primary research from the expert interviews. This includes telephonic interviews, focus groups, face to face interviews, and questionnaires to validate our research from all aspects. The industry experts we approach come from the leading firms, involved in the supply chain ranging from the suppliers, distributors to the manufacturers and consumers so as to ensure an unbiased analysis.
We are in touch with more than 15,000 industry experts with the right mix of consultants, CEO's, presidents, vice presidents, managers, experts from both supply side and demand side, executives and so on.
The data validation involves the primary research from the industry experts belonging to:
- Leading Companies
- Suppliers & Distributors
- Manufacturers
- Consumers
- Industry/Strategic Consultants
Apart from the data validation the primary research also helps in performing the fill gap research, i.e. providing solutions for the unmet needs of the research which helps in enhancing the reports quality.
For more details about research methodology, kindly write to us at info@strategymrc.com
Frequently Asked Questions
In case of any queries regarding this report, you can contact the customer service by filing the “Inquiry Before Buy” form available on the right hand side. You may also contact us through email: info@strategymrc.com or phone: +1-301-202-5929
Yes, the samples are available for all the published reports. You can request them by filling the “Request Sample” option available in this page.
Yes, you can request a sample with your specific requirements. All the customized samples will be provided as per the requirement with the real data masked.
All our reports are available in Digital PDF format. In case if you require them in any other formats, such as PPT, Excel etc you can submit a request through “Inquiry Before Buy” form available on the right hand side. You may also contact us through email: info@strategymrc.com or phone: +1-301-202-5929
We offer a free 15% customization with every purchase. This requirement can be fulfilled for both pre and post sale. You may send your customization requirements through email at info@strategymrc.com or call us on +1-301-202-5929.
We have 3 different licensing options available in electronic format.
- Single User Licence: Allows one person, typically the buyer, to have access to the ordered product. The ordered product cannot be distributed to anyone else.
- 2-5 User Licence: Allows the ordered product to be shared among a maximum of 5 people within your organisation.
- Corporate License: Allows the product to be shared among all employees of your organisation regardless of their geographical location.
All our reports are typically be emailed to you as an attachment.
To order any available report you need to register on our website. The payment can be made either through CCAvenue or PayPal payments gateways which accept all international cards.
We extend our support to 6 months post sale. A post sale customization is also provided to cover your unmet needs in the report.
Request Customization
We provide a free 15% customization on every purchase. This requirement can be fulfilled for both pre and post sale. You may send your customization requirements through email at info@strategymrc.com or call us on +1-301-202-5929.
Note: This customization is absolutely free until it falls under the 15% bracket. If your requirement exceeds this a feasibility check will be performed. Post that, a quote will be provided along with the timelines.
WHY CHOOSE US ?

Assured Quality
Best in class reports with high standard of research integrity

24X7 Research Support
Continuous support to ensure the best customer experience.

Free Customization
Adding more values to your product of interest.

Safe & Secure Access
Providing a secured environment for all online transactions.

Trusted by 600+ Brands
Serving the most reputed brands across the world.