
Switchgear Monitoring System Market
Switchgear Monitoring System - Global Market Outlook (2019-2027)
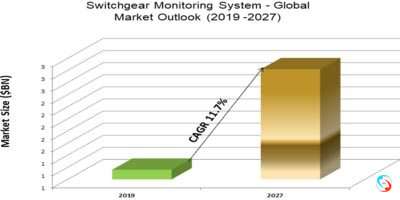
According to Stratistics MRC, The Global Switchgear Monitoring System Market is accounted for $1.16 billion in 2019 and is expected to reach $2.82 billion by 2027 growing at a CAGR of 11.7% during the forecast period. Demand for safe and secure electrical distribution systems and demand for continuous monitoring of switchgears are the major factors driving the market growth. However, high cost of monitoring devices and stringent environmental and safety regulations for SF6 switchgears are restraining the market growth. Moreover, growth of data centers may provide ample opportunities for market growth.
Switchgear Monitoring System or Switchgear Condition Monitoring system is a set of equipment used to keep a track of condition of switchgears and detect any defects in switchgears to prohibit possible failure of switchgear system which may cause unwanted power outages. Switch gear monitoring system is basically comprised of components such as partial discharge sensors, instruments and diagnostic software to observe the condition and current working switchgears in order to schedule the maintenance power cuts and plan the proper preventive measures required to be executed to avoid failure of switchgear system.
Based on switchgear type, the gas insulated substation (GIS) segment is likely to have a huge demand as they are mainly used in industrial areas to fulfill high-energy demands through a space-saving design of minimum cost. GIS are deployed in various industries, serving different needs at varying voltage levels. By geography, Asia Pacific is going to have a lucrative growth during the forecast period. Countries such as China and India are undertaking a lot of smart grid and substation projects to fulfill the growing demand for energy. This would drive the switchgear monitoring system market in the region Energy Research Reports.
Some of the key players profiled in the Switchgear Monitoring System Market include ABB, Eaton, Emerson, Fortive, Fuji Electric Co Ltd, General Electric, Independent Power Engineering Consultants, Koncar – Electrical Engineering Institute Inc, Mitsubishi Electric Corporation, Pacific Microsystems, Qualitrol Company LLC, Schneider Electric, Senseor, Siemens AG, Tiara Vibrasindo Pratama, and Trafag.
Voltages Covered:
• Medium Voltage
• High Voltage
Switchgear Types Covered:
• Gas Insulated Substation (GIS)
• Air Insulated Substation (AIS)
Monitoring Types Covered:
• Temperature Monitoring
• Partial Discharge (PD) Monitoring System
• Online Monitoring System
• Other Monitoring Types
Components Covered:
• Software & Services
• Hardware
End Users Covered:
• Energy and Utilities
• Industries
• Commercial Centers
• Family Entertainment Centers and Movie Theaters
• Residential Buildings
• Hotels
• Manufacturing
• Banking, Financial Services, and Insurance (BFSI)
• Information Technology and Telecommunications
• Transportation
• Other End Users
Regions Covered:
• North America
o US
o Canada
o Mexico
• Europe
o Germany
o UK
o Italy
o France
o Spain
o Rest of Europe
• Asia Pacific
o Japan
o China
o India
o Australia
o New Zealand
o South Korea
o Rest of Asia Pacific
• South America
o Argentina
o Brazil
o Chile
o Rest of South America
• Middle East & Africa
o Saudi Arabia
o UAE
o Qatar
o South Africa
o Rest of Middle East & Africa
What our report offers:
- Market share assessments for the regional and country-level segments
- Strategic recommendations for the new entrants
- Covers Market data for the years 2018, 2019, 2020, 2024 and 2027
- Market Trends (Drivers, Constraints, Opportunities, Threats, Challenges, Investment Opportunities, and recommendations)
- Strategic analysis: Drivers and Constraints, Product/Technology Analysis, Porter’s five forces analysis, SWOT analysis, etc.
- Strategic recommendations in key business segments based on the market estimations
- Competitive landscaping mapping the key common trends
- Company profiling with detailed strategies, financials, and recent developments
- Supply chain trends mapping the latest technological advancements
Free Customization Offerings:
All the customers of this report will be entitled to receive one of the following free customization options:
• Company Profiling
o Comprehensive profiling of additional market players (up to 3)
o SWOT Analysis of key players (up to 3)
• Regional Segmentation
o Market estimations, Forecasts and CAGR of any prominent country as per the client's interest (Note: Depends on feasibility check)
• Competitive Benchmarking
Benchmarking of key players based on product portfolio, geographical presence, and strategic alliances
Table of Contents
1 Executive Summary
2 Preface
2.1 Abstract
2.2 Stake Holders
2.3 Research Scope
2.4 Research Methodology
2.4.1 Data Mining
2.4.2 Data Analysis
2.4.3 Data Validation
2.4.4 Research Approach
2.5 Research Sources
2.5.1 Primary Research Sources
2.5.2 Secondary Research Sources
2.5.3 Assumptions
3 Market Trend Analysis
3.1 Introduction
3.2 Drivers
3.3 Restraints
3.4 Opportunities
3.5 Threats
3.6 End User Analysis
3.7 Emerging Markets
3.8 Impact of Covid-19
4 Porters Five Force Analysis
4.1 Bargaining power of suppliers
4.2 Bargaining power of buyers
4.3 Threat of substitutes
4.4 Threat of new entrants
4.5 Competitive rivalry
5 Global Switchgear Monitoring System Market, By Voltage
5.1 Introduction
5.2 Medium Voltage
5.3 High Voltage
6 Global Switchgear Monitoring System Market, By Switchgear Type
6.1 Introduction
6.2 Gas Insulated Substation (GIS)
6.3 Air Insulated Substation (AIS)
7 Global Switchgear Monitoring System Market, By Monitoring Type
7.1 Introduction
7.2 Temperature Monitoring
7.3 Partial Discharge (PD) Monitoring System
7.4 Online Monitoring System
7.5 Other Monitoring Types
7.5.1 SF6 Gas Monitoring
7.5.2 Humidity Monitoring
7.5.3 Load Monitoring
7.5.4 Faults Monitoring
8 Global Switchgear Monitoring System Market, By Component
8.1 Introduction
8.2 Software & Services
8.3 Hardware
8.3.1 Distribution Network Feeders
8.3.2 Intelligent Electronic Device (IED)
8.3.2.1 Relay Devices
8.3.2.2 Recloser Controllers
8.3.2.3 Circuit Breakers
8.3.2.4 Switches
9 Global Switchgear Monitoring System Market, By End User
9.1 Introduction
9.2 Energy and Utilities
9.3 Industries
9.4 Commercial Centers
9.5 Family Entertainment Centers and Movie Theaters
9.6 Residential Buildings
9.7 Hotels
9.8 Manufacturing
9.9 Banking, Financial Services, and Insurance (BFSI)
9.10 Information Technology and Telecommunications
9.11 Transportation
9.11.1 Airport
9.11.2 Railway Stations
9.12 Other End Users
9.12.1 Marine
9.12.2 Offshore Application
9.12.3 Government
9.12.4 Travel and Hospitality
9.12.5 Food & Beverage
10 Global Switchgear Monitoring System Market, By Geography
10.1 Introduction
10.2 North America
10.2.1 US
10.2.2 Canada
10.2.3 Mexico
10.3 Europe
10.3.1 Germany
10.3.2 UK
10.3.3 Italy
10.3.4 France
10.3.5 Spain
10.3.6 Rest of Europe
10.4 Asia Pacific
10.4.1 Japan
10.4.2 China
10.4.3 India
10.4.4 Australia
10.4.5 New Zealand
10.4.6 South Korea
10.4.7 Rest of Asia Pacific
10.5 South America
10.5.1 Argentina
10.5.2 Brazil
10.5.3 Chile
10.5.4 Rest of South America
10.6 Middle East & Africa
10.6.1 Saudi Arabia
10.6.2 UAE
10.6.3 Qatar
10.6.4 South Africa
10.6.5 Rest of Middle East & Africa
11 Key Developments
11.1 Agreements, Partnerships, Collaborations and Joint Ventures
11.2 Acquisitions & Mergers
11.3 New Product Launch
11.4 Expansions
11.5 Other Key Strategies
12 Company Profiling
12.1 ABB
12.2 Eaton
12.3 Emerson
12.4 Fortive
12.5 Fuji Electric Co Ltd
12.6 General Electric
12.7 Independent Power Engineering Consultants
12.8 Koncar – Electrical Engineering Institute Inc
12.9 Mitsubishi Electric Corporation
12.10 Pacific Microsystems
12.11 Qualitrol Company LLC
12.12 Schneider Electric
12.13 Senseor
12.14 Siemens AG
12.15 Tiara Vibrasindo Pratama
12.16 Trafag
List of Tables
1 Global Switchgear Monitoring System Market Outlook, By Region (2018-2027) ($MN)
2 Global Switchgear Monitoring System Market Outlook, By Voltage (2018-2027) ($MN)
3 Global Switchgear Monitoring System Market Outlook, By Medium Voltage (2018-2027) ($MN)
4 Global Switchgear Monitoring System Market Outlook, By High Voltage (2018-2027) ($MN)
5 Global Switchgear Monitoring System Market Outlook, By Switchgear Type (2018-2027) ($MN)
6 Global Switchgear Monitoring System Market Outlook, By Gas Insulated Substation (GIS) (2018-2027) ($MN)
7 Global Switchgear Monitoring System Market Outlook, By Air Insulated Substation (AIS) (2018-2027) ($MN)
8 Global Switchgear Monitoring System Market Outlook, By Monitoring Type (2018-2027) ($MN)
9 Global Switchgear Monitoring System Market Outlook, By Temperature Monitoring (2018-2027) ($MN)
10 Global Switchgear Monitoring System Market Outlook, By Partial Discharge (PD) Monitoring System (2018-2027) ($MN)
11 Global Switchgear Monitoring System Market Outlook, By Online Monitoring System (2018-2027) ($MN)
12 Global Switchgear Monitoring System Market Outlook, By Other Monitoring Types (2018-2027) ($MN)
13 Global Switchgear Monitoring System Market Outlook, By SF6 Gas Monitoring (2018-2027) ($MN)
14 Global Switchgear Monitoring System Market Outlook, By Humidity Monitoring (2018-2027) ($MN)
15 Global Switchgear Monitoring System Market Outlook, By Load Monitoring (2018-2027) ($MN)
16 Global Switchgear Monitoring System Market Outlook, By Faults Monitoring (2018-2027) ($MN)
17 Global Switchgear Monitoring System Market Outlook, By Component (2018-2027) ($MN)
18 Global Switchgear Monitoring System Market Outlook, By Software & Services (2018-2027) ($MN)
19 Global Switchgear Monitoring System Market Outlook, By Hardware (2018-2027) ($MN)
20 Global Switchgear Monitoring System Market Outlook, By Distribution Network Feeders (2018-2027) ($MN)
21 Global Switchgear Monitoring System Market Outlook, By Intelligent Electronic Device (IED) (2018-2027) ($MN)
22 Global Switchgear Monitoring System Market Outlook, By End User (2018-2027) ($MN)
23 Global Switchgear Monitoring System Market Outlook, By Energy and Utilities (2018-2027) ($MN)
24 Global Switchgear Monitoring System Market Outlook, By Industries (2018-2027) ($MN)
25 Global Switchgear Monitoring System Market Outlook, By Commercial Centers (2018-2027) ($MN)
26 Global Switchgear Monitoring System Market Outlook, By Family Entertainment Centers and Movie Theaters (2018-2027) ($MN)
27 Global Switchgear Monitoring System Market Outlook, By Residential Buildings (2018-2027) ($MN)
28 Global Switchgear Monitoring System Market Outlook, By Hotels (2018-2027) ($MN)
29 Global Switchgear Monitoring System Market Outlook, By Manufacturing (2018-2027) ($MN)
30 Global Switchgear Monitoring System Market Outlook, By Banking, Financial Services, and Insurance (BFSI) (2018-2027) ($MN)
31 Global Switchgear Monitoring System Market Outlook, By Information Technology and Telecommunications (2018-2027) ($MN)
32 Global Switchgear Monitoring System Market Outlook, By Transportation (2018-2027) ($MN)
33 Global Switchgear Monitoring System Market Outlook, By Airport (2018-2027) ($MN)
34 Global Switchgear Monitoring System Market Outlook, By Railway Stations (2018-2027) ($MN)
35 Global Switchgear Monitoring System Market Outlook, By Other End Users (2018-2027) ($MN)
36 Global Switchgear Monitoring System Market Outlook, By Marine (2018-2027) ($MN)
37 Global Switchgear Monitoring System Market Outlook, By Offshore Application (2018-2027) ($MN)
38 Global Switchgear Monitoring System Market Outlook, By Government (2018-2027) ($MN)
39 Global Switchgear Monitoring System Market Outlook, By Travel and Hospitality (2018-2027) ($MN)
40 Global Switchgear Monitoring System Market Outlook, By Food & Beverage (2018-2027) ($MN)
Note: Tables for North America, Europe, APAC, South America, and Middle East & Africa Regions are also represented in the same manner as above.
List of Figures
RESEARCH METHODOLOGY

We at ‘Stratistics’ opt for an extensive research approach which involves data mining, data validation, and data analysis. The various research sources include in-house repository, secondary research, competitor’s sources, social media research, client internal data, and primary research.
Our team of analysts prefers the most reliable and authenticated data sources in order to perform the comprehensive literature search. With access to most of the authenticated data bases our team highly considers the best mix of information through various sources to obtain extensive and accurate analysis.
Each report takes an average time of a month and a team of 4 industry analysts. The time may vary depending on the scope and data availability of the desired market report. The various parameters used in the market assessment are standardized in order to enhance the data accuracy.
Data Mining
The data is collected from several authenticated, reliable, paid and unpaid sources and is filtered depending on the scope & objective of the research. Our reports repository acts as an added advantage in this procedure. Data gathering from the raw material suppliers, distributors and the manufacturers is performed on a regular basis, this helps in the comprehensive understanding of the products value chain. Apart from the above mentioned sources the data is also collected from the industry consultants to ensure the objective of the study is in the right direction.
Market trends such as technological advancements, regulatory affairs, market dynamics (Drivers, Restraints, Opportunities and Challenges) are obtained from scientific journals, market related national & international associations and organizations.
Data Analysis
From the data that is collected depending on the scope & objective of the research the data is subjected for the analysis. The critical steps that we follow for the data analysis include:
- Product Lifecycle Analysis
- Competitor analysis
- Risk analysis
- Porters Analysis
- PESTEL Analysis
- SWOT Analysis
The data engineering is performed by the core industry experts considering both the Marketing Mix Modeling and the Demand Forecasting. The marketing mix modeling makes use of multiple-regression techniques to predict the optimal mix of marketing variables. Regression factor is based on a number of variables and how they relate to an outcome such as sales or profits.
Data Validation
The data validation is performed by the exhaustive primary research from the expert interviews. This includes telephonic interviews, focus groups, face to face interviews, and questionnaires to validate our research from all aspects. The industry experts we approach come from the leading firms, involved in the supply chain ranging from the suppliers, distributors to the manufacturers and consumers so as to ensure an unbiased analysis.
We are in touch with more than 15,000 industry experts with the right mix of consultants, CEO's, presidents, vice presidents, managers, experts from both supply side and demand side, executives and so on.
The data validation involves the primary research from the industry experts belonging to:
- Leading Companies
- Suppliers & Distributors
- Manufacturers
- Consumers
- Industry/Strategic Consultants
Apart from the data validation the primary research also helps in performing the fill gap research, i.e. providing solutions for the unmet needs of the research which helps in enhancing the reports quality.
For more details about research methodology, kindly write to us at info@strategymrc.com
Frequently Asked Questions
In case of any queries regarding this report, you can contact the customer service by filing the “Inquiry Before Buy” form available on the right hand side. You may also contact us through email: info@strategymrc.com or phone: +1-301-202-5929
Yes, the samples are available for all the published reports. You can request them by filling the “Request Sample” option available in this page.
Yes, you can request a sample with your specific requirements. All the customized samples will be provided as per the requirement with the real data masked.
All our reports are available in Digital PDF format. In case if you require them in any other formats, such as PPT, Excel etc you can submit a request through “Inquiry Before Buy” form available on the right hand side. You may also contact us through email: info@strategymrc.com or phone: +1-301-202-5929
We offer a free 15% customization with every purchase. This requirement can be fulfilled for both pre and post sale. You may send your customization requirements through email at info@strategymrc.com or call us on +1-301-202-5929.
We have 3 different licensing options available in electronic format.
- Single User Licence: Allows one person, typically the buyer, to have access to the ordered product. The ordered product cannot be distributed to anyone else.
- 2-5 User Licence: Allows the ordered product to be shared among a maximum of 5 people within your organisation.
- Corporate License: Allows the product to be shared among all employees of your organisation regardless of their geographical location.
All our reports are typically be emailed to you as an attachment.
To order any available report you need to register on our website. The payment can be made either through CCAvenue or PayPal payments gateways which accept all international cards.
We extend our support to 6 months post sale. A post sale customization is also provided to cover your unmet needs in the report.
Request Customization
We provide a free 15% customization on every purchase. This requirement can be fulfilled for both pre and post sale. You may send your customization requirements through email at info@strategymrc.com or call us on +1-301-202-5929.
Note: This customization is absolutely free until it falls under the 15% bracket. If your requirement exceeds this a feasibility check will be performed. Post that, a quote will be provided along with the timelines.
WHY CHOOSE US ?

Assured Quality
Best in class reports with high standard of research integrity

24X7 Research Support
Continuous support to ensure the best customer experience.

Free Customization
Adding more values to your product of interest.

Safe & Secure Access
Providing a secured environment for all online transactions.

Trusted by 600+ Brands
Serving the most reputed brands across the world.