
Server Operating System Market
Server Operating System Market Forecasts to 2028 - Global Analysis By Component (UNIX, Linux, Windows and Other Products), Deployment Model, Virtualization Status, Component, End User and By Geography

|
Years Covered |
2020-2028 |
|
Estimated Year Value (2022) |
US $17.3 BN |
|
Projected Year Value (2028) |
US $37.8 BN |
|
CAGR (2022 - 2028) |
13.9% |
|
Regions Covered |
North America, Europe, Asia Pacific, South America, and Middle East & Africa |
|
Countries Covered |
US, Canada, Mexico, Germany, UK, Italy, France, Spain, Japan, China, India, Australia, New Zealand, South Korea, Rest of Asia Pacific, South America, Argentina, Brazil, Chile, Middle East & Africa, Saudi Arabia, UAE, Qatar, and South Africa |
|
Largest Market |
Asia Pacific |
|
Highest Growing Market |
North America |
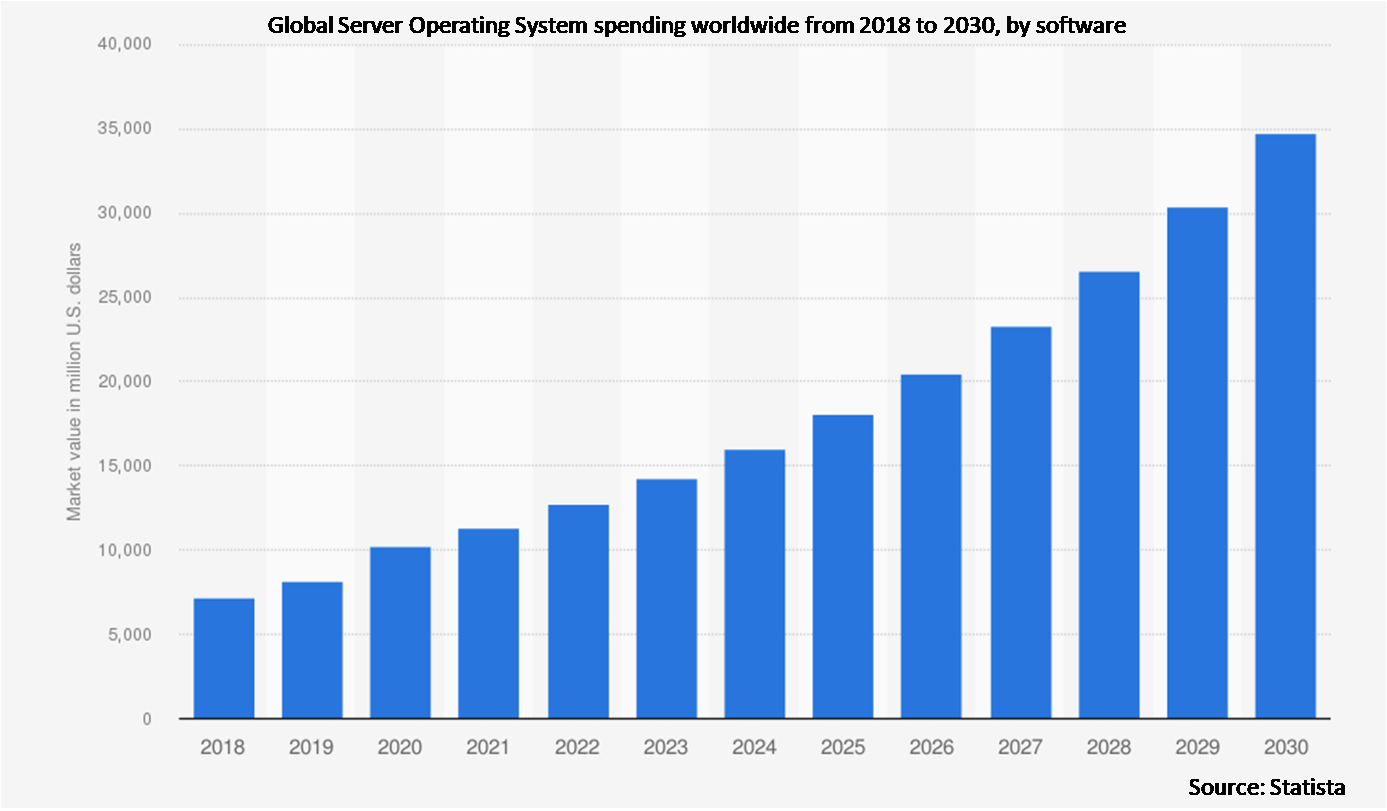
According to Stratistics MRC, the Global Server Operating System Market is accounted for $17.3 billion in 2022 and is expected to reach $37.8 billion by 2028 growing at a CAGR of 13.9% during the forecast period. The client-server infrastructure or a corresponding enterprise computing environment requires the characteristics and capabilities found in the server operating system (OS), a cutting-edge version of an operating system. The platform has a cutting-edge combination of hardware, software, and configuration management services in addition to a centralised interface to combine security and other essential administrative tasks.
According to a Forbes survey, in 2020, enterprises across the world invested around USD 12 million annually on cloud services. According to the IDC predictions, more than 40% of enterprise applications will be deployed on cloud infrastructure by 2024.
Market Dynamics:
Driver:
Growing adoption of hybrid cloud environment
A significant demand for computing has been generated by the rapid growth in the adoption of cloud-based solutions. The development of IoT and big data technologies, among other causes, are the main drivers of this necessity. Additionally, businesses trust cloud technology for a variety of reasons, including enhanced customer service, increased flexibility, and increased speed. Thus, a number of advantages associated with cloud computing are anticipated to create new opportunities for market growth.
Restraint:
High Server Downtime
When employing server resources, this is one of the greatest issues that businesses and clients encounter. Websites fall offline when the server is experiencing downtime. Both software and hardware failure can result in server downtime. They might also occur as a result of hacking attempts. Attacks that cause denial of service are quite common. Therefore, this aspect restrains the market's ability to grow.
Opportunity:
Increase in spending on data center infrastructure
Data centres must become an essential component of modern computer infrastructures used by businesses worldwide. The need for data centre and server operating systems is being fuelled by the rapid expansion of data centres and their applications in a wide range of sectors. The networking of the data centre infrastructure, which ultimately fuels market growth, depends heavily on the necessity for a server operating system.
Threat:
Cybersecurity concerns
Unintentional human mistake can result in outages, for example when a worker with unlimited network access takes a step that causes a device to reboot or fail, unintentionally affecting the entire system. Sometimes the manufacturer is to blame for a security issue. Organisations should also install secondary network protection measures, such as techniques for detecting malicious traffic. This is the main issue impeding the market's expansion.
Covid-19 Impact
The server operating system industry has shown rapid expansion in recent years, however due to the COVID-19 pandemic's outbreak, the market is expected to experience a temporary decline. This is due to the enactment of lockdown by government authorities in a number of nations and the worldwide suspension of trade and travel in an effort to stop the spread of the virus. To support businesses in their work culture of manufacturing and innovation on server operating systems in these vital times, several organisations have added new strategies like business growth and new product releases.
The cloud segment is expected to be the largest during the forecast period
The cloud segment is estimated to have a lucrative growth, due to the rising operating systems used in the cloud are lower costs and significantly less maintenance. The server operating system also provides the data centre with a number of capabilities, such as a central interface for managing many users, implementing security measures, and performing other administrative tasks. Lower expenses and simple maintenance are the key advantages of adopting the cloud for operating systems.
The linux segment is expected to have the highest CAGR during the forecast period
The linux segment is anticipated to witness the fastest CAGR growth during the forecast period, due to the advantages such as open source, accessibility, truthful performance, compatibility, and security. And as there is a rising need for cloud computing, as well as the interest in virtualization and mobile technologies, Linux has established itself as the cornerstone of enterprise computing.
Region with Largest share:
Asia Pacific is projected to hold the largest market share during the forecast period owing to the growing adoption of technologies like artificial intelligence, the internet of things, and big data across a variety of end-user industries. The cloud computing policy of the Indian government, which permits the storage of data generated, may also lead to an increase in the quantity and size of data storage facilities in India, supporting the expansion of the industry.
Region with highest CAGR:
North America is projected to have the highest CAGR over the forecast period, owing to the rising demand for server operating systems and the expansion of internet applications. The server operating system uses Artificial Intelligence (AI) technologies to manage a variety of applications, including server and storage management. Increasing adoption and growth of advanced and latest technology, such as cloud computing, artificial intelligence (AI), and machine learning (ML) is positively impacting the growth of the market.

Key players in the market
Some of the key players profiled in the Server Operating System Market include Fujitsu Company, Unisys Global Technologies, Cisco Systems, Inc., DELL INC, Stratus Technologies, Google LLC, Huawei Technologies Co. Ltd., HP Development Company, IBM Corporation, Microsoft Corporation, NEC Corporation, Oracle Corporation, Amazon Web Services and Canonical Ltd.
Key Developments:
In September 2021, Microsoft Corporation has introduced a cutting-edge Windows server with innovations in hybrid, security, and containers. The flexibility of Windows Server 2022 has been improved, with support for 48TB of memory and 2,048 logical cores operating on 64 physical cores.
In July 2021, Google LLC launched an advanced cloud infrastructure development project in India. Similarly, in the earlier year, the company invested around USD 4.5 billion in Jio Platforms to push digitization efforts in the country. In July 2021, Google LLC had around 79 cloud zones, 26 cloud regions, and 146 cloud availability points across the world.
Products Covered:
• UNIX
• Linux
• Windows
• Other Products
Deployment Models Covered:
• On premise
• Cloud
• Other Deployment Models
Virtualization Status Covered:
• Virtualized
• Virtual Machine
• Physical
Components Covered:
• Service
• Software
• Other Components
End Users Covered:
• Healthcare
• Manufacturing
• IT and Telecom
• Government
• Retail and E-Commerce
• BFSI
• Other End Users
Regions Covered:
• North America
o US
o Canada
o Mexico
• Europe
o Germany
o UK
o Italy
o France
o Spain
o Rest of Europe
• Asia Pacific
o Japan
o China
o India
o Australia
o New Zealand
o South Korea
o Rest of Asia Pacific
• South America
o Argentina
o Brazil
o Chile
o Rest of South America
• Middle East & Africa
o Saudi Arabia
o UAE
o Qatar
o South Africa
o Rest of Middle East & Africa
What our report offers:
- Market share assessments for the regional and country-level segments
- Strategic recommendations for the new entrants
- Covers Market data for the years 2020, 2021, 2022, 2025, and 2028
- Market Trends (Drivers, Constraints, Opportunities, Threats, Challenges, Investment Opportunities, and recommendations)
- Strategic recommendations in key business segments based on the market estimations
- Competitive landscaping mapping the key common trends
- Company profiling with detailed strategies, financials, and recent developments
- Supply chain trends mapping the latest technological advancements
Free Customization Offerings:
All the customers of this report will be entitled to receive one of the following free customization options:
• Company Profiling
o Comprehensive profiling of additional market players (up to 3)
o SWOT Analysis of key players (up to 3)
• Regional Segmentation
o Market estimations, Forecasts and CAGR of any prominent country as per the client's interest (Note: Depends on feasibility check)
• Competitive Benchmarking
o Benchmarking of key players based on product portfolio, geographical presence, and strategic alliances
Table of Contents
1 Executive Summary
2 Preface
2.1 Abstract
2.2 Stake Holders
2.3 Research Scope
2.4 Research Methodology
2.4.1 Data Mining
2.4.2 Data Analysis
2.4.3 Data Validation
2.4.4 Research Approach
2.5 Research Sources
2.5.1 Primary Research Sources
2.5.2 Secondary Research Sources
2.5.3 Assumptions
3 Market Trend Analysis
3.1 Introduction
3.2 Drivers
3.3 Restraints
3.4 Opportunities
3.5 Threats
3.6 Product Analysis
3.7 End User Analysis
3.8 Emerging Markets
3.9 Impact of Covid-19
4 Porters Five Force Analysis
4.1 Bargaining power of suppliers
4.2 Bargaining power of buyers
4.3 Threat of substitutes
4.4 Threat of new entrants
4.5 Competitive rivalry
5 Global Server Operating System Market, By Product
5.1 Introduction
5.2 UNIX
5.3 Linux
5.4 Windows
5.5 Other Products
6 Global Server Operating System Market, By Deployment Model
6.1 Introduction
6.2 On premise
6.3 Cloud
6.4 Other Deployment Models
7 Global Server Operating System Market, By Virtualization Status
7.1 Introduction
7.2 Virtualized
7.3 Virtual Machine
7.4 Physical
8 Global Server Operating System Market, By Component
8.1 Introduction
8.2 Service
8.3 Software
8.4 Other Components
9 Global Server Operating System Market, By End User
9.1 Introduction
9.2 Healthcare
9.3 Manufacturing
9.4 IT and Telecom
9.5 Government
9.6 Retail and E-Commerce
9.7 BFSI
9.8 Other End Users
10 Global Server Operating System Market, By Geography
10.1 Introduction
10.2 North America
10.2.1 US
10.2.2 Canada
10.2.3 Mexico
10.3 Europe
10.3.1 Germany
10.3.2 UK
10.3.3 Italy
10.3.4 France
10.3.5 Spain
10.3.6 Rest of Europe
10.4 Asia Pacific
10.4.1 Japan
10.4.2 China
10.4.3 India
10.4.4 Australia
10.4.5 New Zealand
10.4.6 South Korea
10.4.7 Rest of Asia Pacific
10.5 South America
10.5.1 Argentina
10.5.2 Brazil
10.5.3 Chile
10.5.4 Rest of South America
10.6 Middle East & Africa
10.6.1 Saudi Arabia
10.6.2 UAE
10.6.3 Qatar
10.6.4 South Africa
10.6.5 Rest of Middle East & Africa
11 Key Developments
11.1 Agreements, Partnerships, Collaborations and Joint Ventures
11.2 Acquisitions & Mergers
11.3 New Product Launch
11.4 Expansions
11.5 Other Key Strategies
12 Company Profiling
12.1 Fujitsu Company
12.2 Unisys Global Technologies
12.3 Cisco Systems, Inc.
12.4 DELL INC
12.5 Stratus Technologies
12.6 Google LLC
12.7 Huawei Technologies Co. Ltd.
12.8 HP Development Company
12.9 IBM Corporation
12.10 Microsoft Corporation
12.11 NEC Corporation
12.12 Oracle Corporation
12.13 Amazon Web Services
12.14 Canonical Ltd.
List of Tables
1 Global Server Operating System Market Outlook, By Region (2020-2028) ($MN)
2 Global Server Operating System Market Outlook, By Product (2020-2028) ($MN)
3 Global Server Operating System Market Outlook, By UNIX (2020-2028) ($MN)
4 Global Server Operating System Market Outlook, By Linux (2020-2028) ($MN)
5 Global Server Operating System Market Outlook, By Windows (2020-2028) ($MN)
6 Global Server Operating System Market Outlook, By Other Products (2020-2028) ($MN)
7 Global Server Operating System Market Outlook, By Deployment Model (2020-2028) ($MN)
8 Global Server Operating System Market Outlook, By On premise (2020-2028) ($MN)
9 Global Server Operating System Market Outlook, By Cloud (2020-2028) ($MN)
10 Global Server Operating System Market Outlook, By Other Deployment Models (2020-2028) ($MN)
11 Global Server Operating System Market Outlook, By Virtualization Status (2020-2028) ($MN)
12 Global Server Operating System Market Outlook, By Virtualized (2020-2028) ($MN)
13 Global Server Operating System Market Outlook, By Virtual Machine (2020-2028) ($MN)
14 Global Server Operating System Market Outlook, By Physical (2020-2028) ($MN)
15 Global Server Operating System Market Outlook, By Component (2020-2028) ($MN)
16 Global Server Operating System Market Outlook, By Service (2020-2028) ($MN)
17 Global Server Operating System Market Outlook, By Software (2020-2028) ($MN)
18 Global Server Operating System Market Outlook, By Other Components (2020-2028) ($MN)
19 Global Server Operating System Market Outlook, By End User (2020-2028) ($MN)
20 Global Server Operating System Market Outlook, By Healthcare (2020-2028) ($MN)
21 Global Server Operating System Market Outlook, By Manufacturing (2020-2028) ($MN)
22 Global Server Operating System Market Outlook, By IT and Telecom (2020-2028) ($MN)
23 Global Server Operating System Market Outlook, By Government (2020-2028) ($MN)
24 Global Server Operating System Market Outlook, By Retail and E-Commerce (2020-2028) ($MN)
25 Global Server Operating System Market Outlook, By BFSI (2020-2028) ($MN)
26 Global Server Operating System Market Outlook, By Other End Users (2020-2028) ($MN)
27 North America Server Operating System Market Outlook, By Country (2020-2028) ($MN)
28 North America Server Operating System Market Outlook, By Product (2020-2028) ($MN)
29 North America Server Operating System Market Outlook, By UNIX (2020-2028) ($MN)
30 North America Server Operating System Market Outlook, By Linux (2020-2028) ($MN)
31 North America Server Operating System Market Outlook, By Windows (2020-2028) ($MN)
32 North America Server Operating System Market Outlook, By Other Products (2020-2028) ($MN)
33 North America Server Operating System Market Outlook, By Deployment Model (2020-2028) ($MN)
34 North America Server Operating System Market Outlook, By On premise (2020-2028) ($MN)
35 North America Server Operating System Market Outlook, By Cloud (2020-2028) ($MN)
36 North America Server Operating System Market Outlook, By Other Deployment Models (2020-2028) ($MN)
37 North America Server Operating System Market Outlook, By Virtualization Status (2020-2028) ($MN)
38 North America Server Operating System Market Outlook, By Virtualized (2020-2028) ($MN)
39 North America Server Operating System Market Outlook, By Virtual Machine (2020-2028) ($MN)
40 North America Server Operating System Market Outlook, By Physical (2020-2028) ($MN)
41 North America Server Operating System Market Outlook, By Component (2020-2028) ($MN)
42 North America Server Operating System Market Outlook, By Service (2020-2028) ($MN)
43 North America Server Operating System Market Outlook, By Software (2020-2028) ($MN)
44 North America Server Operating System Market Outlook, By Other Components (2020-2028) ($MN)
45 North America Server Operating System Market Outlook, By End User (2020-2028) ($MN)
46 North America Server Operating System Market Outlook, By Healthcare (2020-2028) ($MN)
47 North America Server Operating System Market Outlook, By Manufacturing (2020-2028) ($MN)
48 North America Server Operating System Market Outlook, By IT and Telecom (2020-2028) ($MN)
49 North America Server Operating System Market Outlook, By Government (2020-2028) ($MN)
50 North America Server Operating System Market Outlook, By Retail and E-Commerce (2020-2028) ($MN)
51 North America Server Operating System Market Outlook, By BFSI (2020-2028) ($MN)
52 North America Server Operating System Market Outlook, By Other End Users (2020-2028) ($MN)
53 Europe Server Operating System Market Outlook, By Country (2020-2028) ($MN)
54 Europe Server Operating System Market Outlook, By Product (2020-2028) ($MN)
55 Europe Server Operating System Market Outlook, By UNIX (2020-2028) ($MN)
56 Europe Server Operating System Market Outlook, By Linux (2020-2028) ($MN)
57 Europe Server Operating System Market Outlook, By Windows (2020-2028) ($MN)
58 Europe Server Operating System Market Outlook, By Other Products (2020-2028) ($MN)
59 Europe Server Operating System Market Outlook, By Deployment Model (2020-2028) ($MN)
60 Europe Server Operating System Market Outlook, By On premise (2020-2028) ($MN)
61 Europe Server Operating System Market Outlook, By Cloud (2020-2028) ($MN)
62 Europe Server Operating System Market Outlook, By Other Deployment Models (2020-2028) ($MN)
63 Europe Server Operating System Market Outlook, By Virtualization Status (2020-2028) ($MN)
64 Europe Server Operating System Market Outlook, By Virtualized (2020-2028) ($MN)
65 Europe Server Operating System Market Outlook, By Virtual Machine (2020-2028) ($MN)
66 Europe Server Operating System Market Outlook, By Physical (2020-2028) ($MN)
67 Europe Server Operating System Market Outlook, By Component (2020-2028) ($MN)
68 Europe Server Operating System Market Outlook, By Service (2020-2028) ($MN)
69 Europe Server Operating System Market Outlook, By Software (2020-2028) ($MN)
70 Europe Server Operating System Market Outlook, By Other Components (2020-2028) ($MN)
71 Europe Server Operating System Market Outlook, By End User (2020-2028) ($MN)
72 Europe Server Operating System Market Outlook, By Healthcare (2020-2028) ($MN)
73 Europe Server Operating System Market Outlook, By Manufacturing (2020-2028) ($MN)
74 Europe Server Operating System Market Outlook, By IT and Telecom (2020-2028) ($MN)
75 Europe Server Operating System Market Outlook, By Government (2020-2028) ($MN)
76 Europe Server Operating System Market Outlook, By Retail and E-Commerce (2020-2028) ($MN)
77 Europe Server Operating System Market Outlook, By BFSI (2020-2028) ($MN)
78 Europe Server Operating System Market Outlook, By Other End Users (2020-2028) ($MN)
79 Asia Pacific Server Operating System Market Outlook, By Country (2020-2028) ($MN)
80 Asia Pacific Server Operating System Market Outlook, By Product (2020-2028) ($MN)
81 Asia Pacific Server Operating System Market Outlook, By UNIX (2020-2028) ($MN)
82 Asia Pacific Server Operating System Market Outlook, By Linux (2020-2028) ($MN)
83 Asia Pacific Server Operating System Market Outlook, By Windows (2020-2028) ($MN)
84 Asia Pacific Server Operating System Market Outlook, By Other Products (2020-2028) ($MN)
85 Asia Pacific Server Operating System Market Outlook, By Deployment Model (2020-2028) ($MN)
86 Asia Pacific Server Operating System Market Outlook, By On premise (2020-2028) ($MN)
87 Asia Pacific Server Operating System Market Outlook, By Cloud (2020-2028) ($MN)
88 Asia Pacific Server Operating System Market Outlook, By Other Deployment Models (2020-2028) ($MN)
89 Asia Pacific Server Operating System Market Outlook, By Virtualization Status (2020-2028) ($MN)
90 Asia Pacific Server Operating System Market Outlook, By Virtualized (2020-2028) ($MN)
91 Asia Pacific Server Operating System Market Outlook, By Virtual Machine (2020-2028) ($MN)
92 Asia Pacific Server Operating System Market Outlook, By Physical (2020-2028) ($MN)
93 Asia Pacific Server Operating System Market Outlook, By Component (2020-2028) ($MN)
94 Asia Pacific Server Operating System Market Outlook, By Service (2020-2028) ($MN)
95 Asia Pacific Server Operating System Market Outlook, By Software (2020-2028) ($MN)
96 Asia Pacific Server Operating System Market Outlook, By Other Components (2020-2028) ($MN)
97 Asia Pacific Server Operating System Market Outlook, By End User (2020-2028) ($MN)
98 Asia Pacific Server Operating System Market Outlook, By Healthcare (2020-2028) ($MN)
99 Asia Pacific Server Operating System Market Outlook, By Manufacturing (2020-2028) ($MN)
100 Asia Pacific Server Operating System Market Outlook, By IT and Telecom (2020-2028) ($MN)
101 Asia Pacific Server Operating System Market Outlook, By Government (2020-2028) ($MN)
102 Asia Pacific Server Operating System Market Outlook, By Retail and E-Commerce (2020-2028) ($MN)
103 Asia Pacific Server Operating System Market Outlook, By BFSI (2020-2028) ($MN)
104 Asia Pacific Server Operating System Market Outlook, By Other End Users (2020-2028) ($MN)
105 South America Server Operating System Market Outlook, By Country (2020-2028) ($MN)
106 South America Server Operating System Market Outlook, By Product (2020-2028) ($MN)
107 South America Server Operating System Market Outlook, By UNIX (2020-2028) ($MN)
108 South America Server Operating System Market Outlook, By Linux (2020-2028) ($MN)
109 South America Server Operating System Market Outlook, By Windows (2020-2028) ($MN)
110 South America Server Operating System Market Outlook, By Other Products (2020-2028) ($MN)
111 South America Server Operating System Market Outlook, By Deployment Model (2020-2028) ($MN)
112 South America Server Operating System Market Outlook, By On premise (2020-2028) ($MN)
113 South America Server Operating System Market Outlook, By Cloud (2020-2028) ($MN)
114 South America Server Operating System Market Outlook, By Other Deployment Models (2020-2028) ($MN)
115 South America Server Operating System Market Outlook, By Virtualization Status (2020-2028) ($MN)
116 South America Server Operating System Market Outlook, By Virtualized (2020-2028) ($MN)
117 South America Server Operating System Market Outlook, By Virtual Machine (2020-2028) ($MN)
118 South America Server Operating System Market Outlook, By Physical (2020-2028) ($MN)
119 South America Server Operating System Market Outlook, By Component (2020-2028) ($MN)
120 South America Server Operating System Market Outlook, By Service (2020-2028) ($MN)
121 South America Server Operating System Market Outlook, By Software (2020-2028) ($MN)
122 South America Server Operating System Market Outlook, By Other Components (2020-2028) ($MN)
123 South America Server Operating System Market Outlook, By End User (2020-2028) ($MN)
124 South America Server Operating System Market Outlook, By Healthcare (2020-2028) ($MN)
125 South America Server Operating System Market Outlook, By Manufacturing (2020-2028) ($MN)
126 South America Server Operating System Market Outlook, By IT and Telecom (2020-2028) ($MN)
127 South America Server Operating System Market Outlook, By Government (2020-2028) ($MN)
128 South America Server Operating System Market Outlook, By Retail and E-Commerce (2020-2028) ($MN)
129 South America Server Operating System Market Outlook, By BFSI (2020-2028) ($MN)
130 South America Server Operating System Market Outlook, By Other End Users (2020-2028) ($MN)
131 Middle East & Africa Server Operating System Market Outlook, By Country (2020-2028) ($MN)
132 Middle East & Africa Server Operating System Market Outlook, By Product (2020-2028) ($MN)
133 Middle East & Africa Server Operating System Market Outlook, By UNIX (2020-2028) ($MN)
134 Middle East & Africa Server Operating System Market Outlook, By Linux (2020-2028) ($MN)
135 Middle East & Africa Server Operating System Market Outlook, By Windows (2020-2028) ($MN)
136 Middle East & Africa Server Operating System Market Outlook, By Other Products (2020-2028) ($MN)
137 Middle East & Africa Server Operating System Market Outlook, By Deployment Model (2020-2028) ($MN)
138 Middle East & Africa Server Operating System Market Outlook, By On premise (2020-2028) ($MN)
139 Middle East & Africa Server Operating System Market Outlook, By Cloud (2020-2028) ($MN)
140 Middle East & Africa Server Operating System Market Outlook, By Other Deployment Models (2020-2028) ($MN)
141 Middle East & Africa Server Operating System Market Outlook, By Virtualization Status (2020-2028) ($MN)
142 Middle East & Africa Server Operating System Market Outlook, By Virtualized (2020-2028) ($MN)
143 Middle East & Africa Server Operating System Market Outlook, By Virtual Machine (2020-2028) ($MN)
144 Middle East & Africa Server Operating System Market Outlook, By Physical (2020-2028) ($MN)
145 Middle East & Africa Server Operating System Market Outlook, By Component (2020-2028) ($MN)
146 Middle East & Africa Server Operating System Market Outlook, By Service (2020-2028) ($MN)
147 Middle East & Africa Server Operating System Market Outlook, By Software (2020-2028) ($MN)
148 Middle East & Africa Server Operating System Market Outlook, By Other Components (2020-2028) ($MN)
149 Middle East & Africa Server Operating System Market Outlook, By End User (2020-2028) ($MN)
150 Middle East & Africa Server Operating System Market Outlook, By Healthcare (2020-2028) ($MN)
151 Middle East & Africa Server Operating System Market Outlook, By Manufacturing (2020-2028) ($MN)
152 Middle East & Africa Server Operating System Market Outlook, By IT and Telecom (2020-2028) ($MN)
153 Middle East & Africa Server Operating System Market Outlook, By Government (2020-2028) ($MN)
154 Middle East & Africa Server Operating System Market Outlook, By Retail and E-Commerce (2020-2028) ($MN)
155 Middle East & Africa Server Operating System Market Outlook, By BFSI (2020-2028) ($MN)
156 Middle East & Africa Server Operating System Market Outlook, By Other End Users (2020-2028) ($MN)
List of Figures
RESEARCH METHODOLOGY

We at ‘Stratistics’ opt for an extensive research approach which involves data mining, data validation, and data analysis. The various research sources include in-house repository, secondary research, competitor’s sources, social media research, client internal data, and primary research.
Our team of analysts prefers the most reliable and authenticated data sources in order to perform the comprehensive literature search. With access to most of the authenticated data bases our team highly considers the best mix of information through various sources to obtain extensive and accurate analysis.
Each report takes an average time of a month and a team of 4 industry analysts. The time may vary depending on the scope and data availability of the desired market report. The various parameters used in the market assessment are standardized in order to enhance the data accuracy.
Data Mining
The data is collected from several authenticated, reliable, paid and unpaid sources and is filtered depending on the scope & objective of the research. Our reports repository acts as an added advantage in this procedure. Data gathering from the raw material suppliers, distributors and the manufacturers is performed on a regular basis, this helps in the comprehensive understanding of the products value chain. Apart from the above mentioned sources the data is also collected from the industry consultants to ensure the objective of the study is in the right direction.
Market trends such as technological advancements, regulatory affairs, market dynamics (Drivers, Restraints, Opportunities and Challenges) are obtained from scientific journals, market related national & international associations and organizations.
Data Analysis
From the data that is collected depending on the scope & objective of the research the data is subjected for the analysis. The critical steps that we follow for the data analysis include:
- Product Lifecycle Analysis
- Competitor analysis
- Risk analysis
- Porters Analysis
- PESTEL Analysis
- SWOT Analysis
The data engineering is performed by the core industry experts considering both the Marketing Mix Modeling and the Demand Forecasting. The marketing mix modeling makes use of multiple-regression techniques to predict the optimal mix of marketing variables. Regression factor is based on a number of variables and how they relate to an outcome such as sales or profits.
Data Validation
The data validation is performed by the exhaustive primary research from the expert interviews. This includes telephonic interviews, focus groups, face to face interviews, and questionnaires to validate our research from all aspects. The industry experts we approach come from the leading firms, involved in the supply chain ranging from the suppliers, distributors to the manufacturers and consumers so as to ensure an unbiased analysis.
We are in touch with more than 15,000 industry experts with the right mix of consultants, CEO's, presidents, vice presidents, managers, experts from both supply side and demand side, executives and so on.
The data validation involves the primary research from the industry experts belonging to:
- Leading Companies
- Suppliers & Distributors
- Manufacturers
- Consumers
- Industry/Strategic Consultants
Apart from the data validation the primary research also helps in performing the fill gap research, i.e. providing solutions for the unmet needs of the research which helps in enhancing the reports quality.
For more details about research methodology, kindly write to us at info@strategymrc.com
Frequently Asked Questions
In case of any queries regarding this report, you can contact the customer service by filing the “Inquiry Before Buy” form available on the right hand side. You may also contact us through email: info@strategymrc.com or phone: +1-301-202-5929
Yes, the samples are available for all the published reports. You can request them by filling the “Request Sample” option available in this page.
Yes, you can request a sample with your specific requirements. All the customized samples will be provided as per the requirement with the real data masked.
All our reports are available in Digital PDF format. In case if you require them in any other formats, such as PPT, Excel etc you can submit a request through “Inquiry Before Buy” form available on the right hand side. You may also contact us through email: info@strategymrc.com or phone: +1-301-202-5929
We offer a free 15% customization with every purchase. This requirement can be fulfilled for both pre and post sale. You may send your customization requirements through email at info@strategymrc.com or call us on +1-301-202-5929.
We have 3 different licensing options available in electronic format.
- Single User Licence: Allows one person, typically the buyer, to have access to the ordered product. The ordered product cannot be distributed to anyone else.
- 2-5 User Licence: Allows the ordered product to be shared among a maximum of 5 people within your organisation.
- Corporate License: Allows the product to be shared among all employees of your organisation regardless of their geographical location.
All our reports are typically be emailed to you as an attachment.
To order any available report you need to register on our website. The payment can be made either through CCAvenue or PayPal payments gateways which accept all international cards.
We extend our support to 6 months post sale. A post sale customization is also provided to cover your unmet needs in the report.
Request Customization
We provide a free 15% customization on every purchase. This requirement can be fulfilled for both pre and post sale. You may send your customization requirements through email at info@strategymrc.com or call us on +1-301-202-5929.
Note: This customization is absolutely free until it falls under the 15% bracket. If your requirement exceeds this a feasibility check will be performed. Post that, a quote will be provided along with the timelines.
WHY CHOOSE US ?

Assured Quality
Best in class reports with high standard of research integrity

24X7 Research Support
Continuous support to ensure the best customer experience.

Free Customization
Adding more values to your product of interest.

Safe & Secure Access
Providing a secured environment for all online transactions.

Trusted by 600+ Brands
Serving the most reputed brands across the world.