
Armored Vehicles Market
Armored Vehicles Market Forecasts to 2028 - Global Analysis By Platform (Combat Vehicles, Combat Support Vehicles and Unmanned Armored Ground Vehicles), System (Fire Control Systems (FCS), Armaments, Engines, Ballistic Armor and Other Systems), Mobility, Type, Mode of Operation, Point of Sale and By Geography

|
Years Covered |
2020-2028 |
|
Estimated Year Value (2022) |
US 26.59 BN |
|
Projected Year Value (2028) |
US $35.83 BN |
|
CAGR (2022 - 2028) |
5.1% |
|
Regions Covered |
North America, Europe, Asia Pacific, South America, and Middle East & Africa |
|
Countries Covered |
US, Canada, Mexico, Germany, UK, Italy, France, Spain, Japan, China, India, Australia, New Zealand, South Korea, Rest of Asia Pacific, South America, Argentina, Brazil, Chile, Middle East & Africa, Saudi Arabia, UAE, Qatar, and South Africa |
|
Largest Market |
Asia Pacific |
|
Highest Growing Market |
Europe |
According to Stratistics MRC, the Global Armored Vehicle Market is accounted for $26.59 billion in 2022 and is expected to reach $35.83 billion by 2028 growing at a CAGR of 5.1% during the forecast period. An armoured vehicle is a defended land vehicle that combines operational mobility with offensive and defensive capabilities. Depending on the kind, armoured vehicles can be wheeled or tracked. The armoured vehicle procurement and upgrade market provides information on the acquisition of military armoured vehicles, as well as maintenance, repair, and overhaul services, as well as upgrades and retrofits performed on these armoured vehicles. Upgrades include the addition of new technology or features to outdated system, subsystems as a retrofit.
According to the Stockholm International Peace Research Institute (SIPRI) report 2021, there was a 2.6% increase in global defense expenditure in 2020 compared to 2019.
Market Dynamics:
Driver:
Defence services are increasingly using unmanned combat ground vehicles
Military forces from several nations are focused on the employment of autonomous armoured ground vehicles on battlefields to decrease losses, since these vehicles are capable of completing vital and hazardous jobs that war fighters in combat zones are now performing. Unmanned armoured ground vehicles can also communicate with third-party payloads such as interrogation arms, remote weapon stations (RWS), and reconnaissance, surveillance, and target acquisition (RSTA) systems to support combat, CBRN defence, RSTA, and route clearance missions. Thus, all of the benefits of unmanned armoured ground vehicles over manned combat vehicles have resulted in their growing acceptance by many countries' defence forces.
Restraint:
Hardware and software failures
Hardware and software failures are common in autonomous cars and systems. Even though they are developed and engineered to withstand harsh conditions, they are nonetheless subjected to a variety of obstacles like as excessive temperatures, component malfunctions, software jams, and so on. Human operators control unmanned armoured ground vehicles either through tethered modes or remotely. In certain situations, human operators may lose control of these robots, or robots may miscalculate directives, resulting in mission failures. Engineers have encountered difficulties in developing completely autonomous cars and systems since this technology is still in its early stages.
Opportunity:
Improving defence forces' ISR and target acquisition capabilities
The increasing requirement for greater surveillance of maritime and land borders is critical for defence forces, especially given the rise in terror acts throughout the world, particularly near borders. In certain circumstances, armed forces struggle to respond effectively since the reaction time between the identification of threats and their interception is extremely fast and immediate. In these circumstances, robots can be a better option to people since they can do enhanced cross-border surveillance and information collection with a faster reaction time and more precision. Robots can monitor country boundaries effectively and efficiently while continually relaying real-time data to ground stations.
Threat:
Mechanical and electrical failures in armored vehicles
Armoured vehicles are subject to mechanical strain as a result of their travel across uneven terrain, as well as logistical pressure as a result of cross-country operations. These vehicles' constant high-speed travel frequently leads in mechanical breakdown of their engines and gearbox systems. They also experience power outages, component malfunction, and part jamming, among other things. These mistakes are sometimes difficult for rescue and recovery teams to correct, resulting in grave circumstances during wartime. Furthermore, detecting damaged components or elements that cause armoured vehicles to fail might be difficult at times. As a result, armoured vehicle makers are always working to correct these flaws by designing new and novel designs employing composites and implementing modern technologies in these vehicles.
Covid-19 Impact
Because of the COVID-19 pandemic, the defence sector has faced unprecedented hurdles. Due to declining defence budgets in India, Thailand, South Korea, and other nations, the market has grown at a slower rate. Due to the pandemic, armoured vehicle manufacturers in the market experienced delays in military vehicle delivery.
The armaments segment is expected to be the largest during the forecast period
The armaments segment is estimated to have a lucrative growth, due to increased demand for remote weapon stations, anti-tank guided missile (AGTM) launchers, and other armaments, the armaments segment is expected to rise the most throughout the projection period. Moreover armaments are used all throughout the world. The engine segment market is expected to develop due to increased demand for durable and strong diesel engines. Furthermore, as a result of main battle tank modernisation programmes, demand for turbine-fuelled engines is growing. The desire for autonomous ground armoured vehicles will drive considerable expansion in command and control systems.
The unmanned segment is expected to have the highest CAGR during the forecast period
The unmanned segment is anticipated to witness the fastest CAGR growth during the forecast period, due to these autonomous vehicles can operate in high-risk environments and have the ability to conduct defence activities. As a result, increased demand for the development and deployment of these unmanned military vehicles will propel the market forward. Due to its different operational aid, fire assistance, and others, the combat support vehicle category is expected to exhibit modest market expansion throughout the forecast period.
Region with highest share:
Asia Pacific is projected to hold the highest market share during the forecast period owing to rising defence spending in India and China is expected to propel the market's growth. The need for new armoured vehicles in Asia Pacific is increasing as a result of the military's need to replace ageing armoured vehicles and deploy sophisticated armoured vehicles. Furthermore, expanding capacities of domestic manufacturing firms in India, China, and Japan are projected to accelerate market expansion. Japan's armoured vehicle sector, like that of India and China, is thriving since the government expanded testing for new armoured vehicles.
Region with highest CAGR:
Europe is projected to have the highest CAGR over the forecast period, owing to the presence of significant manufacturers in the area, as well as considerable military budgets in the United States, has aided market expansion in North America. Furthermore, the United States Defence Department is concentrating on deploying armoured electric vehicles for efficient operating capabilities; this factor is expected to fuel market growth throughout the forecast period.

Key players in the market
Some of the key players profiled in the Armored Vehicle Market include General Dynamics Corporation, BAE Systems PLC, Rheinmetall AG, RUAG Group, Elbit Systems Ltd, Textron Inc., Oshkosh Corp, Thales Group, CMI Group, IVECO SPA, BMC, STREIT Group, Nexter KNDS Group, FNSS Savunma Sistemleri, AM General, Krauss-Maffei Wegmann GmbH & Co. KG, Hanwha Defense and Northrop Grumman Corporation
Key Developments:
In April 2021, Israel Aerospace Industries (IAI) signed a contract with Israel’s Ministry of Defense (MOD) to manufacture and supply nine Z-MAG all-terrain vehicles to the Israel Defense Forces (IDF), with an option to order 21 additional units.
In April 2021, L3Harris Technologies and American Rheinmetall Vehicles, a subsidiary of Rheinmetall AG, signed an agreement to develop the U.S. Army’s new Optionally Manned Fighting Vehicle (OMFV) to replace the Bradley Infantry Fighting Vehicle.
Platforms Covered:
• Combat Vehicles
• Combat Support Vehicles
• Unmanned Armored Ground Vehicles
Systems Covered:
• Fire Control Systems (FCS)
• Armaments
• Engines
• Ballistic Armor
• Command & Control (C2) Systems
• Countermeasure Systems
• Turret Drives
• Drive Systems
• Ammunition Handling System
• Navigation System
• Observation & Display System
• Power System
• Hulls/Frames
Mobilities Covered:
• Tracked
• Wheeled
Types Covered:
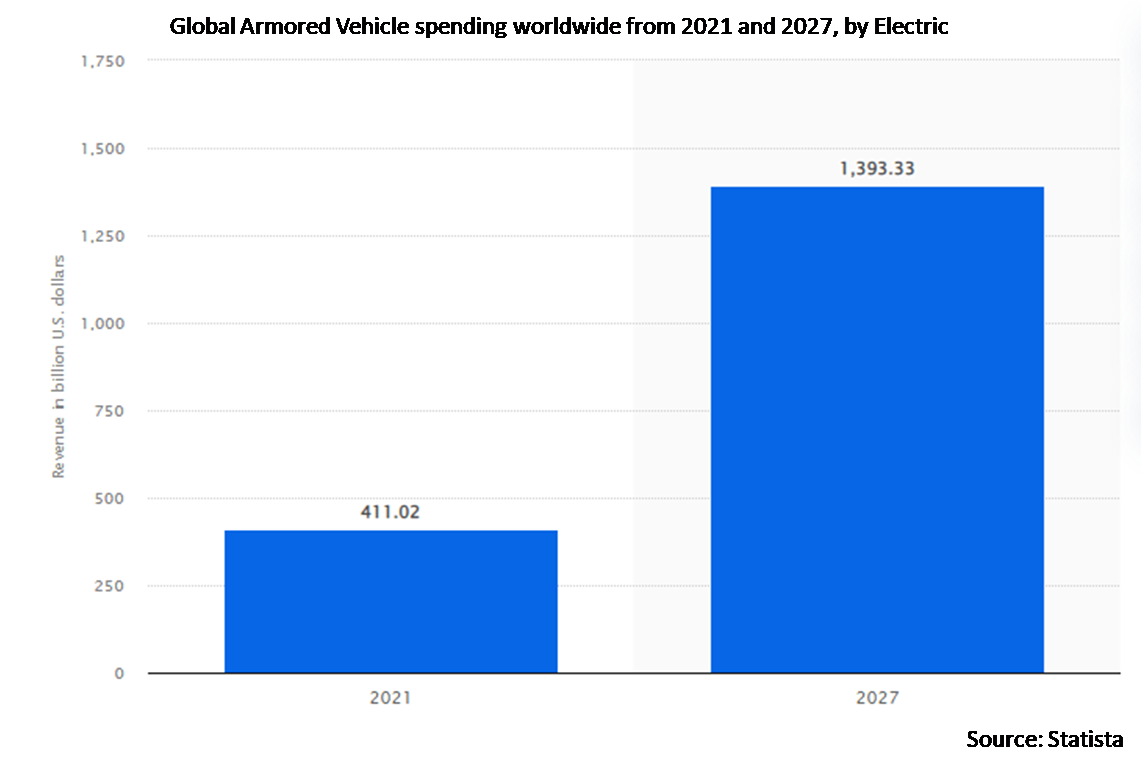
• Electric
• Conventional
Mode of Operations Covered:
• Manned
• Unmanned
Point of Sales Covered:
• OEM (Original Equipment Manufacturer)
• Retrofit
Regions Covered:
• North America
o US
o Canada
o Mexico
• Europe
o Germany
o UK
o Italy
o France
o Spain
o Rest of Europe
• Asia Pacific
o Japan
o China
o India
o Australia
o New Zealand
o South Korea
o Rest of Asia Pacific
• South America
o Argentina
o Brazil
o Chile
o Rest of South America
• Middle East & Africa
o Saudi Arabia
o UAE
o Qatar
o South Africa
o Rest of Middle East & Africa
What our report offers:
- Market share assessments for the regional and country-level segments
- Strategic recommendations for the new entrants
- Covers Market data for the years 2020, 2021, 2022, 2025, and 2028
- Market Trends (Drivers, Constraints, Opportunities, Threats, Challenges, Investment Opportunities, and recommendations)
- Strategic recommendations in key business segments based on the market estimations
- Competitive landscaping mapping the key common trends
- Company profiling with detailed strategies, financials, and recent developments
- Supply chain trends mapping the latest technological advancements
Free Customization Offerings:
All the customers of this report will be entitled to receive one of the following free customization options:
• Company Profiling
o Comprehensive profiling of additional market players (up to 3)
o SWOT Analysis of key players (up to 3)
• Regional Segmentation
o Market estimations, Forecasts and CAGR of any prominent country as per the client's interest (Note: Depends on feasibility check)
• Competitive Benchmarking
o Benchmarking of key players based on product portfolio, geographical presence, and strategic alliances
Table of Contents
1 Executive Summary
2 Preface
2.1 Abstract
2.2 Stake Holders
2.3 Research Scope
2.4 Research Methodology
2.4.1 Data Mining
2.4.2 Data Analysis
2.4.3 Data Validation
2.4.4 Research Approach
2.5 Research Sources
2.5.1 Primary Research Sources
2.5.2 Secondary Research Sources
2.5.3 Assumptions
3 Market Trend Analysis
3.1 Introduction
3.2 Drivers
3.3 Restraints
3.4 Opportunities
3.5 Threats
3.6 Emerging Markets
3.7 Impact of Covid-19
4 Porters Five Force Analysis
4.1 Bargaining power of suppliers
4.2 Bargaining power of buyers
4.3 Threat of substitutes
4.4 Threat of new entrants
4.5 Competitive rivalry
5 Global Armored Vehicle Market, By Platform
5.1 Introduction
5.2 Combat Vehicles
5.2.1 Infantry Fighting Vehicles
5.2.2 Main Battle Tanks
5.2.3 Armored Personal Carriers
5.2.4 Mine-Resistant Ambush Protected Vehicles
5.2.5 Light Armored Vehicles
5.2.6 Self-Propelled Howitzers
5.2.7 Air Defense Vehicles
5.2.8 Armored Mortar Carriers
5.2.9 Armored Amphibious Vehicles
5.3 Combat Support Vehicles
5.3.1 Repair and Recovery Vehicles
5.3.2 Armored Command and Control Vehicles
5.3.3 Armored Supply Trucks
5.3.4 Other Combat Support Vehicles
5.4 Unmanned Armored Ground Vehicles
6 Global Armored Vehicle Market, By System
6.1 Introduction
6.2 Fire Control Systems (FCS)
6.3 Armaments
6.4 Engines
6.5 Ballistic Armor
6.6 Command & Control (C2) Systems
6.7 Countermeasure Systems
6.8 Turret Drives
6.9 Drive Systems
6.10 Ammunition Handling System
6.11 Navigation System
6.12 Observation & Display System
6.13 Power System
6.14 Hulls/Frames
7 Global Armored Vehicle Market, By Mobility
7.1 Introduction
7.2 Tracked
7.3 Wheeled
8 Global Armored Vehicle Market, By Type
8.1 Introduction
8.2 Electric
8.3 Conventional
9 Global Armored Vehicle Market, By Mode of Operation
9.1 Introduction
9.2 Manned
9.3 Unmanned
10 Global Armored Vehicle Market, By Point of Sale
10.1 Introduction
10.2 OEM (Original Equipment Manufacturer)
10.3 Retrofit
11 Global Armored Vehicle Market, By Geography
11.1 Introduction
11.2 North America
11.2.1 US
11.2.2 Canada
11.2.3 Mexico
11.3 Europe
11.3.1 Germany
11.3.2 UK
11.3.3 Italy
11.3.4 France
11.3.5 Spain
11.3.6 Rest of Europe
11.4 Asia Pacific
11.4.1 Japan
11.4.2 China
11.4.3 India
11.4.4 Australia
11.4.5 New Zealand
11.4.6 South Korea
11.4.11 Rest of Asia Pacific
11.5 South America
11.5.1 Argentina
11.5.2 Brazil
11.5.3 Chile
11.5.4 Rest of South America
11.6 Middle East & Africa
11.6.1 Saudi Arabia
11.6.2 UAE
11.6.3 Qatar
11.6.4 South Africa
11.6.5 Rest of Middle East & Africa
12 Key Developments
12.1 Agreements, Partnerships, Collaborations and Joint Ventures
12.2 Acquisitions & Mergers
12.3 New Product Launch
12.4 Expansions
12.5 Other Key Strategies
13 Company Profiling
13.1 General Dynamics Corporation
13.2 BAE Systems PLC
13.3 Rheinmetall AG
13.4 RUAG Group
13.5 Elbit Systems Ltd
13.6 Textron Inc.
13.7 Oshkosh Corp
13.8 Thales Group
13.9 CMI Group
13.10 IVECO SPA
13.11 BMC
13.12 STREIT Group
13.13 Nexter KNDS Group
13.14 FNSS Savunma Sistemleri
13.15 AM General
13.16 Krauss-Maffei Wegmann GmbH & Co. KG
13.17 Hanwha Defense
13.18 Northrop Grumman Corporation
List of Tables
1 Global Armored Vehicle Market Outlook, By Region (2020-2028) ($MN)
2 Global Armored Vehicle Market Outlook, By Platform (2020-2028) ($MN)
3 Global Armored Vehicle Market Outlook, By Combat Vehicles (2020-2028) ($MN)
4 Global Armored Vehicle Market Outlook, By Infantry Fighting Vehicles (2020-2028) ($MN)
5 Global Armored Vehicle Market Outlook, By Main Battle Tanks (2020-2028) ($MN)
6 Global Armored Vehicle Market Outlook, By Armored Personal Carriers (2020-2028) ($MN)
7 Global Armored Vehicle Market Outlook, By Mine-Resistant Ambush Protected Vehicles (2020-2028) ($MN)
8 Global Armored Vehicle Market Outlook, By Light Armored Vehicles (2020-2028) ($MN)
9 Global Armored Vehicle Market Outlook, By Self-Propelled Howitzers (2020-2028) ($MN)
10 Global Armored Vehicle Market Outlook, By Air Defense Vehicles (2020-2028) ($MN)
11 Global Armored Vehicle Market Outlook, By Armored Mortar Carriers (2020-2028) ($MN)
12 Global Armored Vehicle Market Outlook, By Armored Amphibious Vehicles (2020-2028) ($MN)
13 Global Armored Vehicle Market Outlook, By Combat Support Vehicles (2020-2028) ($MN)
14 Global Armored Vehicle Market Outlook, By Repair and Recovery Vehicles (2020-2028) ($MN)
15 Global Armored Vehicle Market Outlook, By Armored Command and Control Vehicles (2020-2028) ($MN)
16 Global Armored Vehicle Market Outlook, By Armored Supply Trucks (2020-2028) ($MN)
17 Global Armored Vehicle Market Outlook, By Other Combat Support Vehicles (2020-2028) ($MN)
18 Global Armored Vehicle Market Outlook, By Unmanned Armored Ground Vehicles (2020-2028) ($MN)
19 Global Armored Vehicle Market Outlook, By System (2020-2028) ($MN)
20 Global Armored Vehicle Market Outlook, By Fire Control Systems (FCS) (2020-2028) ($MN)
21 Global Armored Vehicle Market Outlook, By Armaments (2020-2028) ($MN)
22 Global Armored Vehicle Market Outlook, By Engines (2020-2028) ($MN)
23 Global Armored Vehicle Market Outlook, By Ballistic Armor (2020-2028) ($MN)
24 Global Armored Vehicle Market Outlook, By Command & Control (C2) Systems (2020-2028) ($MN)
25 Global Armored Vehicle Market Outlook, By Countermeasure Systems (2020-2028) ($MN)
26 Global Armored Vehicle Market Outlook, By Turret Drives (2020-2028) ($MN)
27 Global Armored Vehicle Market Outlook, By Drive Systems (2020-2028) ($MN)
28 Global Armored Vehicle Market Outlook, By Ammunition Handling System (2020-2028) ($MN)
29 Global Armored Vehicle Market Outlook, By Navigation System (2020-2028) ($MN)
30 Global Armored Vehicle Market Outlook, By Observation & Display System (2020-2028) ($MN)
31 Global Armored Vehicle Market Outlook, By Power System (2020-2028) ($MN)
32 Global Armored Vehicle Market Outlook, By Hulls/Frames (2020-2028) ($MN)
33 Global Armored Vehicle Market Outlook, By Mobility (2020-2028) ($MN)
34 Global Armored Vehicle Market Outlook, By Tracked (2020-2028) ($MN)
35 Global Armored Vehicle Market Outlook, By Wheeled (2020-2028) ($MN)
36 Global Armored Vehicle Market Outlook, By Type (2020-2028) ($MN)
37 Global Armored Vehicle Market Outlook, By Electric (2020-2028) ($MN)
38 Global Armored Vehicle Market Outlook, By Conventional (2020-2028) ($MN)
39 Global Armored Vehicle Market Outlook, By Mode of Operation (2020-2028) ($MN)
40 Global Armored Vehicle Market Outlook, By Manned (2020-2028) ($MN)
41 Global Armored Vehicle Market Outlook, By Unmanned (2020-2028) ($MN)
42 Global Armored Vehicle Market Outlook, By Point of Sale (2020-2028) ($MN)
43 Global Armored Vehicle Market Outlook, By OEM (Original Equipment Manufacturer) (2020-2028) ($MN)
44 Global Armored Vehicle Market Outlook, By Retrofit (2020-2028) ($MN)
Note: Tables for North America, Europe, APAC, South America, and Middle East & Africa Regions are also represented in the same manner as above.
List of Figures
RESEARCH METHODOLOGY

We at ‘Stratistics’ opt for an extensive research approach which involves data mining, data validation, and data analysis. The various research sources include in-house repository, secondary research, competitor’s sources, social media research, client internal data, and primary research.
Our team of analysts prefers the most reliable and authenticated data sources in order to perform the comprehensive literature search. With access to most of the authenticated data bases our team highly considers the best mix of information through various sources to obtain extensive and accurate analysis.
Each report takes an average time of a month and a team of 4 industry analysts. The time may vary depending on the scope and data availability of the desired market report. The various parameters used in the market assessment are standardized in order to enhance the data accuracy.
Data Mining
The data is collected from several authenticated, reliable, paid and unpaid sources and is filtered depending on the scope & objective of the research. Our reports repository acts as an added advantage in this procedure. Data gathering from the raw material suppliers, distributors and the manufacturers is performed on a regular basis, this helps in the comprehensive understanding of the products value chain. Apart from the above mentioned sources the data is also collected from the industry consultants to ensure the objective of the study is in the right direction.
Market trends such as technological advancements, regulatory affairs, market dynamics (Drivers, Restraints, Opportunities and Challenges) are obtained from scientific journals, market related national & international associations and organizations.
Data Analysis
From the data that is collected depending on the scope & objective of the research the data is subjected for the analysis. The critical steps that we follow for the data analysis include:
- Product Lifecycle Analysis
- Competitor analysis
- Risk analysis
- Porters Analysis
- PESTEL Analysis
- SWOT Analysis
The data engineering is performed by the core industry experts considering both the Marketing Mix Modeling and the Demand Forecasting. The marketing mix modeling makes use of multiple-regression techniques to predict the optimal mix of marketing variables. Regression factor is based on a number of variables and how they relate to an outcome such as sales or profits.
Data Validation
The data validation is performed by the exhaustive primary research from the expert interviews. This includes telephonic interviews, focus groups, face to face interviews, and questionnaires to validate our research from all aspects. The industry experts we approach come from the leading firms, involved in the supply chain ranging from the suppliers, distributors to the manufacturers and consumers so as to ensure an unbiased analysis.
We are in touch with more than 15,000 industry experts with the right mix of consultants, CEO's, presidents, vice presidents, managers, experts from both supply side and demand side, executives and so on.
The data validation involves the primary research from the industry experts belonging to:
- Leading Companies
- Suppliers & Distributors
- Manufacturers
- Consumers
- Industry/Strategic Consultants
Apart from the data validation the primary research also helps in performing the fill gap research, i.e. providing solutions for the unmet needs of the research which helps in enhancing the reports quality.
For more details about research methodology, kindly write to us at info@strategymrc.com
Frequently Asked Questions
In case of any queries regarding this report, you can contact the customer service by filing the “Inquiry Before Buy” form available on the right hand side. You may also contact us through email: info@strategymrc.com or phone: +1-301-202-5929
Yes, the samples are available for all the published reports. You can request them by filling the “Request Sample” option available in this page.
Yes, you can request a sample with your specific requirements. All the customized samples will be provided as per the requirement with the real data masked.
All our reports are available in Digital PDF format. In case if you require them in any other formats, such as PPT, Excel etc you can submit a request through “Inquiry Before Buy” form available on the right hand side. You may also contact us through email: info@strategymrc.com or phone: +1-301-202-5929
We offer a free 15% customization with every purchase. This requirement can be fulfilled for both pre and post sale. You may send your customization requirements through email at info@strategymrc.com or call us on +1-301-202-5929.
We have 3 different licensing options available in electronic format.
- Single User Licence: Allows one person, typically the buyer, to have access to the ordered product. The ordered product cannot be distributed to anyone else.
- 2-5 User Licence: Allows the ordered product to be shared among a maximum of 5 people within your organisation.
- Corporate License: Allows the product to be shared among all employees of your organisation regardless of their geographical location.
All our reports are typically be emailed to you as an attachment.
To order any available report you need to register on our website. The payment can be made either through CCAvenue or PayPal payments gateways which accept all international cards.
We extend our support to 6 months post sale. A post sale customization is also provided to cover your unmet needs in the report.
Request Customization
We offer complimentary customization of up to 15% with every purchase. To share your customization requirements, feel free to email us at info@strategymrc.com or call us on +1-301-202-5929. .
Please Note: Customization within the 15% threshold is entirely free of charge. If your request exceeds this limit, we will conduct a feasibility assessment. Following that, a detailed quote and timeline will be provided.
WHY CHOOSE US ?

Assured Quality
Best in class reports with high standard of research integrity

24X7 Research Support
Continuous support to ensure the best customer experience.

Free Customization
Adding more values to your product of interest.

Safe & Secure Access
Providing a secured environment for all online transactions.

Trusted by 600+ Brands
Serving the most reputed brands across the world.