
Carbonation Machines In Beverage Market
Carbonation Machines in Beverage Market Forecasts to 2030 - Global Analysis By Type (Carbonation Equipment, Sugar Dissolvers, Heat Exchangers, Blenders & Mixers, Filtration Equipment and Silos), Beverage Type (Functional Drinks, Club Soda & Sparkling Water and Flavored Drinks), Distribution Channel and By Geography

|
Years Covered |
2021-2030 |
|
Estimated Year Value (2023) |
US $6.64 BN |
|
Projected Year Value (2030) |
US $12.61 BN |
|
CAGR (2023 - 2030) |
9.6% |
|
Regions Covered |
North America, Europe, Asia Pacific, South America, and Middle East & Africa |
|
Countries Covered |
US, Canada, Mexico, Germany, UK, Italy, France, Spain, Japan, China, India, Australia, New Zealand, South Korea, Rest of Asia Pacific, South America, Argentina, Brazil, Chile, Middle East & Africa, Saudi Arabia, UAE, Qatar, and South Africa |
|
Largest Market |
North America |
|
Highest Growing Market |
Asia Pacific |
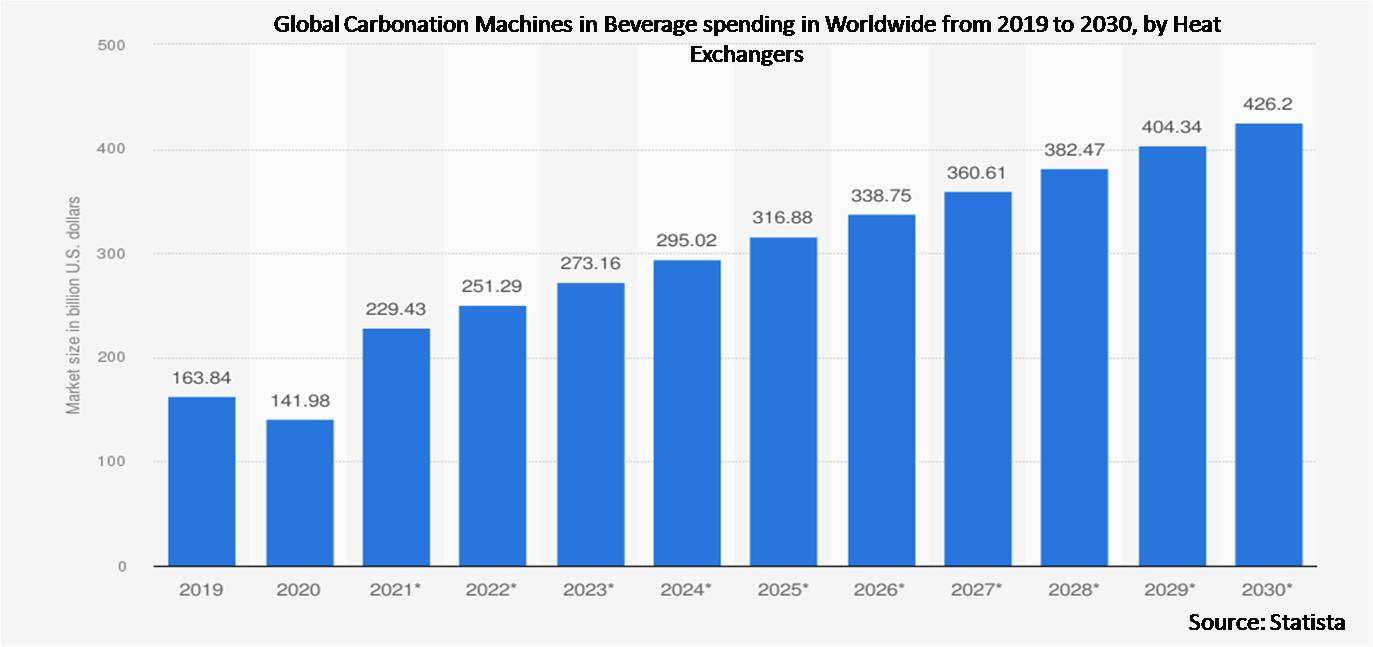
According to Stratistics MRC, the Global Carbonation Machines in Beverage Market is accounted for $6.64 billion in 2023 and is expected to reach $12.61 billion by 2030 growing at a CAGR of 9.6% during the forecast period. Carbonated beverage processing equipment is used to produce carbonated soft drinks, which are popular beverages that contain dissolved carbon dioxide gas. A variety of machines and systems are included in the equipment for producing, mixing, carbonating, and packaging carbonated beverages. Beverage processing equipment like mixing tanks is used to mix sugar, water and concentrate on the beverage industry's essential proportions. Soda fountain machine dispensers for carbonated soft drinks are widely seen in restaurants, convenience stores, and concession stands. This device combines carbon dioxide and flavoured syrup with chilled water in diverse flavours.
Market Dynamics:
Driver:
Technological advancements
Technology development has become a major trend that is becoming more and more popular in the market. The focus of major market players in the carbonated beverage processing equipment industry is on developing innovative technologies. The Pro Fill V Series uses an advanced electronic HMI interface to provide recipe-based changeovers and simple, repeatable filler processes. Changeover periods also go shorter as a result, enhancing overall manufacturing capacity. The Pro Fill V gives three times more filling accuracy than conventional fill-to-level can fillers. The market expansion is aided by the accuracy with which AI filling technology has increased.
Restraint:
Cost constraint
A major hurdle to obtaining a carbonation machine can be its initial cost, especially for startups or small firms with limited funding. Commercial-grade equipment used for high-volume manufacturing can be especially pricey. However, the financial investment necessary to acquire and run carbonation devices in the beverage business is a cost constraint. The cost of carbonation machines might vary according to features, capacity, size, and brand reputation. The high cost is the main significant barrier that hampers market expansion.
Opportunity:
Sustainability
Carbonation equipment could assist with sustainability initiatives. Businesses can lessen their environmental impact by not using single-use plastic bottles or cans. Additionally, compared to conventional carbonation techniques that rely on chemical additives, the use of CO2 tanks or cartridges may be more environmentally benign. Therefore, the market demand for carbonation machines in beverages is expanding.
Threat:
High energy consumption
The market for processing carbonated beverages is unable to expand due to the high energy requirements of the manufacturing process. The production of carbonated beverages takes several steps, including carbonation, mixing, cooling, and packaging, all of which demand a large amount of energy. The food and beverage industry's increasing emphasis on sustainability and energy efficiency poses a challenge to the market. These factors hinder market demand.
Covid-19 Impact
Global supply chains have been disrupted by the pandemic, which has had an impact on the manufacture and delivery of carbonation equipment and related parts. Manufacturers might experience difficulties locating raw materials, procuring production tools, and delivering finished goods, which might cause delays and a shortage of supplies. The epidemic has also impacted consumer preferences in the beverage market. The sugar content and other additives in pre-packaged carbonated drinks have come under increased scrutiny from health-conscious people. Because of this, there is an increasing demand for homemade or personalised beverages, where carbonation equipment is essential.
The sugar dissolvers segment is expected to be the largest during the forecast period
The sugar dissolvers segment is estimated to hold the largest share. The treatment and sugar dissolving procedure are two of the crucial steps in producing carbonated soft drinks. Manufacturers of carbonated soft drinks have a more cost-effective alternative to utilising ready-made liquid sugar: dissolving sugar crystals and using the resulting syrup instead. Increasing health consciousness among consumers has fuelled the growth of the low-calorie carbonated beverage market, which is likely to aid the growth of the segment. As a result, there will be an increase in the need for sugar dissolvers.
The functional drinks segment is expected to have the highest CAGR during the forecast period
The functional drinks segment is anticipated to have lucrative growth during the forecast period. In the beverage industry, ""functional drinks"" refers to a class of beverages that go beyond simple taste and hydration in carbonation machines. These beverages are designed with extra components to offer certain wellness or health benefits, frequently catering to a specific purpose or requirement. The ""Functional Drinks"" area of the carbonation machine market, which is employed in the beverage industry, is a dynamic and expanding category. Carbonation machines offer a flexible way to add healthy components to beverages while retaining a delightfully effervescent or sparkling texture for the ""functional drinks"" market.
Region with largest share:
North America commanded the largest market share during the extrapolated period The key driver driving the market for carbonated beverage processing equipment in this region is the rising consumption of carbonated soft drinks, which is due to their high caffeine content and appeal to the millennial generation. Additionally, the existence of major industry competitors like PepsiCo, Inc. and The Coca-Cola Company fuelled demand in North America for this market. The Coca-Cola Company's production and marketing of sports drinks like Powerade are driving up demand for carbonated soft drinks, which is driving up demand for carbonated beverage processing equipment.
Region with highest CAGR:
Asia Pacific is expected to witness profitable growth over the projection period due to the availability of resources at a low cost and a skilled workforce and rapid urbanization of various areas in the Asia-Pacific region as well as the increase in consumption of carbonated beverages among people due to the influence of western eating habits and lifestyle. Demand for equipment for processing carbonated beverages is increasing as businesses expand their manufacturing facilities. The demand for foreign brands of carbonated soft drinks has also increased in the region. The availability of a trained workforce also helps the market expand since it promotes effective manufacturing and enables businesses to satisfy the region's growing demand.

Key players in the market
Some of the key players in the Carbonation Machines in Beverage Market include Alfa Laval AB, GEA Group Aktiengesellschaft, Mitsui Sugar Co., Ltd., Krones AG, Tetra Laval Group, Statco Engineering & Fabricators Inc., Van Der Molen GmbH, SPX Corporation, Due Di Squeri Donato & CSPA, Water Systems S.R.L., Seppelec Sl, TCP Pioneer Co. Ltd, Tetra Pak International S.A, Pentair plc, Shreeji Projects and Ajinomoto Health & Nutrition North America, Inc.
Key Developments:
In October 2021, Tetra Pak formed a partnership with Poka, a web and mobile app designed for manufacturers to support factory training, knowledge building, and communication. This partnership aimed to empower workers in food production with the tools & training required to practice zero-waste procedures in food manufacturing plants.
In September 2021, GEA introduced Batch2Flow, a solution that secures the food production process, and saves energy and water. This solution helps to decrease the usage of cleaning chemicals. The Batch2Flow GEA experts have developed the absent connection between mixing and forming, which comes with additional advantages for food safety.
Types Covered:
• Carbonation Equipment
• Sugar Dissolvers
• Heat Exchangers
• Blenders & Mixers
• Filtration Equipment
• Silos
Beverage Types Covered:
• Functional Drinks
• Club Soda & Sparkling Water
• Flavoured Drinks
Distribution Channels Covered:
• Original Equipment Manufacturer
• Aftermarket Sales
Regions Covered:
• North America
o US
o Canada
o Mexico
• Europe
o Germany
o UK
o Italy
o France
o Spain
o Rest of Europe
• Asia Pacific
o Japan
o China
o India
o Australia
o New Zealand
o South Korea
o Rest of Asia Pacific
• South America
o Argentina
o Brazil
o Chile
o Rest of South America
• Middle East & Africa
o Saudi Arabia
o UAE
o Qatar
o South Africa
o Rest of Middle East & Africa
What our report offers:
- Market share assessments for the regional and country-level segments
- Strategic recommendations for the new entrants
- Covers Market data for the years 2021, 2022, 2023, 2026, and 2030
- Market Trends (Drivers, Constraints, Opportunities, Threats, Challenges, Investment Opportunities, and recommendations)
- Strategic recommendations in key business segments based on the market estimations
- Competitive landscaping mapping the key common trends
- Company profiling with detailed strategies, financials, and recent developments
- Supply chain trends mapping the latest technological advancements
Free Customization Offerings:
All the customers of this report will be entitled to receive one of the following free customization options:
• Company Profiling
o Comprehensive profiling of additional market players (up to 3)
o SWOT Analysis of key players (up to 3)
• Regional Segmentation
o Market estimations, Forecasts and CAGR of any prominent country as per the client's interest (Note: Depends on feasibility check)
• Competitive Benchmarking
o Benchmarking of key players based on product portfolio, geographical presence, and strategic alliances
Table of Contents
1 Executive Summary
2 Preface
2.1 Abstract
2.2 Stake Holders
2.3 Research Scope
2.4 Research Methodology
2.4.1 Data Mining
2.4.2 Data Analysis
2.4.3 Data Validation
2.4.4 Research Approach
2.5 Research Sources
2.5.1 Primary Research Sources
2.5.2 Secondary Research Sources
2.5.3 Assumptions
3 Market Trend Analysis
3.1 Introduction
3.2 Drivers
3.3 Restraints
3.4 Opportunities
3.5 Threats
3.6 Emerging Markets
3.7 Impact of Covid-19
4 Porters Five Force Analysis
4.1 Bargaining power of suppliers
4.2 Bargaining power of buyers
4.3 Threat of substitutes
4.4 Threat of new entrants
4.5 Competitive rivalry
5 Global Carbonation Machines in Beverage Market, By Type
5.1 Introduction
5.2 Carbonation Equipment
5.3 Sugar Dissolvers
5.4 Heat Exchangers
5.5 Blenders & Mixers
5.6 Filtration Equipment
5.7 Silos
6 Global Carbonation Machines in Beverage Market, By Beverage Type
6.1 Introduction
6.2 Functional Drinks
6.3 Club Soda & Sparkling Water
6.4 Flavored Drinks
7 Global Carbonation Machines in Beverage Market, By Distribution Channel
7.1 Introduction
7.2 Original Equipment Manufacturer
7.3 Aftermarket Sales
8 Global Carbonation Machines in Beverage Market, By Geography
8.1 Introduction
8.2 North America
8.2.1 US
8.2.2 Canada
8.2.3 Mexico
8.3 Europe
8.3.1 Germany
8.3.2 UK
8.3.3 Italy
8.3.4 France
8.3.5 Spain
8.3.6 Rest of Europe
8.4 Asia Pacific
8.4.1 Japan
8.4.2 China
8.4.3 India
8.4.4 Australia
8.4.5 New Zealand
8.4.6 South Korea
8.4.7 Rest of Asia Pacific
8.5 South America
8.5.1 Argentina
8.5.2 Brazil
8.5.3 Chile
8.5.4 Rest of South America
8.6 Middle East & Africa
8.6.1 Saudi Arabia
8.6.2 UAE
8.6.3 Qatar
8.6.4 South Africa
8.6.5 Rest of Middle East & Africa
9 Key Developments
9.1 Agreements, Partnerships, Collaborations and Joint Ventures
9.2 Acquisitions & Mergers
9.3 New Product Launch
9.4 Expansions
9.5 Other Key Strategies
10 Company Profiling
10.1 Alfa Laval AB
10.2 GEA Group Aktiengesellschaft
10.3 Mitsui Sugar Co., Ltd.
10.4 Krones AG
10.5 Tetra Laval Group
10.6 Statco Engineering & Fabricators Inc.
10.7 Van Der Molen GmbH
10.8 SPX Corporation
10.9 Due Di Squeri Donato & CSPA
10.10 Water Systems S.R.L.
10.11 Seppelec Sl
10.12 TCP Pioneer Co. Ltd
10.13 Tetra Pak International S.A
10.14 Pentair plc
10.15 Shreeji Projects
10.16 Ajinomoto Health & Nutrition North America, Inc.
List of Tables
1 Global Carbonation Machines in Beverage Market Outlook, By Region (2021-2030) ($MN)
2 Global Carbonation Machines in Beverage Market Outlook, By Type (2021-2030) ($MN)
3 Global Carbonation Machines in Beverage Market Outlook, By Carbonation Equipment (2021-2030) ($MN)
4 Global Carbonation Machines in Beverage Market Outlook, By Sugar Dissolvers (2021-2030) ($MN)
5 Global Carbonation Machines in Beverage Market Outlook, By Heat Exchangers (2021-2030) ($MN)
6 Global Carbonation Machines in Beverage Market Outlook, By Blenders & Mixers (2021-2030) ($MN)
7 Global Carbonation Machines in Beverage Market Outlook, By Filtration Equipment (2021-2030) ($MN)
8 Global Carbonation Machines in Beverage Market Outlook, By Silos (2021-2030) ($MN)
9 Global Carbonation Machines in Beverage Market Outlook, By Beverage Type (2021-2030) ($MN)
10 Global Carbonation Machines in Beverage Market Outlook, By Functional Drinks (2021-2030) ($MN)
11 Global Carbonation Machines in Beverage Market Outlook, By Club Soda & Sparkling Water (2021-2030) ($MN)
12 Global Carbonation Machines in Beverage Market Outlook, By Flavored Drinks (2021-2030) ($MN)
13 Global Carbonation Machines in Beverage Market Outlook, By Distribution Channel (2021-2030) ($MN)
14 Global Carbonation Machines in Beverage Market Outlook, By Original Equipment Manufacturer (2021-2030) ($MN)
15 Global Carbonation Machines in Beverage Market Outlook, By Aftermarket Sales (2021-2030) ($MN)
16 North America Carbonation Machines in Beverage Market Outlook, By Country (2021-2030) ($MN)
17 North America Carbonation Machines in Beverage Market Outlook, By Type (2021-2030) ($MN)
18 North America Carbonation Machines in Beverage Market Outlook, By Carbonation Equipment (2021-2030) ($MN)
19 North America Carbonation Machines in Beverage Market Outlook, By Sugar Dissolvers (2021-2030) ($MN)
20 North America Carbonation Machines in Beverage Market Outlook, By Heat Exchangers (2021-2030) ($MN)
21 North America Carbonation Machines in Beverage Market Outlook, By Blenders & Mixers (2021-2030) ($MN)
22 North America Carbonation Machines in Beverage Market Outlook, By Filtration Equipment (2021-2030) ($MN)
23 North America Carbonation Machines in Beverage Market Outlook, By Silos (2021-2030) ($MN)
24 North America Carbonation Machines in Beverage Market Outlook, By Beverage Type (2021-2030) ($MN)
25 North America Carbonation Machines in Beverage Market Outlook, By Functional Drinks (2021-2030) ($MN)
26 North America Carbonation Machines in Beverage Market Outlook, By Club Soda & Sparkling Water (2021-2030) ($MN)
27 North America Carbonation Machines in Beverage Market Outlook, By Flavored Drinks (2021-2030) ($MN)
28 North America Carbonation Machines in Beverage Market Outlook, By Distribution Channel (2021-2030) ($MN)
29 North America Carbonation Machines in Beverage Market Outlook, By Original Equipment Manufacturer (2021-2030) ($MN)
30 North America Carbonation Machines in Beverage Market Outlook, By Aftermarket Sales (2021-2030) ($MN)
31 Europe Carbonation Machines in Beverage Market Outlook, By Country (2021-2030) ($MN)
32 Europe Carbonation Machines in Beverage Market Outlook, By Type (2021-2030) ($MN)
33 Europe Carbonation Machines in Beverage Market Outlook, By Carbonation Equipment (2021-2030) ($MN)
34 Europe Carbonation Machines in Beverage Market Outlook, By Sugar Dissolvers (2021-2030) ($MN)
35 Europe Carbonation Machines in Beverage Market Outlook, By Heat Exchangers (2021-2030) ($MN)
36 Europe Carbonation Machines in Beverage Market Outlook, By Blenders & Mixers (2021-2030) ($MN)
37 Europe Carbonation Machines in Beverage Market Outlook, By Filtration Equipment (2021-2030) ($MN)
38 Europe Carbonation Machines in Beverage Market Outlook, By Silos (2021-2030) ($MN)
39 Europe Carbonation Machines in Beverage Market Outlook, By Beverage Type (2021-2030) ($MN)
40 Europe Carbonation Machines in Beverage Market Outlook, By Functional Drinks (2021-2030) ($MN)
41 Europe Carbonation Machines in Beverage Market Outlook, By Club Soda & Sparkling Water (2021-2030) ($MN)
42 Europe Carbonation Machines in Beverage Market Outlook, By Flavored Drinks (2021-2030) ($MN)
43 Europe Carbonation Machines in Beverage Market Outlook, By Distribution Channel (2021-2030) ($MN)
44 Europe Carbonation Machines in Beverage Market Outlook, By Original Equipment Manufacturer (2021-2030) ($MN)
45 Europe Carbonation Machines in Beverage Market Outlook, By Aftermarket Sales (2021-2030) ($MN)
46 Asia Pacific Carbonation Machines in Beverage Market Outlook, By Country (2021-2030) ($MN)
47 Asia Pacific Carbonation Machines in Beverage Market Outlook, By Type (2021-2030) ($MN)
48 Asia Pacific Carbonation Machines in Beverage Market Outlook, By Carbonation Equipment (2021-2030) ($MN)
49 Asia Pacific Carbonation Machines in Beverage Market Outlook, By Sugar Dissolvers (2021-2030) ($MN)
50 Asia Pacific Carbonation Machines in Beverage Market Outlook, By Heat Exchangers (2021-2030) ($MN)
51 Asia Pacific Carbonation Machines in Beverage Market Outlook, By Blenders & Mixers (2021-2030) ($MN)
52 Asia Pacific Carbonation Machines in Beverage Market Outlook, By Filtration Equipment (2021-2030) ($MN)
53 Asia Pacific Carbonation Machines in Beverage Market Outlook, By Silos (2021-2030) ($MN)
54 Asia Pacific Carbonation Machines in Beverage Market Outlook, By Beverage Type (2021-2030) ($MN)
55 Asia Pacific Carbonation Machines in Beverage Market Outlook, By Functional Drinks (2021-2030) ($MN)
56 Asia Pacific Carbonation Machines in Beverage Market Outlook, By Club Soda & Sparkling Water (2021-2030) ($MN)
57 Asia Pacific Carbonation Machines in Beverage Market Outlook, By Flavored Drinks (2021-2030) ($MN)
58 Asia Pacific Carbonation Machines in Beverage Market Outlook, By Distribution Channel (2021-2030) ($MN)
59 Asia Pacific Carbonation Machines in Beverage Market Outlook, By Original Equipment Manufacturer (2021-2030) ($MN)
60 Asia Pacific Carbonation Machines in Beverage Market Outlook, By Aftermarket Sales (2021-2030) ($MN)
61 South America Carbonation Machines in Beverage Market Outlook, By Country (2021-2030) ($MN)
62 South America Carbonation Machines in Beverage Market Outlook, By Type (2021-2030) ($MN)
63 South America Carbonation Machines in Beverage Market Outlook, By Carbonation Equipment (2021-2030) ($MN)
64 South America Carbonation Machines in Beverage Market Outlook, By Sugar Dissolvers (2021-2030) ($MN)
65 South America Carbonation Machines in Beverage Market Outlook, By Heat Exchangers (2021-2030) ($MN)
66 South America Carbonation Machines in Beverage Market Outlook, By Blenders & Mixers (2021-2030) ($MN)
67 South America Carbonation Machines in Beverage Market Outlook, By Filtration Equipment (2021-2030) ($MN)
68 South America Carbonation Machines in Beverage Market Outlook, By Silos (2021-2030) ($MN)
69 South America Carbonation Machines in Beverage Market Outlook, By Beverage Type (2021-2030) ($MN)
70 South America Carbonation Machines in Beverage Market Outlook, By Functional Drinks (2021-2030) ($MN)
71 South America Carbonation Machines in Beverage Market Outlook, By Club Soda & Sparkling Water (2021-2030) ($MN)
72 South America Carbonation Machines in Beverage Market Outlook, By Flavored Drinks (2021-2030) ($MN)
73 South America Carbonation Machines in Beverage Market Outlook, By Distribution Channel (2021-2030) ($MN)
74 South America Carbonation Machines in Beverage Market Outlook, By Original Equipment Manufacturer (2021-2030) ($MN)
75 South America Carbonation Machines in Beverage Market Outlook, By Aftermarket Sales (2021-2030) ($MN)
76 Middle East & Africa Carbonation Machines in Beverage Market Outlook, By Country (2021-2030) ($MN)
77 Middle East & Africa Carbonation Machines in Beverage Market Outlook, By Type (2021-2030) ($MN)
78 Middle East & Africa Carbonation Machines in Beverage Market Outlook, By Carbonation Equipment (2021-2030) ($MN)
79 Middle East & Africa Carbonation Machines in Beverage Market Outlook, By Sugar Dissolvers (2021-2030) ($MN)
80 Middle East & Africa Carbonation Machines in Beverage Market Outlook, By Heat Exchangers (2021-2030) ($MN)
81 Middle East & Africa Carbonation Machines in Beverage Market Outlook, By Blenders & Mixers (2021-2030) ($MN)
82 Middle East & Africa Carbonation Machines in Beverage Market Outlook, By Filtration Equipment (2021-2030) ($MN)
83 Middle East & Africa Carbonation Machines in Beverage Market Outlook, By Silos (2021-2030) ($MN)
84 Middle East & Africa Carbonation Machines in Beverage Market Outlook, By Beverage Type (2021-2030) ($MN)
85 Middle East & Africa Carbonation Machines in Beverage Market Outlook, By Functional Drinks (2021-2030) ($MN)
86 Middle East & Africa Carbonation Machines in Beverage Market Outlook, By Club Soda & Sparkling Water (2021-2030) ($MN)
87 Middle East & Africa Carbonation Machines in Beverage Market Outlook, By Flavored Drinks (2021-2030) ($MN)
88 Middle East & Africa Carbonation Machines in Beverage Market Outlook, By Distribution Channel (2021-2030) ($MN)
89 Middle East & Africa Carbonation Machines in Beverage Market Outlook, By Original Equipment Manufacturer (2021-2030) ($MN) 90 Middle East & Africa Carbonation Machines in Beverage Market Outlook, By Aftermarket Sales (2021-2030) ($MN)
List of Figures
RESEARCH METHODOLOGY

We at ‘Stratistics’ opt for an extensive research approach which involves data mining, data validation, and data analysis. The various research sources include in-house repository, secondary research, competitor’s sources, social media research, client internal data, and primary research.
Our team of analysts prefers the most reliable and authenticated data sources in order to perform the comprehensive literature search. With access to most of the authenticated data bases our team highly considers the best mix of information through various sources to obtain extensive and accurate analysis.
Each report takes an average time of a month and a team of 4 industry analysts. The time may vary depending on the scope and data availability of the desired market report. The various parameters used in the market assessment are standardized in order to enhance the data accuracy.
Data Mining
The data is collected from several authenticated, reliable, paid and unpaid sources and is filtered depending on the scope & objective of the research. Our reports repository acts as an added advantage in this procedure. Data gathering from the raw material suppliers, distributors and the manufacturers is performed on a regular basis, this helps in the comprehensive understanding of the products value chain. Apart from the above mentioned sources the data is also collected from the industry consultants to ensure the objective of the study is in the right direction.
Market trends such as technological advancements, regulatory affairs, market dynamics (Drivers, Restraints, Opportunities and Challenges) are obtained from scientific journals, market related national & international associations and organizations.
Data Analysis
From the data that is collected depending on the scope & objective of the research the data is subjected for the analysis. The critical steps that we follow for the data analysis include:
- Product Lifecycle Analysis
- Competitor analysis
- Risk analysis
- Porters Analysis
- PESTEL Analysis
- SWOT Analysis
The data engineering is performed by the core industry experts considering both the Marketing Mix Modeling and the Demand Forecasting. The marketing mix modeling makes use of multiple-regression techniques to predict the optimal mix of marketing variables. Regression factor is based on a number of variables and how they relate to an outcome such as sales or profits.
Data Validation
The data validation is performed by the exhaustive primary research from the expert interviews. This includes telephonic interviews, focus groups, face to face interviews, and questionnaires to validate our research from all aspects. The industry experts we approach come from the leading firms, involved in the supply chain ranging from the suppliers, distributors to the manufacturers and consumers so as to ensure an unbiased analysis.
We are in touch with more than 15,000 industry experts with the right mix of consultants, CEO's, presidents, vice presidents, managers, experts from both supply side and demand side, executives and so on.
The data validation involves the primary research from the industry experts belonging to:
- Leading Companies
- Suppliers & Distributors
- Manufacturers
- Consumers
- Industry/Strategic Consultants
Apart from the data validation the primary research also helps in performing the fill gap research, i.e. providing solutions for the unmet needs of the research which helps in enhancing the reports quality.
For more details about research methodology, kindly write to us at info@strategymrc.com
Frequently Asked Questions
In case of any queries regarding this report, you can contact the customer service by filing the “Inquiry Before Buy” form available on the right hand side. You may also contact us through email: info@strategymrc.com or phone: +1-301-202-5929
Yes, the samples are available for all the published reports. You can request them by filling the “Request Sample” option available in this page.
Yes, you can request a sample with your specific requirements. All the customized samples will be provided as per the requirement with the real data masked.
All our reports are available in Digital PDF format. In case if you require them in any other formats, such as PPT, Excel etc you can submit a request through “Inquiry Before Buy” form available on the right hand side. You may also contact us through email: info@strategymrc.com or phone: +1-301-202-5929
We offer a free 15% customization with every purchase. This requirement can be fulfilled for both pre and post sale. You may send your customization requirements through email at info@strategymrc.com or call us on +1-301-202-5929.
We have 3 different licensing options available in electronic format.
- Single User Licence: Allows one person, typically the buyer, to have access to the ordered product. The ordered product cannot be distributed to anyone else.
- 2-5 User Licence: Allows the ordered product to be shared among a maximum of 5 people within your organisation.
- Corporate License: Allows the product to be shared among all employees of your organisation regardless of their geographical location.
All our reports are typically be emailed to you as an attachment.
To order any available report you need to register on our website. The payment can be made either through CCAvenue or PayPal payments gateways which accept all international cards.
We extend our support to 6 months post sale. A post sale customization is also provided to cover your unmet needs in the report.
Request Customization
We provide a free 15% customization on every purchase. This requirement can be fulfilled for both pre and post sale. You may send your customization requirements through email at info@strategymrc.com or call us on +1-301-202-5929.
Note: This customization is absolutely free until it falls under the 15% bracket. If your requirement exceeds this a feasibility check will be performed. Post that, a quote will be provided along with the timelines.
WHY CHOOSE US ?

Assured Quality
Best in class reports with high standard of research integrity

24X7 Research Support
Continuous support to ensure the best customer experience.

Free Customization
Adding more values to your product of interest.

Safe & Secure Access
Providing a secured environment for all online transactions.

Trusted by 600+ Brands
Serving the most reputed brands across the world.