
Cloud Advertising Market
Cloud Advertising Market Forecasts to 2030 - Global Analysis By Service Type (Software as a Service (SaaS), Platform as a Service (PaaS) and Infrastructure as a Service (IaaS)),Deployment Model (Private Cloud, Hybrid Cloud and Public Cloud), User Group, Component, Application, End User and By Geography

|
Years Covered |
2021-2030 |
|
Estimated Year Value (2023) |
US $4.02 MN |
|
Projected Year Value (2030) |
US $15.82 MN |
|
CAGR (2023 - 2030) |
21.6% |
|
Regions Covered |
North America, Europe, Asia Pacific, South America, and Middle East & Africa |
|
Countries Covered |
US, Canada, Mexico, Germany, UK, Italy, France, Spain, Japan, China, India, Australia, New Zealand, South Korea, Rest of Asia Pacific, South America, Argentina, Brazil, Chile, Middle East & Africa, Saudi Arabia, UAE, Qatar, and South Africa |
|
Largest Market |
Asia Pacific |
|
Highest Growing Market |
North America |
According to Stratistics MRC, the Global Cloud Advertising Market is accounted for $4.02 billion in 2023 and is expected to reach $15.82 billion by 2030 growing at a CAGR of 21.6% during the forecast period. Cloud-based services that enable transactions, data linked to advertisements, and product selection are referred to as "cloud advertising," with the price and content determined when the end user accesses the service. The market for cloud advertising is growing as an outcome of the increased demand for consumer analytics and personalized marketing. Cloud advertising can be used in different e-commerce or brick-and-mortar commerce strategies such as auctions, coupons and other discounting or advertising techniques.
Market Dynamics:
Driver:
Increased use of cloud computing and services
The rise in market revenue is also being driven by the increase in the adoption of cloud computing and services. This is because cloud computing offers a variety of advantages, especially cloud security. Cloud computing offers high levels of security that shield enterprises from dangerous spyware, viruses and hackers. Due to this, the websites of such companies are secure and help rebuild client confidence, which improves the user experience. Additionally, it makes it simple for business enterprises and their personnel to cooperate and share ideas and solutions, cloud computing makes it simple to access client data for customizing digital marketing strategies.
Restraint:
Security risks and privacy concerns
Various security risks and privacy concerns associated with the implementation of e-commerce hinder the adoption of cloud advertising. End-users need to spend more on effectively deploying cyber security processes and systems to make e-commerce safer and more secure. Cloud advertising handles the confidential data of customers, including contact details, future orders and contracts, shipping details, and details about other partner vendors. Moreover, any security breach can be a significant risk in terms of financial losses and loss of customers and affect the brand's reputation. Hence, data privacy and security concerns are expected to hinder the growth of the global market during the forecast period.
Opportunity:
Cost-effective & customized advertising
The main advantages of cloud advertising are that it is more cost-effective because it does not require the conventional techniques of printing portfolios, using media like radio or television, or mailing brochures. It also offers faster advertising through online platforms and more customized advertising because it can use a number of online platforms and media to promote businesses' marketing objectives according to their requirements. Due to this, large corporations are creating cloud-based advertising software with better and more complex technological features, which is driving market revenue development.
Threat:
Efficient data utilization
The data used in consumer analytics is collected from many sources and distributed to various organizational groups, particularly marketing, sales, and R&D. Businesses must categorize the data they collect from various touch points to correspond with the wants and demands of their clients. Organizations find it challenging to merge data collected from many touch points because they must be structured differently. Examples of these touch points involve company websites, the web, mobile devices, social media, and emails. When corporate data is not synchronized, customer analytics are not useful. A great deal of time, money, and experience are needed for the analysis of both structured and unstructured data.
Covid-19 Impact
The cloud advertising business benefited from COVID-19. Lockdown was enforced by governments in several nations, which caused many businesses, stores, IT and telecom companies, and educational institutions to close. The demand for online shopping has risen significantly after COVID-19 as a result of people's ability to choose a product on an e-commerce platform while relaxing in the comfort of their own residences. Additionally, many businesses suffered greatly as a result of COVID-19 because employees were unable to work from offices and retail establishments. The number of consumers adopting digital channels for information, entertainment, education, and keeping in touch with friends and family has skyrocketed.
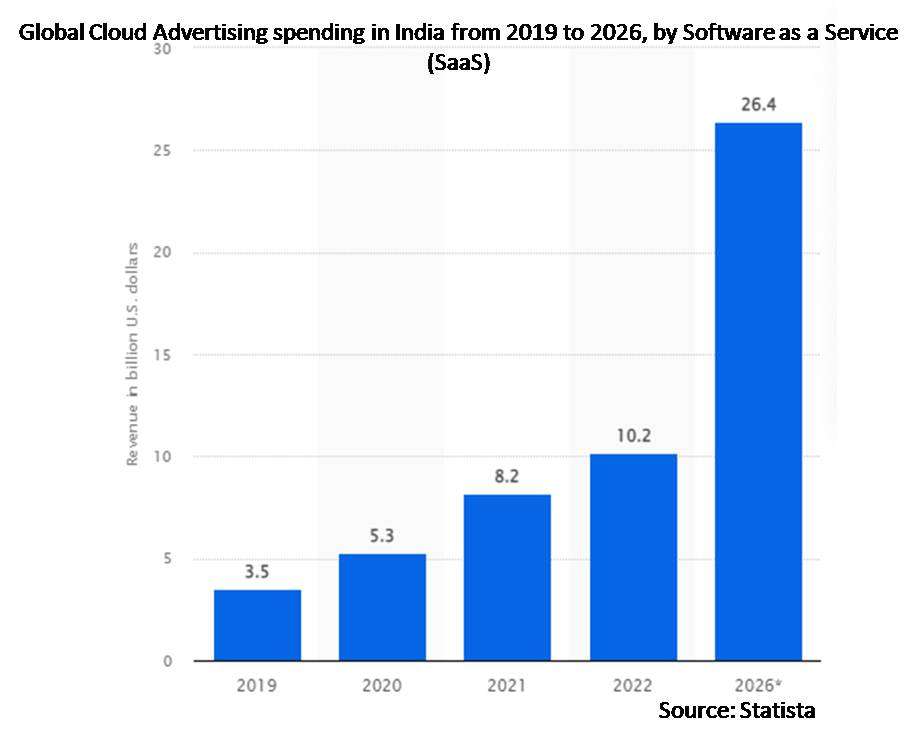
The software as a service (SaaS) segment is expected to be the largest during the forecast period
The Software as a Service (SaaS) segment is estimated to have a lucrative growth. Customers can purchase services for cloud applications from organizations that operate within the Software as a Service (SaaS) paradigm. Because the providers exercise authority over IT development, customers can benefit from SaaS products' convenience. Some of SaaS's primary advantages are flexible payment options, flexible usage, automated updates, accessibility, permanence, and adaptation. Additionally, this segment's revenue is growing as a result of the rapid adoption of technical improvements, new systems introduced by multiple organizations, and various activities undertaken by various companies.
The large enterprises segment is expected to have the highest CAGR during the forecast period
The large enterprises segment is anticipated to witness the fastest CAGR growth during the forecast period, due to cloud-based advertising production systems, advertisers of large companies and enterprises have the opportunity to design more efficient processes without being restricted by the movement of enormous amounts of data. Cost savings, quick on boarding processes, access to data when working remotely, straightforward operations that interact more efficiently, enhanced workflow management, less time spent on tedious tasks, and system integration are some of the advantages of cloud computing for large businesses. This segment's revenue growth has been fueled by numerous new improvements and partnerships formed by different organizations to increase innovation in the market.
Region with largest share:
Asia Pacific is projected to hold the largest market share during the forecast period owing to during the projected period. The rapid economic development of surrounding developing nations like China, Malaysia, Indonesia, and India is the primary reason for the region's expansion. The need for cloud-driven and cloud-supported advertising is growing in the APAC region, driving increasing costs and advances in technology across several industries. Moreover, the region is expected to offer significant growth opportunities like rise in the use of cutting-edge technologies, and the development of applications across a range of industries are projected to propel the region's growth throughout the forecast period.
Region with highest CAGR:
North America is projected to have the highest CAGR over the forecast period. It is projected that increased demand for an improved cloud advertising platform will drive the market for cloud advertising in this area. The existence of significant market participants, including IBM Corporation, Sales force, and Oracle Corporation. These players participate in partnerships, acquisitions, and the creation of new products, and enhancements to existing ones, which promotes market expansion in this region.

Key players in the market
Some of the key players profiled in the Cloud Advertising Market include Google LLC, Oracle Corporation, Viant Technology, LLC, IBM Corporation, Marin Software, Sprinklr Inc, Salesforce.Com, Inc., Adobe Systems Incorporated, Kubient, Imagine Communications Corp, Hub Spot, Fico, Media Math, Amazon Web Services Inc. and In Mobi Pte. Ltd.
Key Developments:
In August 2023, Marin Software, a leading provider of digital marketing solutions, is proud to announce the launch of two powerful products, Connect and Ascend. These new products give performance marketers unprecedented insights and AI-powered tools to improve results across performance marketing channels, including paid search, social, app advertising, and retail media. Connect revolutionizes how marketers access, analyze and share their data. Ascend offers a unified approach to allocating spends across channels for optimal performance.
In May 2023, Google has launched a new bug bounty program for its Android apps. Under the Mobile Vulnerability Rewards Program (Mobile VRP), the tech giant will pay security researchers for flaws found in first-party apps. The official Twitter account of Google VRP has also shared a post announcing the latest bug bounty program.
Service Types Covered:
• Software as a Service (SaaS)
• Platform as a Service (PaaS)
• Infrastructure as a Service (IaaS)
Deployment Models Covered:
• Private Cloud
• Hybrid Cloud
• Public Cloud
User Groups Covered:
• Small & Medium Size Enterprises(SMEs)
• Large Enterprises
Components Covered:
• Platforms
• Services
Applications Covered:
• Customer Management
• Campaign Management
• Real-Time Engagement
• Experience Management
• Analytics and Insights
End Users Covered:
• Media and Entertainment
• Travel and Hospitality
• Retail and Consumer Goods
• Manufacturing
• Telecommunications
• Education
• Banking, Financial Services, and Insurance
• Other End Users
Regions Covered:
• North America
o US
o Canada
o Mexico
• Europe
o Germany
o UK
o Italy
o France
o Spain
o Rest of Europe
• Asia Pacific
o Japan
o China
o India
o Australia
o New Zealand
o South Korea
o Rest of Asia Pacific
• South America
o Argentina
o Brazil
o Chile
o Rest of South America
• Middle East & Africa
o Saudi Arabia
o UAE
o Qatar
o South Africa
o Rest of Middle East & Africa
What our report offers:
- Market share assessments for the regional and country-level segments
- Strategic recommendations for the new entrants
- Covers Market data for the years 2021, 2022, 2023, 2026, and 2030
- Market Trends (Drivers, Constraints, Opportunities, Threats, Challenges, Investment Opportunities, and recommendations)
- Strategic recommendations in key business segments based on the market estimations
- Competitive landscaping mapping the key common trends
- Company profiling with detailed strategies, financials, and recent developments
- Supply chain trends mapping the latest technological advancements
Free Customization Offerings:
All the customers of this report will be entitled to receive one of the following free customization options:
• Company Profiling
o Comprehensive profiling of additional market players (up to 3)
o SWOT Analysis of key players (up to 3)
• Regional Segmentation
o Market estimations, Forecasts and CAGR of any prominent country as per the client's interest (Note: Depends on feasibility check)
• Competitive Benchmarking
o Benchmarking of key players based on product portfolio, geographical presence, and strategic alliances
Table of Contents
1 Executive Summary
2 Preface
2.1 Abstract
2.2 Stake Holders
2.3 Research Scope
2.4 Research Methodology
2.4.1 Data Mining
2.4.2 Data Analysis
2.4.3 Data Validation
2.4.4 Research Approach
2.5 Research Sources
2.5.1 Primary Research Sources
2.5.2 Secondary Research Sources
2.5.3 Assumptions
3 Market Trend Analysis
3.1 Introduction
3.2 Drivers
3.3 Restraints
3.4 Opportunities
3.5 Threats
3.6 Application Analysis
3.7 End User Analysis
3.8 Emerging Markets
3.9 Impact of Covid-19
4 Porters Five Force Analysis
4.1 Bargaining power of suppliers
4.2 Bargaining power of buyers
4.3 Threat of substitutes
4.4 Threat of new entrants
4.5 Competitive rivalry
5 Global Cloud Advertising Market, By Service Type
5.1 Introduction
5.2 Software as a Service (SaaS)
5.3 Platform as a Service (PaaS)
5.4 Infrastructure as a Service (IaaS)
6 Global Cloud Advertising Market, By Deployment Model
6.1 Introduction
6.2 Private Cloud
6.3 Hybrid Cloud
6.4 Public Cloud
7 Global Cloud Advertising Market, By Organization Size
7.1 Introduction
7.2 Small & Medium Size Enterprises(SMEs)
7.3 Large Enterprises
8 Global Cloud Advertising Market, By Component
8.1 Introduction
8.2 Platforms
8.3 Services
9 Global Cloud Advertising Market, By Application
9.1 Introduction
9.2 Customer Management
9.3 Campaign Management
9.4 Real-Time Engagement
9.5 Experience Management
9.6 Analytics and Insights
10 Global Cloud Advertising Market, By End User
10.1 Introduction
10.2 Media and Entertainment
10.3 Travel and Hospitality
10.4 Retail and Consumer Goods
10.5 Manufacturing
10.6 Telecommunications
10.7 Education
10.8 Banking, Financial Services, and Insurance
10.9 Other End Users
11 Global Cloud Advertising Market, By Geography
11.1 Introduction
11.2 North America
11.2.1 US
11.2.2 Canada
11.2.3 Mexico
11.3 Europe
11.3.1 Germany
11.3.2 UK
11.3.3 Italy
11.3.4 France
11.3.5 Spain
11.3.6 Rest of Europe
11.4 Asia Pacific
11.4.1 Japan
11.4.2 China
11.4.3 India
11.4.4 Australia
11.4.5 New Zealand
11.4.6 South Korea
11.4.7 Rest of Asia Pacific
11.5 South America
11.5.1 Argentina
11.5.2 Brazil
11.5.3 Chile
11.5.4 Rest of South America
11.6 Middle East & Africa
11.6.1 Saudi Arabia
11.6.2 UAE
11.6.3 Qatar
11.6.4 South Africa
11.6.5 Rest of Middle East & Africa
12 Key Developments
12.1 Agreements, Partnerships, Collaborations and Joint Ventures
12.2 Acquisitions & Mergers
12.3 New Product Launch
12.4 Expansions
12.5 Other Key Strategies
13 Company Profiling
13.1 Google LLC
13.2 Oracle Corporation
13.3 Viant Technology, LLC
13.4 IBM Corporation
13.5 Marin Software
13.6 Sprinklr Inc
13.7 Salesforce.Com, Inc.
13.8 Adobe Systems Incorporated
13.9 Kubient
13.10 Imagine Communications Corp
13.11 HubSpot
13.12 Fico
13.13 MediaMath
13.14 Amazon Web Services Inc.
13.15 InMobi Pte. Ltd
List of Tables
1 Global Cloud Advertising Market Outlook, By Region (2021-2030) ($MN)
2 Global Cloud Advertising Market Outlook, By Service Type (2021-2030) ($MN)
3 Global Cloud Advertising Market Outlook, By Software as a Service (SaaS) (2021-2030) ($MN)
4 Global Cloud Advertising Market Outlook, By Platform as a Service (PaaS) (2021-2030) ($MN)
5 Global Cloud Advertising Market Outlook, By Infrastructure as a Service (IaaS) (2021-2030) ($MN)
6 Global Cloud Advertising Market Outlook, By Deployment Model (2021-2030) ($MN)
7 Global Cloud Advertising Market Outlook, By Private Cloud (2021-2030) ($MN)
8 Global Cloud Advertising Market Outlook, By Hybrid Cloud (2021-2030) ($MN)
9 Global Cloud Advertising Market Outlook, By Public Cloud (2021-2030) ($MN)
10 Global Cloud Advertising Market Outlook, By Organization Size (2021-2030) ($MN)
11 Global Cloud Advertising Market Outlook, By Small & Medium Size Enterprises(SMEs) (2021-2030) ($MN)
12 Global Cloud Advertising Market Outlook, By Large Enterprises (2021-2030) ($MN)
13 Global Cloud Advertising Market Outlook, By Component (2021-2030) ($MN)
14 Global Cloud Advertising Market Outlook, By Platforms (2021-2030) ($MN)
15 Global Cloud Advertising Market Outlook, By Services (2021-2030) ($MN)
16 Global Cloud Advertising Market Outlook, By Application (2021-2030) ($MN)
17 Global Cloud Advertising Market Outlook, By Customer Management (2021-2030) ($MN)
18 Global Cloud Advertising Market Outlook, By Campaign Management (2021-2030) ($MN)
19 Global Cloud Advertising Market Outlook, By Real-Time Engagement (2021-2030) ($MN)
20 Global Cloud Advertising Market Outlook, By Experience Management (2021-2030) ($MN)
21 Global Cloud Advertising Market Outlook, By Analytics and Insights (2021-2030) ($MN)
22 Global Cloud Advertising Market Outlook, By End User (2021-2030) ($MN)
23 Global Cloud Advertising Market Outlook, By Media and Entertainment (2021-2030) ($MN)
24 Global Cloud Advertising Market Outlook, By Travel and Hospitality (2021-2030) ($MN)
25 Global Cloud Advertising Market Outlook, By Retail and Consumer Goods (2021-2030) ($MN)
26 Global Cloud Advertising Market Outlook, By Manufacturing (2021-2030) ($MN)
27 Global Cloud Advertising Market Outlook, By Telecommunications (2021-2030) ($MN)
28 Global Cloud Advertising Market Outlook, By Education (2021-2030) ($MN)
29 Global Cloud Advertising Market Outlook, By Banking, Financial Services, and Insurance (2021-2030) ($MN)
30 Global Cloud Advertising Market Outlook, By Other End Users (2021-2030) ($MN)
Note: Tables for North America, Europe, APAC, South America, and Middle East & Africa Regions are also represented in the same manner as above.
List of Figures
List of Figures
Figure 1 Global Cloud Advertising Market Outlook (2021-2030) ($MN)
Figure 2 North America Cloud Advertising Market Outlook (2021-2030) ($MN)
Figure 3 US Cloud Advertising Market Outlook (2021-2030) ($MN)
Figure 4 Canada Cloud Advertising Market Outlook (2021-2030) ($MN)
Figure 5 Mexico Cloud Advertising Market Outlook (2021-2030) ($MN)
Figure 6 Europe Cloud Advertising Market Outlook (2021-2030) ($MN)
Figure 7 Germany Cloud Advertising Market Outlook (2021-2030) ($MN)
Figure 8 UK Cloud Advertising Market Outlook (2021-2030) ($MN)
Figure 9 Italy Cloud Advertising Market Outlook (2021-2030) ($MN)
Figure 10 France Cloud Advertising Market Outlook (2021-2030) ($MN)
Figure 11 Spain Cloud Advertising Market Outlook (2021-2030) ($MN)
Figure 12 Rest of Europe Cloud Advertising Market Outlook (2021-2030) ($MN)
Figure 13 Asia Pacific Cloud Advertising Market Outlook (2021-2030) ($MN)
Figure 14 Japan Cloud Advertising Market Outlook (2021-2030) ($MN)
Figure 15 China Cloud Advertising Market Outlook (2021-2030) ($MN)
Figure 16 India Cloud Advertising Market Outlook (2021-2030) ($MN)
Figure 17 Australia Cloud Advertising Market Outlook (2021-2030) ($MN)
Figure 18 New Zealand Cloud Advertising Market Outlook (2021-2030) ($MN)
Figure 19 South Korea Cloud Advertising Market Outlook (2021-2030) ($MN)
Figure 20 Rest of Asia Pacific Cloud Advertising Market Outlook (2021-2030) ($MN)
Figure 21 South America Cloud Advertising Market Outlook (2021-2030) ($MN)
Figure 22 Argentina Cloud Advertising Market Outlook (2021-2030) ($MN)
Figure 23 Brazil Cloud Advertising Market Outlook (2021-2030) ($MN)
Figure 24 Chile Cloud Advertising Market Outlook (2021-2030) ($MN)
Figure 25 Rest of South America Cloud Advertising Market Outlook (2021-2030) ($MN)
Figure 26 Middle East & Africa Cloud Advertising Market Outlook (2021-2030) ($MN)
Figure 27 Saudi Arabia Cloud Advertising Market Outlook (2021-2030) ($MN)
Figure 28 UAE Cloud Advertising Market Outlook (2021-2030) ($MN)
Figure 29 Qatar Cloud Advertising Market Outlook (2021-2030) ($MN)
Figure 30 South Africa Cloud Advertising Market Outlook (2021-2030) ($MN)
Figure 31 Rest of Middle East & Africa Cloud Advertising Market Outlook (2021-2030) ($MN)
RESEARCH METHODOLOGY

We at ‘Stratistics’ opt for an extensive research approach which involves data mining, data validation, and data analysis. The various research sources include in-house repository, secondary research, competitor’s sources, social media research, client internal data, and primary research.
Our team of analysts prefers the most reliable and authenticated data sources in order to perform the comprehensive literature search. With access to most of the authenticated data bases our team highly considers the best mix of information through various sources to obtain extensive and accurate analysis.
Each report takes an average time of a month and a team of 4 industry analysts. The time may vary depending on the scope and data availability of the desired market report. The various parameters used in the market assessment are standardized in order to enhance the data accuracy.
Data Mining
The data is collected from several authenticated, reliable, paid and unpaid sources and is filtered depending on the scope & objective of the research. Our reports repository acts as an added advantage in this procedure. Data gathering from the raw material suppliers, distributors and the manufacturers is performed on a regular basis, this helps in the comprehensive understanding of the products value chain. Apart from the above mentioned sources the data is also collected from the industry consultants to ensure the objective of the study is in the right direction.
Market trends such as technological advancements, regulatory affairs, market dynamics (Drivers, Restraints, Opportunities and Challenges) are obtained from scientific journals, market related national & international associations and organizations.
Data Analysis
From the data that is collected depending on the scope & objective of the research the data is subjected for the analysis. The critical steps that we follow for the data analysis include:
- Product Lifecycle Analysis
- Competitor analysis
- Risk analysis
- Porters Analysis
- PESTEL Analysis
- SWOT Analysis
The data engineering is performed by the core industry experts considering both the Marketing Mix Modeling and the Demand Forecasting. The marketing mix modeling makes use of multiple-regression techniques to predict the optimal mix of marketing variables. Regression factor is based on a number of variables and how they relate to an outcome such as sales or profits.
Data Validation
The data validation is performed by the exhaustive primary research from the expert interviews. This includes telephonic interviews, focus groups, face to face interviews, and questionnaires to validate our research from all aspects. The industry experts we approach come from the leading firms, involved in the supply chain ranging from the suppliers, distributors to the manufacturers and consumers so as to ensure an unbiased analysis.
We are in touch with more than 15,000 industry experts with the right mix of consultants, CEO's, presidents, vice presidents, managers, experts from both supply side and demand side, executives and so on.
The data validation involves the primary research from the industry experts belonging to:
- Leading Companies
- Suppliers & Distributors
- Manufacturers
- Consumers
- Industry/Strategic Consultants
Apart from the data validation the primary research also helps in performing the fill gap research, i.e. providing solutions for the unmet needs of the research which helps in enhancing the reports quality.
For more details about research methodology, kindly write to us at info@strategymrc.com
Frequently Asked Questions
In case of any queries regarding this report, you can contact the customer service by filing the “Inquiry Before Buy” form available on the right hand side. You may also contact us through email: info@strategymrc.com or phone: +1-301-202-5929
Yes, the samples are available for all the published reports. You can request them by filling the “Request Sample” option available in this page.
Yes, you can request a sample with your specific requirements. All the customized samples will be provided as per the requirement with the real data masked.
All our reports are available in Digital PDF format. In case if you require them in any other formats, such as PPT, Excel etc you can submit a request through “Inquiry Before Buy” form available on the right hand side. You may also contact us through email: info@strategymrc.com or phone: +1-301-202-5929
We offer a free 15% customization with every purchase. This requirement can be fulfilled for both pre and post sale. You may send your customization requirements through email at info@strategymrc.com or call us on +1-301-202-5929.
We have 3 different licensing options available in electronic format.
- Single User Licence: Allows one person, typically the buyer, to have access to the ordered product. The ordered product cannot be distributed to anyone else.
- 2-5 User Licence: Allows the ordered product to be shared among a maximum of 5 people within your organisation.
- Corporate License: Allows the product to be shared among all employees of your organisation regardless of their geographical location.
All our reports are typically be emailed to you as an attachment.
To order any available report you need to register on our website. The payment can be made either through CCAvenue or PayPal payments gateways which accept all international cards.
We extend our support to 6 months post sale. A post sale customization is also provided to cover your unmet needs in the report.
Request Customization
We provide a free 15% customization on every purchase. This requirement can be fulfilled for both pre and post sale. You may send your customization requirements through email at info@strategymrc.com or call us on +1-301-202-5929.
Note: This customization is absolutely free until it falls under the 15% bracket. If your requirement exceeds this a feasibility check will be performed. Post that, a quote will be provided along with the timelines.
WHY CHOOSE US ?

Assured Quality
Best in class reports with high standard of research integrity

24X7 Research Support
Continuous support to ensure the best customer experience.

Free Customization
Adding more values to your product of interest.

Safe & Secure Access
Providing a secured environment for all online transactions.

Trusted by 600+ Brands
Serving the most reputed brands across the world.