
Delivery Robots Market
Delivery Robots Market Forecasts to 2028 - Global Analysis By Load Carrying Capacity (50-100 Kgs, 0.5 - 2 Kgs , 10-50 Kgs, >100 Kgs, < 0.5 Kgs, 2-10 Kgs), Number Of Wheels (6 Wheels, 4 Wheels, 3 Wheels), Components (Software, Hardware), Speed Limit (Higher than 6 KPH, 3 KPH, Higher than 3 KPH up to 6 KPH), Operation (Remote Operated, Autonomous), End User (Healthcare, Food & Beverages, Retail, Postal, E- Commerce, Logistic (Courier Parcels)), and Geography

|
Years Covered |
2020-2028 |
|
Estimated Year Value (2022) |
US $290 BN |
|
Projected Year Value (2028) |
US $1930 BN |
|
CAGR (2022 - 2028) |
37.1% |
|
Regions Covered |
North America, Europe, Asia Pacific, South America, and Middle East & Africa |
|
Countries Covered |
US, Canada, Mexico, Germany, UK, Italy, France, Spain, Japan, China, India, Australia, New Zealand, South Korea, Rest of Asia Pacific, South America, Argentina, Brazil, Chile, Middle East & Africa, Saudi Arabia, UAE, Qatar, and South Africa |
|
Largest Market |
North America |
|
Highest Growing Market |
Asia Pacific |
According to Stratistics MRC, the Global Delivery Robots Market is accounted for $290 billion in 2022 and is expected to reach $1930 billion by 2028 growing at a CAGR of 37.1% during the forecast period. A delivery robot that delivers packages automatically and to your door is called Delivery Robot. These robots don't move and communicate like people do; instead, they look kind and are attractive delivery vehicles with four, six, or more wheels that resemble hulks. The robot travels to the seller to purchase goods, beverages, meals, and other items before heading in your direction.
According to the Bureau of Labor Statistics, the need for nurses is expected to increase by 16%, reaching 3.2 million in 2024 from 2.7 million in 2014 in the United States. The aging baby boomers that need additional care will drive much of the growth. Moreover, the spending in the healthcare sector is increasing daily, indicating the adoption of delivery robots.
Market Dynamics:
Driver:
Reduction in delivery costs
The final phase of product distribution, as from distribution centre to the end user, accounts for over 29% of the entire transportation cost in many supply cables. Crowding in metropolitan areas, remote locations, unacceptable or incorrect contact info, and a simple manpower scarcity for providing on-demand delivery services are additional factors that hinder delivery. All of these characteristics prevent this segment's optimization. Customers in the realm of electronic commerce are not just picky, but they also prefer to get high-quality goods for less money. In addition to offering clients greater appropriateness at a lower cost, the use of delivery robots in e-commerce will also significantly alter the rival website.
Restraint:
Severe protocols relating to operations
Delivery robots are required to operate within a legal, regulated framework since they use pedestrian-friendly public circulation areas. If the delivery robot harms or injures a user or close person, the majority of western permit authorities deem the maker liable for the crime of negligence.
Opportunity:
Growing adoption of delivery robots
Some of the key factors anticipated to propel the growth of the worldwide delivery robots market include rapid industrialization, rising use of delivery robots by online sellers and the medical sector, and developing need for fast turnaround services with an increase in the e-commerce industry. Additionally, the market is expected to increase as delivery robots are being used in the food and beverage industry to enable doorstep delivery to clients. In order to transport meals without human intervention, the top companies in the food sector have joined with makers of delivery robots. Robot functioning has been increased thanks to technological advancements in delivery robots, like the incorporation of AI and ML, which has boosted market growth. The market will develop as a result of additional reasons such the robotics venture allowance, increased investment by top businesses, and expanding use of drones in the commercial sector.
Threat:
Lack of awareness
Even though the global market for delivery robots is growing rapidly, some issues are limiting its expansion. Due to the fact that delivery robots operate in areas with high public traffic, governments in a number of developing nations have imposed strict laws and restrictions on how they must operate. Additionally, the high cost associated with producing these delivery robots limits market expansion on a global scale because many developing nations cannot afford it. The development is hampered by a lack of awareness and an absence of these robots in a number of countries.
Covid-19 Impact
The introduction of the COVID-19 epidemic has now reached a global scale and has had an impact on the growth of the market for delivery robots. During the projection period, there is expected to be a growth in global sales of delivery robots for important industries like food & beverage, healthcare, and retail. The government-imposed social segregation laws in several nations have fueled the expansion because delivery robots don't require social interaction. Delivery robots have already been embraced by the food and beverage industries throughout this time, assisting consumers with grocery shopping and restaurant delivery.
The 4 wheels segment is expected to be the largest during the forecast period
The 4 wheels segment is estimated to have a lucrative growth. Companies suggest using four-wheeled robots to deliver items including grocery, food orders, packages, flowers, and cartons. With four-wheeled robots, reducing the distance between both the rear and front sets of wheels will improve zero-radius rotation in any desired track. Therefore, delivery robots with four wheels claimed having the biggest market share.
The Hardware segment is expected to have the highest CAGR during the forecast period
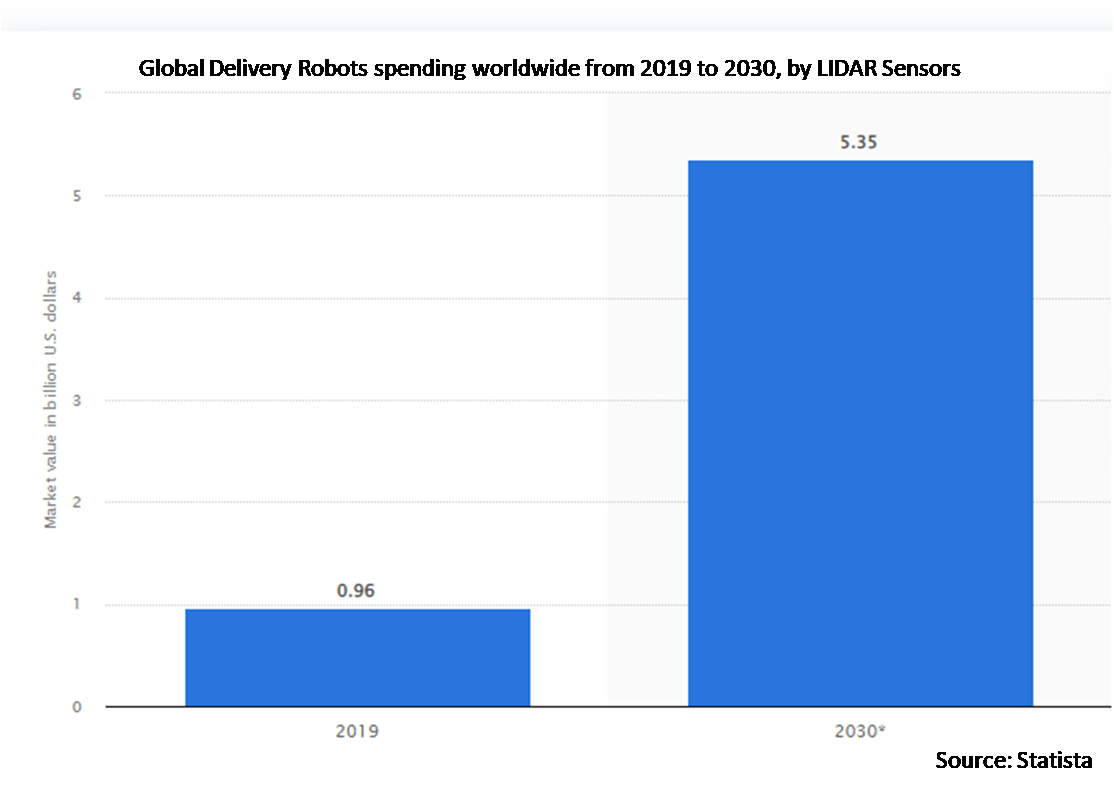
The Hardware segment is anticipated to witness the fastest CAGR growth during the forecast period, due to the more expensive devices, such LiDAR sensors and radars, make up the larger market segment for hardware. However, because of the increasing demand for delivery robots featuring auto navigation as well as autonomous decision-making abilities, the market for hardware devices is anticipated to expand at a faster CAGR over the forecast period.
Region with largest share:
North America is projected to hold the largest market share during the forecast period. This region is home to many large market suppliers as well as a sizable number of manufacturers and start-ups seeking to advance autonomous delivery robotic technology. Additionally, the region has a larger penetration of autonomous delivery robots among different end-users than other parts of the world. The demand for these robots is growing in the hospitality, retail, and logistics sectors; many players in the retail and hospitality industries are working with manufacturers to get a hands-on look at the prototypes.
Region with highest CAGR:
Asia Pacific is projected to have the highest CAGR over the forecast period, owing to the region's extensive e-commerce industry, many merchants are investing in and expanding their supply chains, which has led to large expenditures in the autonomous delivery robots market. Additionally, a large number of end-user businesses are switching to autonomous robots, which is dramatically accelerating the expansion of the ADR industry in the area. The delivery robot's autonomous last-mile delivery capabilities eliminate the need for automobiles by delivering packages to Amazon Prime members from urban distribution centres.

Key players in the market
Some of the key players profiled in the Delivery Robots Market include Boston Dynamics, Robby Technologies, Starship Technologies, Amazon Robotics, Panasonic System Solutions Asia Pacific, Robomart, Ottonomy IO, Segway Robotics, Eliport , Nuro , Savioke and Postmates.
Key Developments:
In September 2020, a partnership was made between Save Mart Companies and Starship Technologies for providing on-demand delivery.
In May 2020, Nuro LLC partnered with CVS Pharmacy to start delivering prescriptions through driverless vehicles.
Load Carrying Capacities Covered:
• 50-100 Kgs
• 0.5 - 2 Kgs
• 10-50 Kgs
• >100 Kgs
• < 0.5 Kgs
• 2-10 Kgs
• Other Load Carrying Capacities
Number Of Wheels Covered:
• 6 Wheels
• 4 Wheels
• 3 Wheels
Components Covered:
• Software
• Hardware
Speed Limits Covered:
• Higher than 6 KPH
• 3 KPH
• Higher than 3 KPH up to 6 KPH
Operations Covered:
• Remote Operated
• Autonomous
End Users Covered:
• Healthcare
• Food & Beverages
• Retail
• Postal
• E- Commerce
• Logistic (Courier Parcels)
Regions Covered:
• North America
o US
o Canada
o Mexico
• Europe
o Germany
o UK
o Italy
o France
o Spain
o Rest of Europe
• Asia Pacific
o Japan
o China
o India
o Australia
o New Zealand
o South Korea
o Rest of Asia Pacific
• South America
o Argentina
o Brazil
o Chile
o Rest of South America
• Middle East & Africa
o Saudi Arabia
o UAE
o Qatar
o South Africa
o Rest of Middle East & Africa
What our report offers:
- Market share assessments for the regional and country-level segments
- Strategic recommendations for the new entrants
- Covers Market data for the years 2020, 2021, 2022, 2025, and 2028
- Market Trends (Drivers, Constraints, Opportunities, Threats, Challenges, Investment Opportunities, and recommendations)
- Strategic recommendations in key business segments based on the market estimations
- Competitive landscaping mapping the key common trends
- Company profiling with detailed strategies, financials, and recent developments
- Supply chain trends mapping the latest technological advancements
Free Customization Offerings:
All the customers of this report will be entitled to receive one of the following free customization options:
• Company Profiling
o Comprehensive profiling of additional market players (up to 3)
o SWOT Analysis of key players (up to 3)
• Regional Segmentation
o Market estimations, Forecasts and CAGR of any prominent country as per the client's interest (Note: Depends on feasibility check)
• Competitive Benchmarking
o Benchmarking of key players based on product portfolio, geographical presence, and strategic alliances
Table of Contents
1 Executive Summary
2 Preface
2.1 Abstract
2.2 Stake Holders
2.3 Research Scope
2.4 Research Methodology
2.4.1 Data Mining
2.4.2 Data Analysis
2.4.3 Data Validation
2.4.4 Research Approach
2.5 Research Sources
2.5.1 Primary Research Sources
2.5.2 Secondary Research Sources
2.5.3 Assumptions
3 Market Trend Analysis
3.1 Introduction
3.2 Drivers
3.3 Restraints
3.4 Opportunities
3.5 Threats
3.6 End User Analysis
3.7 Emerging Markets
3.8 Impact of Covid-19
4 Porters Five Force Analysis
4.1 Bargaining power of suppliers
4.2 Bargaining power of buyers
4.3 Threat of substitutes
4.4 Threat of new entrants
4.5 Competitive rivalry
5 Global Delivery Robots Market, By Load Carrying Capacity
5.1 Introduction
5.2 50-100 Kgs
5.3 0.5 - 2 Kgs
5.4 10-50 Kgs
5.5 >100 Kgs
5.6 < 0.5 Kgs
5.7 2-10 Kgs
5.8 Other Load Carrying Capacities
6 Global Delivery Robots Market, By Number Of Wheels
6.1 Introduction
6.2 6 Wheels
6.3 4 Wheels
6.4 3 Wheels
7 Global Delivery Robots Market, By Components
7.1 Introduction
7.2 Software
7.2.1 Computer Vision
7.2.2 Fleet Management Software
7.3 Hardware
7.3.1 Control Systems
7.3.2 Ultrasonic/ LIDAR Sensors
7.3.3 Chassis and Motors
7.3.4 GPS
7.3.5 Radars
7.3.6 Cameras
8 Global Delivery Robots Market, By Speed Limit
8.1 Introduction
8.2 Higher than 6 KPH
8.3 3 KPH
8.4 Higher than 3 KPH up to 6 KPH
9 Global Delivery Robots Market, By Operation
9.1 Introduction
9.2 Remote Operated
9.3 Autonomous
10 Global Delivery Robots Market, By End User
10.1 Introduction
10.2 Healthcare
10.3 Food & Beverages
10.4 Retail
10.5 Postal
10.6 E- Commerce
10.7 Logistic (Courier Parcels)
11 Global Delivery Robots Market, By Geography
11.1 Introduction
11.2 North America
11.2.1 US
11.2.2 Canada
11.2.3 Mexico
11.3 Europe
11.3.1 Germany
11.3.2 UK
11.3.3 Italy
11.3.4 France
11.3.5 Spain
11.3.6 Rest of Europe
11.4 Asia Pacific
11.4.1 Japan
11.4.2 China
11.4.3 India
11.4.4 Australia
11.4.5 New Zealand
11.4.6 South Korea
11.4.7 Rest of Asia Pacific
11.5 South America
11.5.1 Argentina
11.5.2 Brazil
11.5.3 Chile
11.5.4 Rest of South America
11.6 Middle East & Africa
11.6.1 Saudi Arabia
11.6.2 UAE
11.6.3 Qatar
11.6.4 South Africa
11.6.5 Rest of Middle East & Africa
12 Key Developments
12.1 Agreements, Partnerships, Collaborations and Joint Ventures
12.2 Acquisitions & Mergers
12.3 New Product Launch
12.4 Expansions
12.5 Other Key Strategies
13 Company Profiling
13.1 Boston Dynamics
13.2 Robby Technologies
13.3 Starship Technologies
13.4 Amazon Robotics
13.5 Panasonic System Solutions Asia Pacific
13.6 Robomart
13.7 Ottonomy IO
13.8 Segway Robotics
13.9 Eliport
13.10 Nuro
13.11 Savioke
13.12 Postmates
List of Tables
1 Global Delivery Robots Market Outlook, By Region (2020-2028) ($MN)
2 Global Delivery Robots Market Outlook, By Load Carrying Capacity (2020-2028) ($MN)
3 Global Delivery Robots Market Outlook, By 50-100 Kgs (2020-2028) ($MN)
4 Global Delivery Robots Market Outlook, By 0.5 - 2 Kgs (2020-2028) ($MN)
5 Global Delivery Robots Market Outlook, By 10-50 Kgs (2020-2028) ($MN)
6 Global Delivery Robots Market Outlook, By >100 Kgs (2020-2028) ($MN)
7 Global Delivery Robots Market Outlook, By < 0.5 Kgs (2020-2028) ($MN)
8 Global Delivery Robots Market Outlook, By 2-10 Kgs (2020-2028) ($MN)
9 Global Delivery Robots Market Outlook, By Other Load Carrying Capacities (2020-2028) ($MN)
10 Global Delivery Robots Market Outlook, By Number Of Wheels (2020-2028) ($MN)
11 Global Delivery Robots Market Outlook, By 6 Wheels (2020-2028) ($MN)
12 Global Delivery Robots Market Outlook, By 4 Wheels (2020-2028) ($MN)
13 Global Delivery Robots Market Outlook, By 3 Wheels (2020-2028) ($MN)
14 Global Delivery Robots Market Outlook, By Components (2020-2028) ($MN)
15 Global Delivery Robots Market Outlook, By Software (2020-2028) ($MN)
16 Global Delivery Robots Market Outlook, By Computer Vision (2020-2028) ($MN)
17 Global Delivery Robots Market Outlook, By Fleet Management Software (2020-2028) ($MN)
18 Global Delivery Robots Market Outlook, By Hardware (2020-2028) ($MN)
19 Global Delivery Robots Market Outlook, By Control Systems (2020-2028) ($MN)
20 Global Delivery Robots Market Outlook, By Ultrasonic/ LIDAR Sensors (2020-2028) ($MN)
21 Global Delivery Robots Market Outlook, By Chassis and Motors (2020-2028) ($MN)
22 Global Delivery Robots Market Outlook, By GPS (2020-2028) ($MN)
23 Global Delivery Robots Market Outlook, By Radars (2020-2028) ($MN)
24 Global Delivery Robots Market Outlook, By Cameras (2020-2028) ($MN)
25 Global Delivery Robots Market Outlook, By Speed Limit (2020-2028) ($MN)
26 Global Delivery Robots Market Outlook, By Higher than 6 KPH (2020-2028) ($MN)
27 Global Delivery Robots Market Outlook, By 3 KPH (2020-2028) ($MN)
28 Global Delivery Robots Market Outlook, By Higher than 3 KPH up to 6 KPH (2020-2028) ($MN)
29 Global Delivery Robots Market Outlook, By Operation (2020-2028) ($MN)
30 Global Delivery Robots Market Outlook, By Remote Operated (2020-2028) ($MN)
31 Global Delivery Robots Market Outlook, By Autonomous (2020-2028) ($MN)
32 Global Delivery Robots Market Outlook, By End User (2020-2028) ($MN)
33 Global Delivery Robots Market Outlook, By Healthcare (2020-2028) ($MN)
34 Global Delivery Robots Market Outlook, By Food & Beverages (2020-2028) ($MN)
35 Global Delivery Robots Market Outlook, By Retail (2020-2028) ($MN)
36 Global Delivery Robots Market Outlook, By Postal (2020-2028) ($MN)
37 Global Delivery Robots Market Outlook, By E- Commerce (2020-2028) ($MN)
38 Global Delivery Robots Market Outlook, By Logistic (Courier Parcels) (2020-2028) ($MN)
Note: Tables for North America, Europe, APAC, South America, and Middle East & Africa Regions are also represented in the same manner as above.
List of Figures
RESEARCH METHODOLOGY

We at ‘Stratistics’ opt for an extensive research approach which involves data mining, data validation, and data analysis. The various research sources include in-house repository, secondary research, competitor’s sources, social media research, client internal data, and primary research.
Our team of analysts prefers the most reliable and authenticated data sources in order to perform the comprehensive literature search. With access to most of the authenticated data bases our team highly considers the best mix of information through various sources to obtain extensive and accurate analysis.
Each report takes an average time of a month and a team of 4 industry analysts. The time may vary depending on the scope and data availability of the desired market report. The various parameters used in the market assessment are standardized in order to enhance the data accuracy.
Data Mining
The data is collected from several authenticated, reliable, paid and unpaid sources and is filtered depending on the scope & objective of the research. Our reports repository acts as an added advantage in this procedure. Data gathering from the raw material suppliers, distributors and the manufacturers is performed on a regular basis, this helps in the comprehensive understanding of the products value chain. Apart from the above mentioned sources the data is also collected from the industry consultants to ensure the objective of the study is in the right direction.
Market trends such as technological advancements, regulatory affairs, market dynamics (Drivers, Restraints, Opportunities and Challenges) are obtained from scientific journals, market related national & international associations and organizations.
Data Analysis
From the data that is collected depending on the scope & objective of the research the data is subjected for the analysis. The critical steps that we follow for the data analysis include:
- Product Lifecycle Analysis
- Competitor analysis
- Risk analysis
- Porters Analysis
- PESTEL Analysis
- SWOT Analysis
The data engineering is performed by the core industry experts considering both the Marketing Mix Modeling and the Demand Forecasting. The marketing mix modeling makes use of multiple-regression techniques to predict the optimal mix of marketing variables. Regression factor is based on a number of variables and how they relate to an outcome such as sales or profits.
Data Validation
The data validation is performed by the exhaustive primary research from the expert interviews. This includes telephonic interviews, focus groups, face to face interviews, and questionnaires to validate our research from all aspects. The industry experts we approach come from the leading firms, involved in the supply chain ranging from the suppliers, distributors to the manufacturers and consumers so as to ensure an unbiased analysis.
We are in touch with more than 15,000 industry experts with the right mix of consultants, CEO's, presidents, vice presidents, managers, experts from both supply side and demand side, executives and so on.
The data validation involves the primary research from the industry experts belonging to:
- Leading Companies
- Suppliers & Distributors
- Manufacturers
- Consumers
- Industry/Strategic Consultants
Apart from the data validation the primary research also helps in performing the fill gap research, i.e. providing solutions for the unmet needs of the research which helps in enhancing the reports quality.
For more details about research methodology, kindly write to us at info@strategymrc.com
Frequently Asked Questions
In case of any queries regarding this report, you can contact the customer service by filing the “Inquiry Before Buy” form available on the right hand side. You may also contact us through email: info@strategymrc.com or phone: +1-301-202-5929
Yes, the samples are available for all the published reports. You can request them by filling the “Request Sample” option available in this page.
Yes, you can request a sample with your specific requirements. All the customized samples will be provided as per the requirement with the real data masked.
All our reports are available in Digital PDF format. In case if you require them in any other formats, such as PPT, Excel etc you can submit a request through “Inquiry Before Buy” form available on the right hand side. You may also contact us through email: info@strategymrc.com or phone: +1-301-202-5929
We offer a free 15% customization with every purchase. This requirement can be fulfilled for both pre and post sale. You may send your customization requirements through email at info@strategymrc.com or call us on +1-301-202-5929.
We have 3 different licensing options available in electronic format.
- Single User Licence: Allows one person, typically the buyer, to have access to the ordered product. The ordered product cannot be distributed to anyone else.
- 2-5 User Licence: Allows the ordered product to be shared among a maximum of 5 people within your organisation.
- Corporate License: Allows the product to be shared among all employees of your organisation regardless of their geographical location.
All our reports are typically be emailed to you as an attachment.
To order any available report you need to register on our website. The payment can be made either through CCAvenue or PayPal payments gateways which accept all international cards.
We extend our support to 6 months post sale. A post sale customization is also provided to cover your unmet needs in the report.
Request Customization
We provide a free 15% customization on every purchase. This requirement can be fulfilled for both pre and post sale. You may send your customization requirements through email at info@strategymrc.com or call us on +1-301-202-5929.
Note: This customization is absolutely free until it falls under the 15% bracket. If your requirement exceeds this a feasibility check will be performed. Post that, a quote will be provided along with the timelines.
WHY CHOOSE US ?

Assured Quality
Best in class reports with high standard of research integrity

24X7 Research Support
Continuous support to ensure the best customer experience.

Free Customization
Adding more values to your product of interest.

Safe & Secure Access
Providing a secured environment for all online transactions.

Trusted by 600+ Brands
Serving the most reputed brands across the world.