
Fault Current Limiter Market
Fault Current Limiter Market Forecasts to 2030 - Global Analysis By Type (Superconducting Fault Current Limiter (SFCL) and Non-Superconducting Fault Current Limiter (NSFCL)), Voltage Range (Low, Medium and High), End User and By Geography

|
Years Covered |
2021-2030 |
|
Estimated Year Value (2023) |
US $5.4 BN |
|
Projected Year Value (2030) |
US $12.5 BN |
|
CAGR (2023 - 2030) |
9.2% |
|
Regions Covered |
North America, Europe, Asia Pacific, South America, and Middle East & Africa |
|
Countries Covered |
US, Canada, Mexico, Germany, UK, Italy, France, Spain, Japan, China, India, Australia, New Zealand, South Korea, Rest of Asia Pacific, South America, Argentina, Brazil, Chile, Middle East & Africa, Saudi Arabia, UAE, Qatar, and South Africa |
|
Largest Market |
Asia Pacific |
|
Highest Growing Market |
Europe |
According to Stratistics MRC, the Global Fault Current Limiter Market is accounted for $5.4 billion in 2023 and is expected to reach $12.5 billion by 2030 growing at a CAGR of 9.2% during the forecast period. A Fault Current Limiter (FCL) is a device used in electrical power systems to limit the amount of current that flows in the event of a fault or short circuit. It helps protect equipment, prevent damage, and maintain the stability of the electrical grid. A fault current is generated in the power supply system when the current bypasses the normal load due to a short circuit. It is used to control wasted energy in power systems.
According to the U.S. Energy Information Administration (EIA), there were about 11,925 utility-scale electric power plants in the United States in 2021.
Market Dynamics:
Driver:
Grid integration of renewable energy
As renewable energy sources like solar and wind are integrated into the electrical grid, there is a need for technologies like FCLs to manage potential fluctuations and faults that can arise from intermittent energy generation. FCLs can enhance the stability of power systems by limiting the fault current levels, which can prevent cascading failures and improve the overall reliability of the grid. They allow for better management of intermittent energy generation and help reduce the reliance on non-renewable energy sources which is driving the market demand.
Restraint:
Safety concerns
A fault current in an electrical grid refers to an abnormal flow of electric current caused by a short circuit or other fault. This can potentially lead to various safety concerns. Fault currents can result in elevated levels of electrical current flowing through equipment and conductors. This can pose a significant risk of electrocution to individuals coming into contact with the affected components. Factors such as voltage fluctuations, thermal stress and overloading are hampering the market growth.
Opportunity:
Raising demand for intelligent & modernized power grid infrastructure
The high demand for intelligent and modernized power grid infrastructure is driven by a combination of technological advancements, environmental concerns, regulatory mandates, and the need for improved grid reliability. Modernizing the grid enables the integration of clean energy sources, reducing reliance on fossil fuels and contributing to efforts to combat climate change. Advanced grid systems allow for dynamic demand response programs, where electricity consumption can be adjusted based on grid conditions. Technological advancements, economic benefits and demand response accelerated the market growth.
Threat:
High material costs & complex engineering
Installing a fault current grid requires skilled labor, often from specialized electrical engineers and technicians. The installation process may be more time-consuming and intricate. The materials used in fault current grids, including high-quality conductors, insulators, and protective elements, can be expensive. Designing a fault current grid requires careful planning, analysis, and engineering expertise. This complexity adds to the overall cost.
Covid-19 Impact
The COVID-19 pandemic has had a range of effects on various industries and technologies, including fault current limiters (FCLs) and their development and deployment. The pandemic led to disruptions in global supply chains, affecting the availability of components and materials needed for manufacturing FCLs. Research and development efforts for FCL technology have been affected by restrictions on in-person collaboration, limited access to labs and testing facilities, and disruptions in the availability of specialized equipment. The post pandemic has raised collaborations for complex engineering projects.
The superconducting fault current limiter (SFCL) segment is expected to be the largest during the forecast period
The superconducting fault current limiter (SFCL) segment is estimated to have a lucrative growth. A Superconducting Fault Current Limiter (SFCL) is an advanced electrical device designed to limit the magnitude of fault currents that occur in electrical power systems. It utilizes the unique properties of superconductors to rapidly change their electrical resistance in response to high current surges. Its improved grid reliability, compatibility with renewable energy sources, compact and lightweight design factors are fuelling the segment’s demand.
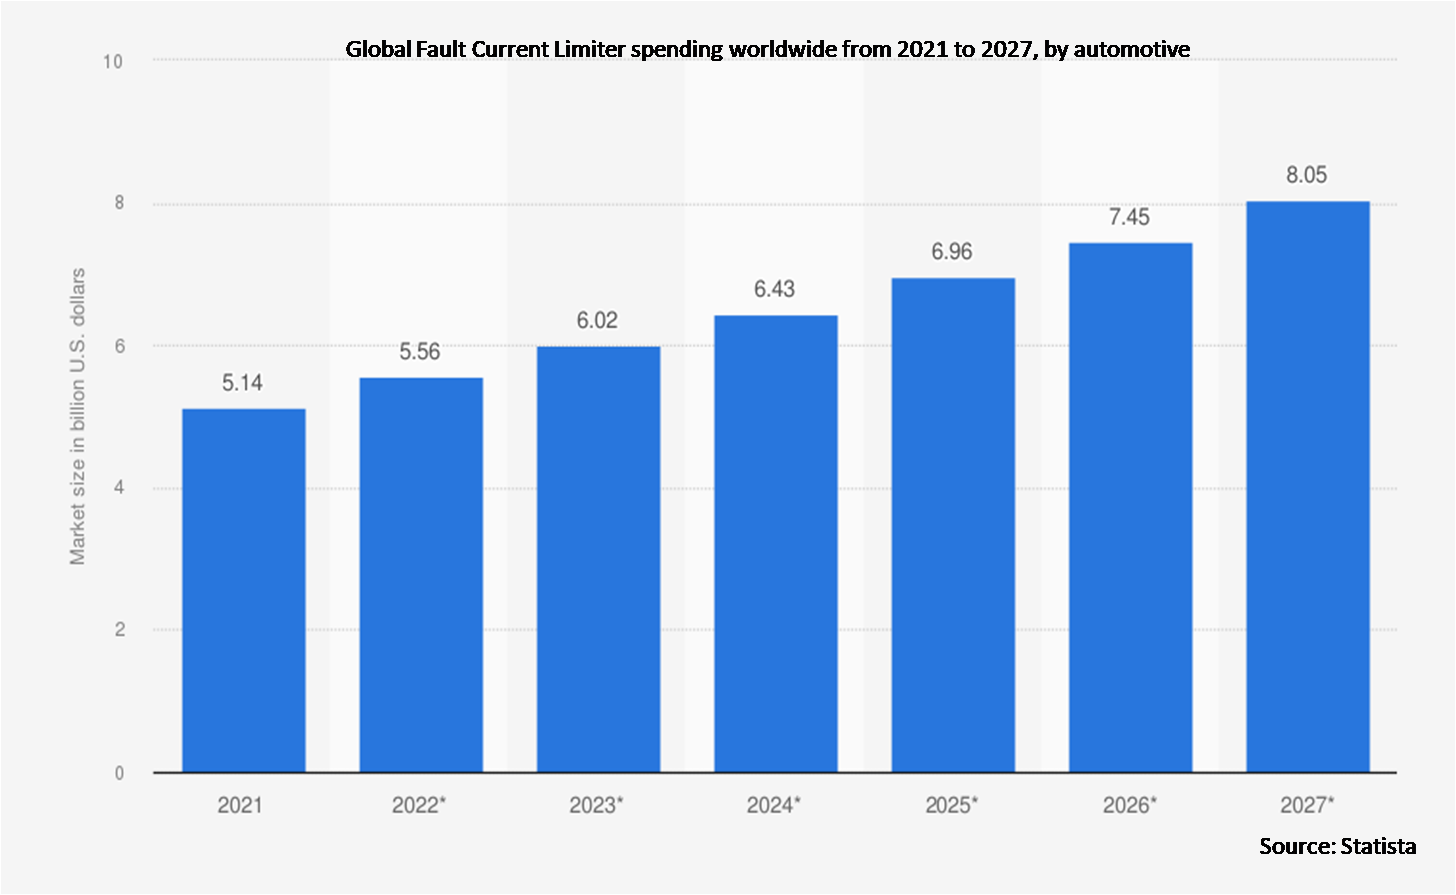
The automotive segment is expected to have the highest CAGR during the forecast period
The automotive segment is anticipated to witness the fastest CAGR growth during the forecast period. FCLs prevent overload situations in the electrical system. This ensures that each component operates within its designed capacity, avoiding overheating and potential damage. Fault Current Limiters (FCLs) in automotive applications provide various benefits, primarily focused on enhancing safety, protecting electrical systems, and improving vehicle performance.
Region with largest share:
Asia Pacific is projected to hold the largest market share during the forecast period owing to massive population growth, urbanization, and industrialization. India and China continue to dominate the total energy consumption in the region. Extensive investment in transmission and distribution network and government’s keen interest in providing electricity throughout the region has multiplied fault current limiter growth in APAC.
Region with highest CAGR:
Europe is projected to have the highest CAGR over the forecast period, owing to the upgradations of aging transmission and distribution networks and investment in the smart grid option. Moreover, the expansion of information and communication technology along with the data center, which requires an uninterrupted power supply, may surge the demand for fault current limiters. Strong green technology policies, boding investment in a smart and microgrid to meet the rising power demand is likely to boost the market in Europe.

Key players in the market
Some of the key players profiled in the Fault Current Limiter Market include Siemens AG, ALS Ltd, American Superconductor Corporation, Nexans, Gridon Ltd, Rongxin Power Electronic Co., Ltd., Applied Materials, Inc., Superconductor Technologies, Inc., SuperPower, Inc., ABB Limited, Suzlon Energy Australia (SEA), Wilson Transformer Company and Furukawa Electric Co Limited.
Key Developments:
In June 2022, Applied Materials, Inc. acquired Picosun Oy, an innovator in atomic layer deposition technology, especially for specialty semiconductors, to expand its technology portfolio.
In October 2020, American Superconductor Corporation, a prominent system provider of megawatt-scale power resiliency solutions, announced the acquisition of Northeast Power Systems, Inc. to expand its presence and accelerate toward profitability.
Types Covered:
• Superconducting Fault Current Limiter (SFCL)
• Non-Superconducting Fault Current Limiter (NSFCL)
Voltage Ranges Covered:
• Low
• Medium
• High
End Users Covered:
• Power Stations
• Automotive
• Oil & Gas
• Steel & Aluminum
• Paper Mills
• Other End Users
Regions Covered:
• North America
o US
o Canada
o Mexico
• Europe
o Germany
o UK
o Italy
o France
o Spain
o Rest of Europe
• Asia Pacific
o Japan
o China
o India
o Australia
o New Zealand
o South Korea
o Rest of Asia Pacific
• South America
o Argentina
o Brazil
o Chile
o Rest of South America
• Middle East & Africa
o Saudi Arabia
o UAE
o Qatar
o South Africa
o Rest of Middle East & Africa
What our report offers:
- Market share assessments for the regional and country-level segments
- Strategic recommendations for the new entrants
- Covers Market data for the years 2021, 2022, 2023, 2026, and 2030
- Market Trends (Drivers, Constraints, Opportunities, Threats, Challenges, Investment Opportunities, and recommendations)
- Strategic recommendations in key business segments based on the market estimations
- Competitive landscaping mapping the key common trends
- Company profiling with detailed strategies, financials, and recent developments
- Supply chain trends mapping the latest technological advancements
Free Customization Offerings:
All the customers of this report will be entitled to receive one of the following free customization options:
• Company Profiling
o Comprehensive profiling of additional market players (up to 3)
o SWOT Analysis of key players (up to 3)
• Regional Segmentation
o Market estimations, Forecasts and CAGR of any prominent country as per the client's interest (Note: Depends on feasibility check)
• Competitive Benchmarking
o Benchmarking of key players based on product portfolio, geographical presence, and strategic alliances
Table of Contents
1 Executive Summary
2 Preface
2.1 Abstract
2.2 Stake Holders
2.3 Research Scope
2.4 Research Methodology
2.4.1 Data Mining
2.4.2 Data Analysis
2.4.3 Data Validation
2.4.4 Research Approach
2.5 Research Sources
2.5.1 Primary Research Sources
2.5.2 Secondary Research Sources
2.5.3 Assumptions
3 Market Trend Analysis
3.1 Introduction
3.2 Drivers
3.3 Restraints
3.4 Opportunities
3.5 Threats
3.6 End User Analysis
3.7 Emerging Markets
3.8 Impact of Covid-19
4 Porters Five Force Analysis
4.1 Bargaining power of suppliers
4.2 Bargaining power of buyers
4.3 Threat of substitutes
4.4 Threat of new entrants
4.5 Competitive rivalry
5 Global Fault Current Limiter Market, By Type
5.1 Introduction
5.2 Superconducting Fault Current Limiter (SFCL)
5.3 Non-Superconducting Fault Current Limiter (NSFCL)
6 Global Fault Current Limiter Market, By Voltage Range
6.1 Introduction
6.2 Low
6.3 Medium
6.4 High
7 Global Fault Current Limiter Market, By End User
7.1 Introduction
7.2 Power Stations
7.3 Automotive
7.4 Oil & Gas
7.5 Steel & Aluminum
7.6 Paper Mills
7.7 Other End Users
8 Global Fault Current Limiter Market, By Geography
8.1 Introduction
8.2 North America
8.2.1 US
8.2.2 Canada
8.2.3 Mexico
8.3 Europe
8.3.1 Germany
8.3.2 UK
8.3.3 Italy
8.3.4 France
8.3.5 Spain
8.3.6 Rest of Europe
8.4 Asia Pacific
8.4.1 Japan
8.4.2 China
8.4.3 India
8.4.4 Australia
8.4.5 New Zealand
8.4.6 South Korea
8.4.7 Rest of Asia Pacific
8.5 South America
8.5.1 Argentina
8.5.2 Brazil
8.5.3 Chile
8.5.4 Rest of South America
8.6 Middle East & Africa
8.6.1 Saudi Arabia
8.6.2 UAE
8.6.3 Qatar
8.6.4 South Africa
8.6.5 Rest of Middle East & Africa
9 Key Developments
9.1 Agreements, Partnerships, Collaborations and Joint Ventures
9.2 Acquisitions & Mergers
9.3 New Product Launch
9.4 Expansions
9.5 Other Key Strategies
10 Company Profiling
10.1 Siemens AG
10.2 ALS Ltd
10.3 American Superconductor Corporation
10.4 Nexans
10.5 Gridon Ltd
10.6 Rongxin Power Electronic Co., Ltd.
10.7 Applied Materials, Inc.
10.8 Superconductor Technologies, Inc.
10.9 SuperPower, Inc.
10.10 ABB Limited
10.11 Suzlon Energy Australia (SEA)
10.12 Wilson Transformer Company
10.13 Furukawa Electric Co Limited
List of Tables
1 Global Fault Current Limiter Market Outlook, By Region (2021-2030) ($MN)
2 Global Fault Current Limiter Market Outlook, By Type (2021-2030) ($MN)
3 Global Fault Current Limiter Market Outlook, By Superconducting Fault Current Limiter (SFCL) (2021-2030) ($MN)
4 Global Fault Current Limiter Market Outlook, By Non-Superconducting Fault Current Limiter (NSFCL) (2021-2030) ($MN)
5 Global Fault Current Limiter Market Outlook, By Voltage Range (2021-2030) ($MN)
6 Global Fault Current Limiter Market Outlook, By Low (2021-2030) ($MN)
7 Global Fault Current Limiter Market Outlook, By Medium (2021-2030) ($MN)
8 Global Fault Current Limiter Market Outlook, By High (2021-2030) ($MN)
9 Global Fault Current Limiter Market Outlook, By End User (2021-2030) ($MN)
10 Global Fault Current Limiter Market Outlook, By Power Stations (2021-2030) ($MN)
11 Global Fault Current Limiter Market Outlook, By Automotive (2021-2030) ($MN)
12 Global Fault Current Limiter Market Outlook, By Oil & Gas (2021-2030) ($MN)
13 Global Fault Current Limiter Market Outlook, By Steel & Aluminum (2021-2030) ($MN)
14 Global Fault Current Limiter Market Outlook, By Paper Mills (2021-2030) ($MN)
15 Global Fault Current Limiter Market Outlook, By Other End Users (2021-2030) ($MN)
16 North America Fault Current Limiter Market Outlook, By Country (2021-2030) ($MN)
17 North America Fault Current Limiter Market Outlook, By Type (2021-2030) ($MN)
18 North America Fault Current Limiter Market Outlook, By Superconducting Fault Current Limiter (SFCL) (2021-2030) ($MN)
19 North America Fault Current Limiter Market Outlook, By Non-Superconducting Fault Current Limiter (NSFCL) (2021-2030) ($MN)
20 North America Fault Current Limiter Market Outlook, By Voltage Range (2021-2030) ($MN)
21 North America Fault Current Limiter Market Outlook, By Low (2021-2030) ($MN)
22 North America Fault Current Limiter Market Outlook, By Medium (2021-2030) ($MN)
23 North America Fault Current Limiter Market Outlook, By High (2021-2030) ($MN)
24 North America Fault Current Limiter Market Outlook, By End User (2021-2030) ($MN)
25 North America Fault Current Limiter Market Outlook, By Power Stations (2021-2030) ($MN)
26 North America Fault Current Limiter Market Outlook, By Automotive (2021-2030) ($MN)
27 North America Fault Current Limiter Market Outlook, By Oil & Gas (2021-2030) ($MN)
28 North America Fault Current Limiter Market Outlook, By Steel & Aluminum (2021-2030) ($MN)
29 North America Fault Current Limiter Market Outlook, By Paper Mills (2021-2030) ($MN)
30 North America Fault Current Limiter Market Outlook, By Other End Users (2021-2030) ($MN)
31 Europe Fault Current Limiter Market Outlook, By Country (2021-2030) ($MN)
32 Europe Fault Current Limiter Market Outlook, By Type (2021-2030) ($MN)
33 Europe Fault Current Limiter Market Outlook, By Superconducting Fault Current Limiter (SFCL) (2021-2030) ($MN)
34 Europe Fault Current Limiter Market Outlook, By Non-Superconducting Fault Current Limiter (NSFCL) (2021-2030) ($MN)
35 Europe Fault Current Limiter Market Outlook, By Voltage Range (2021-2030) ($MN)
36 Europe Fault Current Limiter Market Outlook, By Low (2021-2030) ($MN)
37 Europe Fault Current Limiter Market Outlook, By Medium (2021-2030) ($MN)
38 Europe Fault Current Limiter Market Outlook, By High (2021-2030) ($MN)
39 Europe Fault Current Limiter Market Outlook, By End User (2021-2030) ($MN)
40 Europe Fault Current Limiter Market Outlook, By Power Stations (2021-2030) ($MN)
41 Europe Fault Current Limiter Market Outlook, By Automotive (2021-2030) ($MN)
42 Europe Fault Current Limiter Market Outlook, By Oil & Gas (2021-2030) ($MN)
43 Europe Fault Current Limiter Market Outlook, By Steel & Aluminum (2021-2030) ($MN)
44 Europe Fault Current Limiter Market Outlook, By Paper Mills (2021-2030) ($MN)
45 Europe Fault Current Limiter Market Outlook, By Other End Users (2021-2030) ($MN)
46 Asia Pacific Fault Current Limiter Market Outlook, By Country (2021-2030) ($MN)
47 Asia Pacific Fault Current Limiter Market Outlook, By Type (2021-2030) ($MN)
48 Asia Pacific Fault Current Limiter Market Outlook, By Superconducting Fault Current Limiter (SFCL) (2021-2030) ($MN)
49 Asia Pacific Fault Current Limiter Market Outlook, By Non-Superconducting Fault Current Limiter (NSFCL) (2021-2030) ($MN)
50 Asia Pacific Fault Current Limiter Market Outlook, By Voltage Range (2021-2030) ($MN)
51 Asia Pacific Fault Current Limiter Market Outlook, By Low (2021-2030) ($MN)
52 Asia Pacific Fault Current Limiter Market Outlook, By Medium (2021-2030) ($MN)
53 Asia Pacific Fault Current Limiter Market Outlook, By High (2021-2030) ($MN)
54 Asia Pacific Fault Current Limiter Market Outlook, By End User (2021-2030) ($MN)
55 Asia Pacific Fault Current Limiter Market Outlook, By Power Stations (2021-2030) ($MN)
56 Asia Pacific Fault Current Limiter Market Outlook, By Automotive (2021-2030) ($MN)
57 Asia Pacific Fault Current Limiter Market Outlook, By Oil & Gas (2021-2030) ($MN)
58 Asia Pacific Fault Current Limiter Market Outlook, By Steel & Aluminum (2021-2030) ($MN)
59 Asia Pacific Fault Current Limiter Market Outlook, By Paper Mills (2021-2030) ($MN)
60 Asia Pacific Fault Current Limiter Market Outlook, By Other End Users (2021-2030) ($MN)
61 South America Fault Current Limiter Market Outlook, By Country (2021-2030) ($MN)
62 South America Fault Current Limiter Market Outlook, By Type (2021-2030) ($MN)
63 South America Fault Current Limiter Market Outlook, By Superconducting Fault Current Limiter (SFCL) (2021-2030) ($MN)
64 South America Fault Current Limiter Market Outlook, By Non-Superconducting Fault Current Limiter (NSFCL) (2021-2030) ($MN)
65 South America Fault Current Limiter Market Outlook, By Voltage Range (2021-2030) ($MN)
66 South America Fault Current Limiter Market Outlook, By Low (2021-2030) ($MN)
67 South America Fault Current Limiter Market Outlook, By Medium (2021-2030) ($MN)
68 South America Fault Current Limiter Market Outlook, By High (2021-2030) ($MN)
69 South America Fault Current Limiter Market Outlook, By End User (2021-2030) ($MN)
70 South America Fault Current Limiter Market Outlook, By Power Stations (2021-2030) ($MN)
71 South America Fault Current Limiter Market Outlook, By Automotive (2021-2030) ($MN)
72 South America Fault Current Limiter Market Outlook, By Oil & Gas (2021-2030) ($MN)
73 South America Fault Current Limiter Market Outlook, By Steel & Aluminum (2021-2030) ($MN)
74 South America Fault Current Limiter Market Outlook, By Paper Mills (2021-2030) ($MN)
75 South America Fault Current Limiter Market Outlook, By Other End Users (2021-2030) ($MN)
76 Middle East & Africa Fault Current Limiter Market Outlook, By Country (2021-2030) ($MN)
77 Middle East & Africa Fault Current Limiter Market Outlook, By Type (2021-2030) ($MN)
78 Middle East & Africa Fault Current Limiter Market Outlook, By Superconducting Fault Current Limiter (SFCL) (2021-2030) ($MN)
79 Middle East & Africa Fault Current Limiter Market Outlook, By Non-Superconducting Fault Current Limiter (NSFCL) (2021-2030) ($MN)
80 Middle East & Africa Fault Current Limiter Market Outlook, By Voltage Range (2021-2030) ($MN)
81 Middle East & Africa Fault Current Limiter Market Outlook, By Low (2021-2030) ($MN)
82 Middle East & Africa Fault Current Limiter Market Outlook, By Medium (2021-2030) ($MN)
83 Middle East & Africa Fault Current Limiter Market Outlook, By High (2021-2030) ($MN)
84 Middle East & Africa Fault Current Limiter Market Outlook, By End User (2021-2030) ($MN)
85 Middle East & Africa Fault Current Limiter Market Outlook, By Power Stations (2021-2030) ($MN)
86 Middle East & Africa Fault Current Limiter Market Outlook, By Automotive (2021-2030) ($MN)
87 Middle East & Africa Fault Current Limiter Market Outlook, By Oil & Gas (2021-2030) ($MN)
88 Middle East & Africa Fault Current Limiter Market Outlook, By Steel & Aluminum (2021-2030) ($MN)
89 Middle East & Africa Fault Current Limiter Market Outlook, By Paper Mills (2021-2030) ($MN)
90 Middle East & Africa Fault Current Limiter Market Outlook, By Other End Users (2021-2030) ($MN)
List of Figures
RESEARCH METHODOLOGY

We at ‘Stratistics’ opt for an extensive research approach which involves data mining, data validation, and data analysis. The various research sources include in-house repository, secondary research, competitor’s sources, social media research, client internal data, and primary research.
Our team of analysts prefers the most reliable and authenticated data sources in order to perform the comprehensive literature search. With access to most of the authenticated data bases our team highly considers the best mix of information through various sources to obtain extensive and accurate analysis.
Each report takes an average time of a month and a team of 4 industry analysts. The time may vary depending on the scope and data availability of the desired market report. The various parameters used in the market assessment are standardized in order to enhance the data accuracy.
Data Mining
The data is collected from several authenticated, reliable, paid and unpaid sources and is filtered depending on the scope & objective of the research. Our reports repository acts as an added advantage in this procedure. Data gathering from the raw material suppliers, distributors and the manufacturers is performed on a regular basis, this helps in the comprehensive understanding of the products value chain. Apart from the above mentioned sources the data is also collected from the industry consultants to ensure the objective of the study is in the right direction.
Market trends such as technological advancements, regulatory affairs, market dynamics (Drivers, Restraints, Opportunities and Challenges) are obtained from scientific journals, market related national & international associations and organizations.
Data Analysis
From the data that is collected depending on the scope & objective of the research the data is subjected for the analysis. The critical steps that we follow for the data analysis include:
- Product Lifecycle Analysis
- Competitor analysis
- Risk analysis
- Porters Analysis
- PESTEL Analysis
- SWOT Analysis
The data engineering is performed by the core industry experts considering both the Marketing Mix Modeling and the Demand Forecasting. The marketing mix modeling makes use of multiple-regression techniques to predict the optimal mix of marketing variables. Regression factor is based on a number of variables and how they relate to an outcome such as sales or profits.
Data Validation
The data validation is performed by the exhaustive primary research from the expert interviews. This includes telephonic interviews, focus groups, face to face interviews, and questionnaires to validate our research from all aspects. The industry experts we approach come from the leading firms, involved in the supply chain ranging from the suppliers, distributors to the manufacturers and consumers so as to ensure an unbiased analysis.
We are in touch with more than 15,000 industry experts with the right mix of consultants, CEO's, presidents, vice presidents, managers, experts from both supply side and demand side, executives and so on.
The data validation involves the primary research from the industry experts belonging to:
- Leading Companies
- Suppliers & Distributors
- Manufacturers
- Consumers
- Industry/Strategic Consultants
Apart from the data validation the primary research also helps in performing the fill gap research, i.e. providing solutions for the unmet needs of the research which helps in enhancing the reports quality.
For more details about research methodology, kindly write to us at info@strategymrc.com
Frequently Asked Questions
In case of any queries regarding this report, you can contact the customer service by filing the “Inquiry Before Buy” form available on the right hand side. You may also contact us through email: info@strategymrc.com or phone: +1-301-202-5929
Yes, the samples are available for all the published reports. You can request them by filling the “Request Sample” option available in this page.
Yes, you can request a sample with your specific requirements. All the customized samples will be provided as per the requirement with the real data masked.
All our reports are available in Digital PDF format. In case if you require them in any other formats, such as PPT, Excel etc you can submit a request through “Inquiry Before Buy” form available on the right hand side. You may also contact us through email: info@strategymrc.com or phone: +1-301-202-5929
We offer a free 15% customization with every purchase. This requirement can be fulfilled for both pre and post sale. You may send your customization requirements through email at info@strategymrc.com or call us on +1-301-202-5929.
We have 3 different licensing options available in electronic format.
- Single User Licence: Allows one person, typically the buyer, to have access to the ordered product. The ordered product cannot be distributed to anyone else.
- 2-5 User Licence: Allows the ordered product to be shared among a maximum of 5 people within your organisation.
- Corporate License: Allows the product to be shared among all employees of your organisation regardless of their geographical location.
All our reports are typically be emailed to you as an attachment.
To order any available report you need to register on our website. The payment can be made either through CCAvenue or PayPal payments gateways which accept all international cards.
We extend our support to 6 months post sale. A post sale customization is also provided to cover your unmet needs in the report.
Request Customization
We provide a free 15% customization on every purchase. This requirement can be fulfilled for both pre and post sale. You may send your customization requirements through email at info@strategymrc.com or call us on +1-301-202-5929.
Note: This customization is absolutely free until it falls under the 15% bracket. If your requirement exceeds this a feasibility check will be performed. Post that, a quote will be provided along with the timelines.
WHY CHOOSE US ?

Assured Quality
Best in class reports with high standard of research integrity

24X7 Research Support
Continuous support to ensure the best customer experience.

Free Customization
Adding more values to your product of interest.

Safe & Secure Access
Providing a secured environment for all online transactions.

Trusted by 600+ Brands
Serving the most reputed brands across the world.