
Iot Market
IoT Market Forecasts to 2030 - Global Analysis By Organization Size (Large Enterprises, Small Enterprises, Medium Enterprises), Technology (Pressure Sensor, Network Communicatons, Radiofrequency Identification, Near Field Communications, Other Technologies), End User and by Geography

|
Years Covered |
2021-2030 |
|
Estimated Year Value (2023) |
US $382.5 BN |
|
Projected Year Value (2030) |
US $1,307.92 BN |
|
CAGR (2023 - 2030) |
19.2% |
|
Regions Covered |
North America, Europe, Asia Pacific, South America, and Middle East & Africa |
|
Countries Covered |
US, Canada, Mexico, Germany, UK, Italy, France, Spain, Japan, China, India, Australia, New Zealand, South Korea, Rest of Asia Pacific, South America, Argentina, Brazil, Chile, Middle East & Africa, Saudi Arabia, UAE, Qatar, and South Africa |
|
Largest Market |
Asia Pacific |
|
Highest Growing Market |
North America |
According to Stratistics MRC, the Global IoT Market is accounted for $382.5 billion in 2023 and is expected to reach $1,307.9 billion by 2030 growing at a CAGR of 19.2% during the forecast period. The term Internet of Things"" (IoT) refers to a network of physical and digital objects that may speak to one another on their own utilizing the Internet Protocol (IP). The physical objects have sensors, software, and networking features that allow for data collection and exchange over the internet. Its applicability ranges from simple domestic items to more sophisticated industrial applications. It serves as a global infrastructure for the information society, allowing for the interconnection of things through enhanced services based on current and developing communication technologies.
According to the International Federation of Robotics, the market for collaborative robots is expected to reach a value of USD 12.3 billion by 2025.
Market Dynamics:
Driver:
An increase in linked devices in the development of the IoT
Organizations have a ton of options due to internet connectivity and linked devices to gather pertinent data about consumer activity in retail stores for real-time marketing research, sensor-driven decision analytics, and instantaneous control responses in sophisticated autonomous systems. With the use of the Internet of Things (IoT), businesses and governments may access location-based data in real time from all smart potentials, including smart cities, smart transportation, and smart utilities. Additionally, the availability of high-speed network access has made it possible for different industries, including those in the energy, healthcare, transportation, and other utility sectors, to monitor and manage the infrastructure more effectively.
Restraint:
Lack of awareness of IoT and raise in security issues
One of the main obstacles to the creation of a smart environment is the general lack of public awareness. The government's aim to develop smart city solutions is also diminished by the fact that many local inhabitants are unaware of smart city initiatives. The IoT ecosystem's many platforms, systems, and protocols lack established communication standards and compatibility. Because of this fragmentation, it is difficult for various IoT components to cooperate and integrate easily, which restricts scalability and hampers the development of a single IoT infrastructure. As linked devices and data transfers increase, security issues and privacy risks become more prevalent.
Opportunity:
Availability of inexpensive, low-power sensor technology
The most crucial IoT device components are sensors. They aid in gathering data regarding a physical occurrence or condition and environment around them, including orientation, motion, light, sound, humidity, and temperature, as well as biometrics like blood pressure and heart rate, can all be measured by sensors. Low-power sensors will make IoT easier to execute across industry sectors and in a range of application areas. Therefore, it is anticipated that ongoing sensor technology innovation will increase the possibilities of the IoT.
Threat:
Lack of technological innovation and expertise in underdeveloped economies
Many countries experience a shortage of vital technology, such as telecom and networking infrastructure, and are unable to quickly implement smart projects due to a number of problems, including limited funding and low literacy rates. Moreover, because of the complexity of IoT, security flaws, and integration difficulties, effective implementation in the IoT industry is hampered by a lack of expertise. Furthermore, as a result, it is expected that both a lack of assets and infrastructure in developing nations as well as customer ignorance and lack of expertise will hinder the growth of the Internet of Things sector. Hence, rapid technological improvements and shifting consumer expectations necessitate ongoing innovation, which leads to competitive disadvantages, increased prices, and dissatisfied customers.
Covid-19 Impact:
COVID-19 has had never-before-seen consequences for society and business. Healthcare professionals, governments, and business executives around the world are more concerned with preserving life. Various supply and demand factors during the epidemic have abruptly lowered manufacturing levels and shut down businesses. Major, important companies are also not investing as much in research and IoT development as they once did, and manufacturers and industries have struggled greatly as a result of COVID-19.
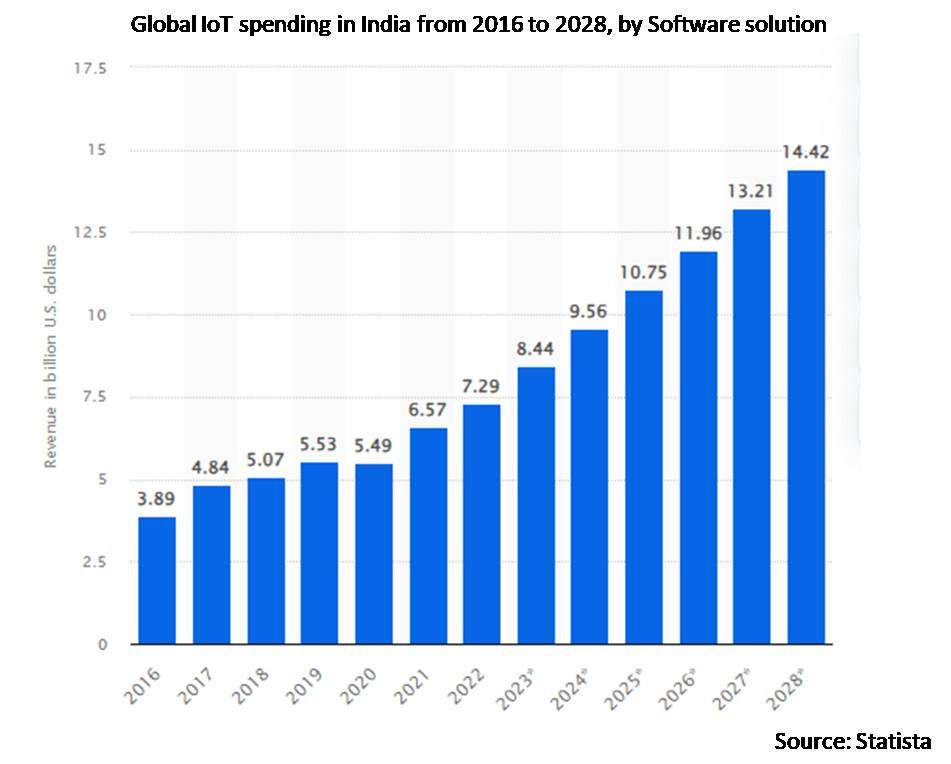
The software solutions segment is expected to be the largest during the forecast period
The software solutions segment is expected to have lucrative growth due to the corporate applications that boost operational effectiveness, improve customer satisfaction, and create new prospects for generating income. IoT devices that are internet-connected easily communicate data with one another, work together to run apps, and offer reliable data decisions to the user. Wide-ranging technologies provided by software solutions help businesses achieve their goals and keep a key competitive edge. In order to automate various tasks at critical infrastructure, industrial, and other systems, software solutions are gaining popularity.
The agriculture segment is expected to have the highest CAGR during the forecast period
It is expected that the agriculture category would expand at the largest CAGR. A number of factors, including the increasing need for field-based sensors and equipment, smart farming, smart greenhouses, smart agriculture, precision farming, and smart drones are a few of the primary technological applications in the agricultural industry. Their ability to make more informed decisions has helped them cut costs while increasing yields. For instance, smart farming improves the overall agricultural system through real-time farm monitoring and enables farmers to effectively produce food.
Region with largest share:
During the forecast period it is anticipated that Asia Pacific region is largest. This region has become a valuable market for the IT industry to the high rate of adoption of new technology. The region is helpful in emerging nations that are going through rapid urbanization, making it the most active region in the world for urbanization. The majority of the world's emerging nations are found in this region, which is the most dynamic in the world for urbanization.
Region with highest CAGR:
North America is projected to have the highest CAGR over the forecast period that is because it is a technologically advanced region. US and Canada have developed economies, enabling them to make significant investments in R&D projects. The utilization of connected devices and associated network infrastructure, as well as the increased cooperation between hardware, network, and software providers, are the main factors contributing to the growth of the IoT market in the North American area. Moreover, by embracing IoT capabilities, Canadian businesses are enhancing and optimizing their business operations where businesses produce and the market run more efficiently.

Key players in the market
Some of the key players in IoT Market include Amazon Web Services, Cisco Systems, GE, Google, IBM Corporation, Intel Corporation, Microsoft Corporation, Oracle Corporation, Power Trading Corporation (PTC), Qualcomm, SAP SE, Siemens AG.
Key Developments:
In January 2023, Intel introduced the Intel Core mobile processor, 13th Gen. The advancement is powered by Intel's hybrid architecture and has 32 mobile processors. Intel's Core H-, P-, and U- range mobile processors are power-driven with light and thin laptops and Internet of Things devices.
In December 2022, AWS and Slalom expanded their strategic partnership to provide innovative, high-tech, and industry-precise solutions to the expanded customer base. The two firms collaborate to launch AWS|Shalom Launch Centers to help organizations modernize IT services and accelerate business renovations. These centres enable customers to access the AWS professional service with cloud solutions and Slalom expertise in software mechanics, analytical capabilities, and business transformation.
In December 2022, Deloitte announced the launch of Olympus with AWS (Amazon Web Services). Olympus is a worldwide investment fund for building industry cloud solutions along with advanced technologies such as IoT, AI, machine learning, 5G, quantum computing, and AR/VR, everything on the cloud. The initiative aims to solve the issues related to food waste, clean energy, financial product access, and many such problems.
In November 2022, AWS IoT Core launched a new location service in collaboration with LoRa Edge. The partnership simplifies the development of asset tracking and connects LoRa Edge devices to AWS. The low-power, scalable, and cost-effective technology is suited for several applications such as building, industrial, home, agriculture, transportation, and logistics sector.
In February 2022, Siemens upgraded its NX Software in the Xcelerator portfolio with intelligence-based design features. This upgrade allows the application to leverage advanced simulation technologies and AI, delivering proficient insights to the users.
Products Covered:
• Sensors
• Software
• Cameras
• Other Products
Technologies Covered:
• Hyperspectral Technology
• Multispectral Technology
Applications Covered:
• Crop Scouting
• Field Mapping
• Inventory Management
• Irrigation Management
Regions Covered:
• North America
o US
o Canada
o Mexico
• Europe
o Germany
o UK
o Italy
o France
o Spain
o Rest of Europe
• Asia Pacific
o Japan
o China
o India
o Australia
o New Zealand
o South Korea
o Rest of Asia Pacific
• South America
o Argentina
o Brazil
o Chile
o Rest of South America
• Middle East & Africa
o Saudi Arabia
o UAE
o Qatar
o South Africa
o Rest of Middle East & Africa
What our report offers:
- Market share assessments for the regional and country-level segments
- Strategic recommendations for the new entrants
- Covers Market data for the years 2021, 2022, 2023, 2026, and 2030
- Market Trends (Drivers, Constraints, Opportunities, Threats, Challenges, Investment Opportunities, and recommendations)
- Strategic recommendations in key business segments based on the market estimations
- Competitive landscaping mapping the key common trends
- Company profiling with detailed strategies, financials, and recent developments
- Supply chain trends mapping the latest technological advancements
Free Customization Offerings:
All the customers of this report will be entitled to receive one of the following free customization options:
• Company Profiling
o Comprehensive profiling of additional market players (up to 3)
o SWOT Analysis of key players (up to 3)
• Regional Segmentation
o Market estimations, Forecasts and CAGR of any prominent country as per the client's interest (Note: Depends on feasibility check)
• Competitive Benchmarking
Benchmarking of key players based on product portfolio, geographical presence, and strategic alliances
Table of Contents
1 Executive Summary
2 Preface
2.1 Abstract
2.2 Stake Holders
2.3 Research Scope
2.4 Research Methodology
2.4.1 Data Mining
2.4.2 Data Analysis
2.4.3 Data Validation
2.4.4 Research Approach
2.5 Research Sources
2.5.1 Primary Research Sources
2.5.2 Secondary Research Sources
2.5.3 Assumptions
3 Market Trend Analysis
3.1 Introduction
3.2 Drivers
3.3 Restraints
3.4 Opportunities
3.5 Threats
3.6 Technology Analysis
3.7 End User Analysis
3.8 Emerging Markets
3.9 Impact of Covid-19
4 Porters Five Force Analysis
4.1 Bargaining power of suppliers
4.2 Bargaining power of buyers
4.3 Threat of substitutes
4.4 Threat of new entrants
4.5 Competitive rivalry
5 Global IOT Market, By Component
5.1 Introduction
5.2 Platform
5.2.1 Cloud Platform
5.2.2 Device Management
5.2.3 Network Management
5.3 Software Solution
5.3.1 Data Management
5.3.2 Network Band Management
5.3.3 Security
5.3.4 Remote Monitoring
5.3.5 Real-Time Streaming Analytics
5.4 Services
5.5 Other Components
6 Global IOT Market, By Organization Size
6.1 Introduction
6.2 Large Enterprises
6.3 Small Enterprises
6.4 Medium Enterprises
7 Global IOT Market, By Technology
7.1 Introduction
7.2 Pressure Sensor
7.3 Network Communicatons
7.4 Radiofrequency Identification
7.5 Near Field Communications
7.6 Other Technologies
8 Global IOT Market, By End User
8.1 Introduction
8.2 Smart Manufacturing
8.2.1 Asset Tracking and Remote Management
8.2.2 Production Optimization
8.2.3 Workforce Management
8.3 Smart transportation/mobility
8.3.1 Fleet Management
8.3.2 Cargo Monitoring
8.3.3 Traffic Management
8.3.4 Ticketing and Toll Collection
8.4 Smart Energy & Utilities
8.4.1 Energy Efficiency
8.4.2 Energy Transmission and Distribution
8.4.3 Energy Consumption
8.5 Smart Retail
8.5.1 Geomarketing and Advertising
8.5.2 Smart Payment and Customer Experience
8.6 Connected Healthcare
8.6.1 Telemedicine
8.6.2 Clinical Operations Management
8.6.3 Imaging and Diagnostics
8.7 Smart Agriculture
8.7.1 Field and Crop Monitoring
8.7.2 Weather Monitoring
8.8 Smart Buildings
8.8.1 Identity and Access Management
8.8.2 Smart Water Management
8.8.3 Automation and Control
8.9 Other End Users
9 Global IOT Market, By Geography
9.1 Introduction
9.2 North America
9.2.1 US
9.2.2 Canada
9.2.3 Mexico
9.3 Europe
9.3.1 Germany
9.3.2 UK
9.3.3 Italy
9.3.4 France
9.3.5 Spain
9.3.6 Rest of Europe
9.4 Asia Pacific
9.4.1 Japan
9.4.2 China
9.4.3 India
9.4.4 Australia
9.4.5 New Zealand
9.4.6 South Korea
9.4.7 Rest of Asia Pacific
9.5 South America
9.5.1 Argentina
9.5.2 Brazil
9.5.3 Chile
9.5.4 Rest of South America
9.6 Middle East & Africa
9.6.1 Saudi Arabia
9.6.2 UAE
9.6.3 Qatar
9.6.4 South Africa
9.6.5 Rest of Middle East & Africa
10 Key Developments
10.1 Agreements, Partnerships, Collaborations and Joint Ventures
10.2 Acquisitions & Mergers
10.3 New Product Launch
10.4 Expansions
10.5 Other Key Strategies
11 Company Profiling
11.1 Amazon Web Services
11.2 Cisco Systems
11.3 GE
11.4 Google
11.5 IBM Corporation
11.6 Intel Corporation
11.7 Microsoft Corporation
11.8 Oracle Corporation
11.9 Power Trading Corportion (PTC)
11.10 Qualcomm
11.11 SAP SE
11.12 Siemens AG
List of Tables
1 Global IOT Market Outlook, By Region (2021-2030) ($MN)
2 Global IOT Market Outlook, By Component (2021-2030) ($MN)
3 Global IOT Market Outlook, By Platform (2021-2030) ($MN)
4 Global IOT Market Outlook, By Cloud Platform (2021-2030) ($MN)
5 Global IOT Market Outlook, By Device Management (2021-2030) ($MN)
6 Global IOT Market Outlook, By Network Management (2021-2030) ($MN)
7 Global IOT Market Outlook, By Software Solution (2021-2030) ($MN)
8 Global IOT Market Outlook, By Data Management (2021-2030) ($MN)
9 Global IOT Market Outlook, By Network Band Management (2021-2030) ($MN)
10 Global IOT Market Outlook, By Security (2021-2030) ($MN)
11 Global IOT Market Outlook, By Remote Monitoring (2021-2030) ($MN)
12 Global IOT Market Outlook, By Real-Time Streaming Analytics (2021-2030) ($MN)
13 Global IOT Market Outlook, By Services (2021-2030) ($MN)
14 Global IOT Market Outlook, By Other Components (2021-2030) ($MN)
15 Global IOT Market Outlook, By Organization Size (2021-2030) ($MN)
16 Global IOT Market Outlook, By Large Enterprises (2021-2030) ($MN)
17 Global IOT Market Outlook, By Small Enterprises (2021-2030) ($MN)
18 Global IOT Market Outlook, By Medium Enterprises (2021-2030) ($MN)
19 Global IOT Market Outlook, By Technology (2021-2030) ($MN)
20 Global IOT Market Outlook, By Pressure Sensor (2021-2030) ($MN)
21 Global IOT Market Outlook, By Network Communicatons (2021-2030) ($MN)
22 Global IOT Market Outlook, By Radiofrequency Identification (2021-2030) ($MN)
23 Global IOT Market Outlook, By Near Field Communications (2021-2030) ($MN)
24 Global IOT Market Outlook, By Other Technologies (2021-2030) ($MN)
25 Global IOT Market Outlook, By End User (2021-2030) ($MN)
26 Global IOT Market Outlook, By Smart Manufacturing (2021-2030) ($MN)
27 Global IOT Market Outlook, By Asset tracking and remote management (2021-2030) ($MN)
28 Global IOT Market Outlook, By Production optimization (2021-2030) ($MN)
29 Global IOT Market Outlook, By Workforce management (2021-2030) ($MN)
30 Global IOT Market Outlook, By Smart transportation/mobility (2021-2030) ($MN)
31 Global IOT Market Outlook, By Fleet management (2021-2030) ($MN)
32 Global IOT Market Outlook, By Cargo monitoring (2021-2030) ($MN)
33 Global IOT Market Outlook, By Traffic management (2021-2030) ($MN)
34 Global IOT Market Outlook, By Ticketing and toll collection (2021-2030) ($MN)
35 Global IOT Market Outlook, By Smart energy & utilities (2021-2030) ($MN)
36 Global IOT Market Outlook, By Energy efficiency (2021-2030) ($MN)
37 Global IOT Market Outlook, By Energy transmission and distribution (2021-2030) ($MN)
38 Global IOT Market Outlook, By Energy consumption (2021-2030) ($MN)
39 Global IOT Market Outlook, By Smart retail (2021-2030) ($MN)
40 Global IOT Market Outlook, By Geomarketing and advertising (2021-2030) ($MN)
41 Global IOT Market Outlook, By Smart payment and customer experience (2021-2030) ($MN)
42 Global IOT Market Outlook, By Connected healthcare (2021-2030) ($MN)
43 Global IOT Market Outlook, By Telemedicine (2021-2030) ($MN)
44 Global IOT Market Outlook, By Clinical operations management (2021-2030) ($MN)
45 Global IOT Market Outlook, By Imaging and diagnostics (2021-2030) ($MN)
46 Global IOT Market Outlook, By Smart agriculture (2021-2030) ($MN)
47 Global IOT Market Outlook, By Field and crop monitoring (2021-2030) ($MN)
48 Global IOT Market Outlook, By Weather monitoring (2021-2030) ($MN)
49 Global IOT Market Outlook, By Smart buildings (2021-2030) ($MN)
50 Global IOT Market Outlook, By Identity and access management (2021-2030) ($MN)
51 Global IOT Market Outlook, By Smart water management (2021-2030) ($MN)
52 Global IOT Market Outlook, By Automation and control (2021-2030) ($MN)
53 Global IOT Market Outlook, By Other End Users (2021-2030) ($MN)
List of Figures
RESEARCH METHODOLOGY

We at ‘Stratistics’ opt for an extensive research approach which involves data mining, data validation, and data analysis. The various research sources include in-house repository, secondary research, competitor’s sources, social media research, client internal data, and primary research.
Our team of analysts prefers the most reliable and authenticated data sources in order to perform the comprehensive literature search. With access to most of the authenticated data bases our team highly considers the best mix of information through various sources to obtain extensive and accurate analysis.
Each report takes an average time of a month and a team of 4 industry analysts. The time may vary depending on the scope and data availability of the desired market report. The various parameters used in the market assessment are standardized in order to enhance the data accuracy.
Data Mining
The data is collected from several authenticated, reliable, paid and unpaid sources and is filtered depending on the scope & objective of the research. Our reports repository acts as an added advantage in this procedure. Data gathering from the raw material suppliers, distributors and the manufacturers is performed on a regular basis, this helps in the comprehensive understanding of the products value chain. Apart from the above mentioned sources the data is also collected from the industry consultants to ensure the objective of the study is in the right direction.
Market trends such as technological advancements, regulatory affairs, market dynamics (Drivers, Restraints, Opportunities and Challenges) are obtained from scientific journals, market related national & international associations and organizations.
Data Analysis
From the data that is collected depending on the scope & objective of the research the data is subjected for the analysis. The critical steps that we follow for the data analysis include:
- Product Lifecycle Analysis
- Competitor analysis
- Risk analysis
- Porters Analysis
- PESTEL Analysis
- SWOT Analysis
The data engineering is performed by the core industry experts considering both the Marketing Mix Modeling and the Demand Forecasting. The marketing mix modeling makes use of multiple-regression techniques to predict the optimal mix of marketing variables. Regression factor is based on a number of variables and how they relate to an outcome such as sales or profits.
Data Validation
The data validation is performed by the exhaustive primary research from the expert interviews. This includes telephonic interviews, focus groups, face to face interviews, and questionnaires to validate our research from all aspects. The industry experts we approach come from the leading firms, involved in the supply chain ranging from the suppliers, distributors to the manufacturers and consumers so as to ensure an unbiased analysis.
We are in touch with more than 15,000 industry experts with the right mix of consultants, CEO's, presidents, vice presidents, managers, experts from both supply side and demand side, executives and so on.
The data validation involves the primary research from the industry experts belonging to:
- Leading Companies
- Suppliers & Distributors
- Manufacturers
- Consumers
- Industry/Strategic Consultants
Apart from the data validation the primary research also helps in performing the fill gap research, i.e. providing solutions for the unmet needs of the research which helps in enhancing the reports quality.
For more details about research methodology, kindly write to us at info@strategymrc.com
Frequently Asked Questions
In case of any queries regarding this report, you can contact the customer service by filing the “Inquiry Before Buy” form available on the right hand side. You may also contact us through email: info@strategymrc.com or phone: +1-301-202-5929
Yes, the samples are available for all the published reports. You can request them by filling the “Request Sample” option available in this page.
Yes, you can request a sample with your specific requirements. All the customized samples will be provided as per the requirement with the real data masked.
All our reports are available in Digital PDF format. In case if you require them in any other formats, such as PPT, Excel etc you can submit a request through “Inquiry Before Buy” form available on the right hand side. You may also contact us through email: info@strategymrc.com or phone: +1-301-202-5929
We offer a free 15% customization with every purchase. This requirement can be fulfilled for both pre and post sale. You may send your customization requirements through email at info@strategymrc.com or call us on +1-301-202-5929.
We have 3 different licensing options available in electronic format.
- Single User Licence: Allows one person, typically the buyer, to have access to the ordered product. The ordered product cannot be distributed to anyone else.
- 2-5 User Licence: Allows the ordered product to be shared among a maximum of 5 people within your organisation.
- Corporate License: Allows the product to be shared among all employees of your organisation regardless of their geographical location.
All our reports are typically be emailed to you as an attachment.
To order any available report you need to register on our website. The payment can be made either through CCAvenue or PayPal payments gateways which accept all international cards.
We extend our support to 6 months post sale. A post sale customization is also provided to cover your unmet needs in the report.
Request Customization
We offer complimentary customization of up to 15% with every purchase. To share your customization requirements, feel free to email us at info@strategymrc.com or call us on +1-301-202-5929. .
Please Note: Customization within the 15% threshold is entirely free of charge. If your request exceeds this limit, we will conduct a feasibility assessment. Following that, a detailed quote and timeline will be provided.
WHY CHOOSE US ?

Assured Quality
Best in class reports with high standard of research integrity

24X7 Research Support
Continuous support to ensure the best customer experience.

Free Customization
Adding more values to your product of interest.

Safe & Secure Access
Providing a secured environment for all online transactions.

Trusted by 600+ Brands
Serving the most reputed brands across the world.