
Low Cost Carrier Market
Low Cost Carrier Market Forecasts to 2030 - Global Analysis By Aircraft Type (Narrow-Body, Wide-Body and Other Aircraft Types), Purpose (Business Travel, Visual Flight Rules (VFR), Leisure Travel and Other Purposes), Operation, Distribution Channel and By Geography

|
Years Covered |
2021-2030 |
|
Estimated Year Value (2023) |
US $259.1 BN |
|
Projected Year Value (2030) |
US $880.8 BN |
|
CAGR (2023 - 2030) |
19.1% |
|
Regions Covered |
North America, Europe, Asia Pacific, South America, and Middle East & Africa |
|
Countries Covered |
US, Canada, Mexico, Germany, UK, Italy, France, Spain, Japan, China, India, Australia, New Zealand, South Korea, Rest of Asia Pacific, South America, Argentina, Brazil, Chile, Middle East & Africa, Saudi Arabia, UAE, Qatar, and South Africa |
|
Largest Market |
North America |
|
Highest Growing Market |
Europe |
According to Stratistics MRC, the Global Low Cost Carrier Market is accounted for $259.1 billion in 2023 and is expected to reach $880.8 billion by 2030 growing at a CAGR of 19.1% during the forecast period. A low-cost carrier (LCC) is an airline that focuses on providing affordable air travel by offering budget-friendly ticket prices and minimizing operational expenses. LCCs typically adopt a no-frills approach, charging passengers for additional services like meals, baggage, and seat selection. These airlines streamline operations, often utilizing a single aircraft type and flying point-to-point routes to reduce turnaround times.
According to the IATA, The Indian Domestic market, with a demand growth of 18.6% annually, had the fastest full-year domestic growth rate.
Market Dynamics:
Driver:
Flexible fleet management
LCCs adopted innovative strategies to optimize their fleets, allowing for increased efficiency and cost savings. The adoption of a standardized fleet of aircraft models, which streamlined operational procedures such as training and maintenance, was one of the main motivators. Furthermore, LCCs often lease aircraft instead of owning them outright, providing the flexibility to adjust fleet size based on demand fluctuations, which is driving this market size.
Restraint:
High fixed costs
Purchasing or leasing aircraft requires substantial upfront capital, and maintaining a fleet involves ongoing expenses such as aircraft maintenance, fuel costs, and insurance. LCCs need to invest in infrastructure such as airports, ground handling facilities, and ticketing systems, which are typically fixed and require substantial initial investment. Moreover, regulatory compliance and safety standards impose additional fixed costs on LCCs, which impede this market expansion.
Opportunity:
Innovative business models
Innovations in aircraft design, such as the development of fuel-efficient engines and lightweight materials, have significantly reduced operational costs for LCCs. Moreover, advancements in reservation systems, online booking platforms, and mobile technologies have streamlined operational processes and enhanced efficiency. Advancements in communication technologies facilitate real-time monitoring of flight operations, enabling quick responses to disruptions and enhancing overall reliability, which is driving this market growth.
Threat:
Lack of awareness
The lack of awareness is due to the dominance of traditional full-service airlines in the market. Established full-service carriers often have well-known brand names and long-standing customer loyalty. As a result, potential customers may be more familiar with these airlines and may not actively seek out or consider LCC options. Moreover, the lack of awareness can also be attributed to limited route networks, which is hindering this market size.
Covid-19 Impact
The COVID-19 pandemic has had profound negative impacts on the low-cost carrier (LCC) market globally, including in regions like North America and Europe. Travel restrictions, lockdowns, and a decline in consumer confidence have led to a significant reduction in air travel demand. In addition, the imposition of strict quarantine measures and government restrictions forced LCCs to ground a substantial portion of their fleets, leading to revenue losses and financial strain, which further intensified the challenges for LCCs.
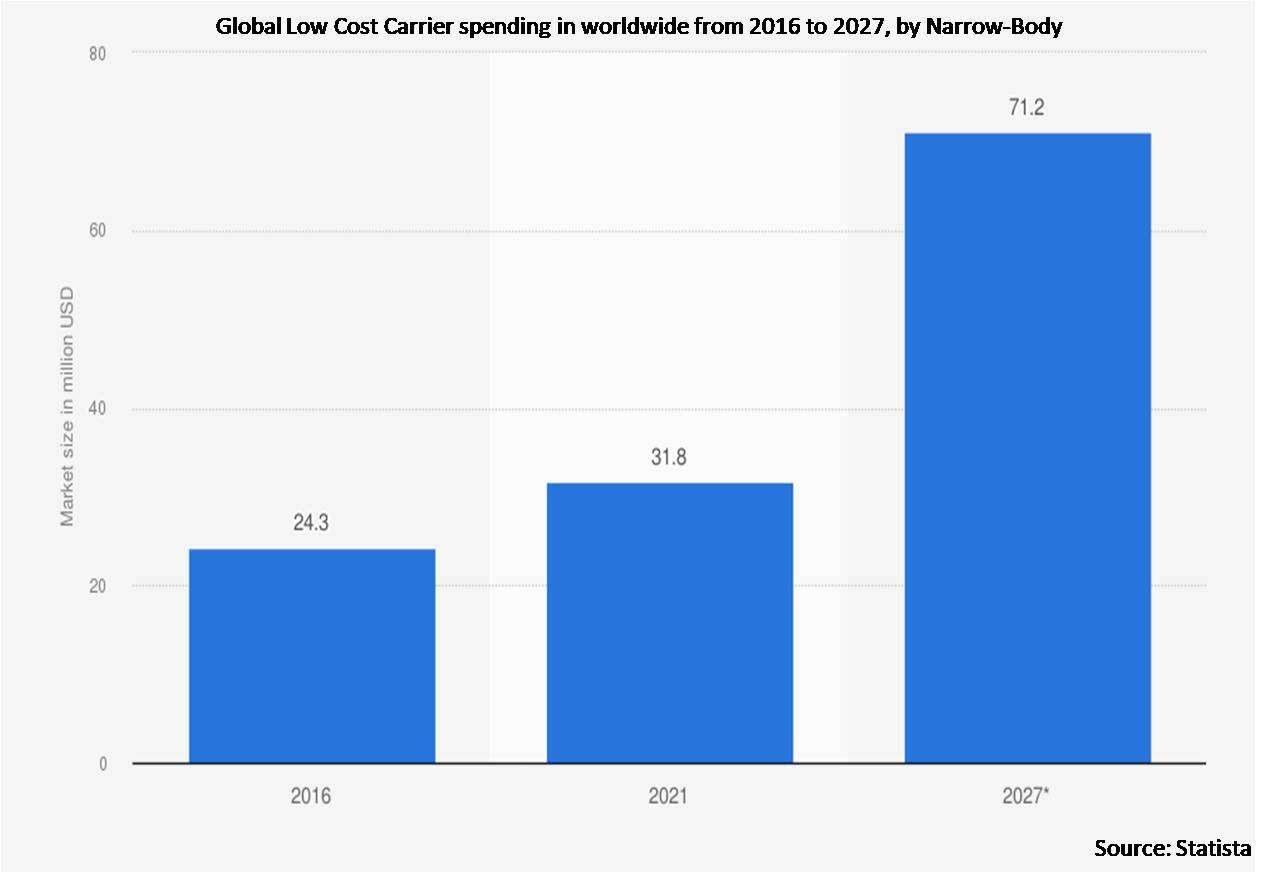
The narrow-body segment is expected to be the largest during the forecast period
The narrow-body segment is estimated to hold the largest share due to the fact that they operate single-aisle aircraft, known as narrow-body or short-haul planes. Narrow-body LCCs are designed to cater to short- to medium-haul journeys, offering cost-effective travel options for passengers seeking affordable flights within specific regions. Moreover, the flexibility of narrow-body aircraft allows LCCs to adapt to changing demand, explore a variety of routes, and drive this segment’s expansion.
The visual flight rules (VFR) segment is expected to have the highest CAGR during the forecast period
The visual flight rules (VFR) segment is anticipated to have highest CAGR during the forecast period due to the airlines prioritizing short-haul routes that adhere to VFR guidelines, focusing on point-to-point travel within the visual range. VFR operations involve flying primarily by visual reference to the ground, allowing for cost-effective navigation and simplified air traffic control procedures. In addition, this strategy enables these carriers to offer competitive ticket prices for passengers on regional and short-haul routes, which is boosting this segment’s growth.
Region with largest share:
North America commanded the largest market share during the extrapolated period owing to robust competition, route expansions, and technological innovations. LCCs in the region, such as Southwest Airlines and Spirit Airlines, have pioneered the no-frills model, offering affordable air travel options and stimulating passenger demand. Furthermore, the introduction of digital technologies, mobile apps, and online booking platforms has streamlined the passenger experience, enabling LCCs to reduce distribution costs and enhance customer convenience, which is propelling this region’s expansion.
Region with highest CAGR:
Europe is expected to witness highest CAGR over the projection period, owing to substantial growth and transformation reshaping the continent's aviation landscape. Pioneered by airlines like Ryanair and EasyJet, the European LCC sector emphasizes affordability, operational efficiency, and expanded route networks. Additionally, strategic partnerships and alliances with other carriers, as well as code-sharing agreements, have played a role in extending the reach of European LCCs, which thereby boosts this region’s growth.

Key players in the market
Some of the key players in the Low Cost Carrier Market include Alaska Air Group, Inc., Air Arabia PJSC, Indigo, AirAsia Group Berhad, Azul S.A, Norweigan Air Shuttle, and easyJet, Ryan Air, JetBlue Airways Corporation, Spicejet Ltd, Southwest Airlines Co, Spirit Airlines and Westjet Airlines Ltd.
Key Developments:
In January 2024, IndiGo, India’s preferred airline, has announced direct flights between Dubai and Surat. The addition of this strategic route to the 6E network is designed to facilitate seamless travel for tourists and business travellers and enhance bilateral economic growth and relations between India and the UAE.
In January 2024, IndiGo, has signed a Memorandum of Understanding (MoU) with CAE Simulation Training Private Limited (CSTPL) to provide Flight Crew Training for its fleet of ATR aircraft.
In January 2024, Ryanair announced a new partnership agreement with approved OTA, Kiwi.com, which guarantees that Kiwi will now have direct access to the Ryanair.com website without screenscraping, and Kiwi agree to provide their customers with low Ryanair prices.
Aircraft Types Covered:
• Narrow-Body
• Wide-Body
• Other Aircraft Types
Purpose Covered:
• Business Travel
• Visual Flight Rules (VFR)
• Leisure Travel
• Other Purposes
Operations Covered:
• Domestic
• International
Distribution Channels Covered:
• Travel Agency
• Online
• Other Distribution Channels
Regions Covered:
• North America
o US
o Canada
o Mexico
• Europe
o Germany
o UK
o Italy
o France
o Spain
o Rest of Europe
• Asia Pacific
o Japan
o China
o India
o Australia
o New Zealand
o South Korea
o Rest of Asia Pacific
• South America
o Argentina
o Brazil
o Chile
o Rest of South America
• Middle East & Africa
o Saudi Arabia
o UAE
o Qatar
o South Africa
o Rest of Middle East & Africa
What our report offers:
- Market share assessments for the regional and country-level segments
- Strategic recommendations for the new entrants
- Covers Market data for the years 2021, 2022, 2023, 2026, and 2030
- Market Trends (Drivers, Constraints, Opportunities, Threats, Challenges, Investment Opportunities, and recommendations)
- Strategic recommendations in key business segments based on the market estimations
- Competitive landscaping mapping the key common trends
- Company profiling with detailed strategies, financials, and recent developments
- Supply chain trends mapping the latest technological advancements
Free Customization Offerings:
All the customers of this report will be entitled to receive one of the following free customization options:
• Company Profiling
o Comprehensive profiling of additional market players (up to 3)
o SWOT Analysis of key players (up to 3)
• Regional Segmentation
o Market estimations, Forecasts and CAGR of any prominent country as per the client's interest (Note: Depends on feasibility check)
• Competitive Benchmarking
Benchmarking of key players based on product portfolio, geographical presence, and strategic alliances
Table of Contents
1 Executive Summary
2 Preface
2.1 Abstract
2.2 Stake Holders
2.3 Research Scope
2.4 Research Methodology
2.4.1 Data Mining
2.4.2 Data Analysis
2.4.3 Data Validation
2.4.4 Research Approach
2.5 Research Sources
2.5.1 Primary Research Sources
2.5.2 Secondary Research Sources
2.5.3 Assumptions
3 Market Trend Analysis
3.1 Introduction
3.2 Drivers
3.3 Restraints
3.4 Opportunities
3.5 Threats
3.6 Emerging Markets
3.7 Impact of Covid-19
4 Porters Five Force Analysis
4.1 Bargaining power of suppliers
4.2 Bargaining power of buyers
4.3 Threat of substitutes
4.4 Threat of new entrants
4.5 Competitive rivalry
5 Global Low Cost Carrier Market, By Aircraft Type
5.1 Introduction
5.2 Narrow-Body
5.3 Wide-Body
5.4 Other Aircraft Types
6 Global Low Cost Carrier Market, By Purpose
6.1 Introduction
6.2 Business Travel
6.3 Visual Flight Rules (VFR)
6.4 Leisure Travel
6.5 Other Purposes
7 Global Low Cost Carrier Market, By Operation
7.1 Introduction
7.2 Domestic
7.3 International
8 Global Low Cost Carrier Market, By Distribution Channel
8.1 Introduction
8.2 Travel Agency
8.3 Online
8.4 Other Distribution Channels
9 Global Low Cost Carrier Market, By Geography
9.1 Introduction
9.2 North America
9.2.1 US
9.2.2 Canada
9.2.3 Mexico
9.3 Europe
9.3.1 Germany
9.3.2 UK
9.3.3 Italy
9.3.4 France
9.3.5 Spain
9.3.6 Rest of Europe
9.4 Asia Pacific
9.4.1 Japan
9.4.2 China
9.4.3 India
9.4.4 Australia
9.4.5 New Zealand
9.4.6 South Korea
9.4.7 Rest of Asia Pacific
9.5 South America
9.5.1 Argentina
9.5.2 Brazil
9.5.3 Chile
9.5.4 Rest of South America
9.6 Middle East & Africa
9.6.1 Saudi Arabia
9.6.2 UAE
9.6.3 Qatar
9.6.4 South Africa
9.6.5 Rest of Middle East & Africa
10 Key Developments
10.1 Agreements, Partnerships, Collaborations and Joint Ventures
10.2 Acquisitions & Mergers
10.3 New Product Launch
10.4 Expansions
10.5 Other Key Strategies
11 Company Profiling
11.1 Alaska Air Group, Inc.
11.2 Air Arabia PJSC
11.3 Indigo
11.4 AirAsia Group Berhad
11.5 Azul S.A
11.6 Norweigan Air Shuttle
11.7 easyJet
11.8 Ryan Air
11.9 JetBlue Airways Corporation
11.10 Spicejet Ltd
11.11 Southwest Airlines Co
11.12 Spirit Airlines
11.13 Westjet Airlines Ltd
List of Tables
1 Global Low Cost Carrier Market Outlook, By Region (2021-2030) ($MN)
2 Global Low Cost Carrier Market Outlook, By Aircraft Type (2021-2030) ($MN)
3 Global Low Cost Carrier Market Outlook, By Narrow-Body (2021-2030) ($MN)
4 Global Low Cost Carrier Market Outlook, By Wide-Body (2021-2030) ($MN)
5 Global Low Cost Carrier Market Outlook, By Other Aircraft Types (2021-2030) ($MN)
6 Global Low Cost Carrier Market Outlook, By Purpose (2021-2030) ($MN)
7 Global Low Cost Carrier Market Outlook, By Business Travel (2021-2030) ($MN)
8 Global Low Cost Carrier Market Outlook, By Visual Flight Rules (VFR) (2021-2030) ($MN)
9 Global Low Cost Carrier Market Outlook, By Leisure Travel (2021-2030) ($MN)
10 Global Low Cost Carrier Market Outlook, By Other Purposes (2021-2030) ($MN)
11 Global Low Cost Carrier Market Outlook, By Operation (2021-2030) ($MN)
12 Global Low Cost Carrier Market Outlook, By Domestic (2021-2030) ($MN)
13 Global Low Cost Carrier Market Outlook, By International (2021-2030) ($MN)
14 Global Low Cost Carrier Market Outlook, By Distribution Channel (2021-2030) ($MN)
15 Global Low Cost Carrier Market Outlook, By Travel Agency (2021-2030) ($MN)
16 Global Low Cost Carrier Market Outlook, By Online (2021-2030) ($MN)
17 Global Low Cost Carrier Market Outlook, By Other Distribution Channels (2021-2030) ($MN)
18 North America Low Cost Carrier Market Outlook, By Country (2021-2030) ($MN)
19 North America Low Cost Carrier Market Outlook, By Aircraft Type (2021-2030) ($MN)
20 North America Low Cost Carrier Market Outlook, By Narrow-Body (2021-2030) ($MN)
21 North America Low Cost Carrier Market Outlook, By Wide-Body (2021-2030) ($MN)
22 North America Low Cost Carrier Market Outlook, By Other Aircraft Types (2021-2030) ($MN)
23 North America Low Cost Carrier Market Outlook, By Purpose (2021-2030) ($MN)
24 North America Low Cost Carrier Market Outlook, By Business Travel (2021-2030) ($MN)
25 North America Low Cost Carrier Market Outlook, By Visual Flight Rules (VFR) (2021-2030) ($MN)
26 North America Low Cost Carrier Market Outlook, By Leisure Travel (2021-2030) ($MN)
27 North America Low Cost Carrier Market Outlook, By Other Purposes (2021-2030) ($MN)
28 North America Low Cost Carrier Market Outlook, By Operation (2021-2030) ($MN)
29 North America Low Cost Carrier Market Outlook, By Domestic (2021-2030) ($MN)
30 North America Low Cost Carrier Market Outlook, By International (2021-2030) ($MN)
31 North America Low Cost Carrier Market Outlook, By Distribution Channel (2021-2030) ($MN)
32 North America Low Cost Carrier Market Outlook, By Travel Agency (2021-2030) ($MN)
33 North America Low Cost Carrier Market Outlook, By Online (2021-2030) ($MN)
34 North America Low Cost Carrier Market Outlook, By Other Distribution Channels (2021-2030) ($MN)
35 Europe Low Cost Carrier Market Outlook, By Country (2021-2030) ($MN)
36 Europe Low Cost Carrier Market Outlook, By Aircraft Type (2021-2030) ($MN)
37 Europe Low Cost Carrier Market Outlook, By Narrow-Body (2021-2030) ($MN)
38 Europe Low Cost Carrier Market Outlook, By Wide-Body (2021-2030) ($MN)
39 Europe Low Cost Carrier Market Outlook, By Other Aircraft Types (2021-2030) ($MN)
40 Europe Low Cost Carrier Market Outlook, By Purpose (2021-2030) ($MN)
41 Europe Low Cost Carrier Market Outlook, By Business Travel (2021-2030) ($MN)
42 Europe Low Cost Carrier Market Outlook, By Visual Flight Rules (VFR) (2021-2030) ($MN)
43 Europe Low Cost Carrier Market Outlook, By Leisure Travel (2021-2030) ($MN)
44 Europe Low Cost Carrier Market Outlook, By Other Purposes (2021-2030) ($MN)
45 Europe Low Cost Carrier Market Outlook, By Operation (2021-2030) ($MN)
46 Europe Low Cost Carrier Market Outlook, By Domestic (2021-2030) ($MN)
47 Europe Low Cost Carrier Market Outlook, By International (2021-2030) ($MN)
48 Europe Low Cost Carrier Market Outlook, By Distribution Channel (2021-2030) ($MN)
49 Europe Low Cost Carrier Market Outlook, By Travel Agency (2021-2030) ($MN)
50 Europe Low Cost Carrier Market Outlook, By Online (2021-2030) ($MN)
51 Europe Low Cost Carrier Market Outlook, By Other Distribution Channels (2021-2030) ($MN)
52 Asia Pacific Low Cost Carrier Market Outlook, By Country (2021-2030) ($MN)
53 Asia Pacific Low Cost Carrier Market Outlook, By Aircraft Type (2021-2030) ($MN)
54 Asia Pacific Low Cost Carrier Market Outlook, By Narrow-Body (2021-2030) ($MN)
55 Asia Pacific Low Cost Carrier Market Outlook, By Wide-Body (2021-2030) ($MN)
56 Asia Pacific Low Cost Carrier Market Outlook, By Other Aircraft Types (2021-2030) ($MN)
57 Asia Pacific Low Cost Carrier Market Outlook, By Purpose (2021-2030) ($MN)
58 Asia Pacific Low Cost Carrier Market Outlook, By Business Travel (2021-2030) ($MN)
59 Asia Pacific Low Cost Carrier Market Outlook, By Visual Flight Rules (VFR) (2021-2030) ($MN)
60 Asia Pacific Low Cost Carrier Market Outlook, By Leisure Travel (2021-2030) ($MN)
61 Asia Pacific Low Cost Carrier Market Outlook, By Other Purposes (2021-2030) ($MN)
62 Asia Pacific Low Cost Carrier Market Outlook, By Operation (2021-2030) ($MN)
63 Asia Pacific Low Cost Carrier Market Outlook, By Domestic (2021-2030) ($MN)
64 Asia Pacific Low Cost Carrier Market Outlook, By International (2021-2030) ($MN)
65 Asia Pacific Low Cost Carrier Market Outlook, By Distribution Channel (2021-2030) ($MN)
66 Asia Pacific Low Cost Carrier Market Outlook, By Travel Agency (2021-2030) ($MN)
67 Asia Pacific Low Cost Carrier Market Outlook, By Online (2021-2030) ($MN)
68 Asia Pacific Low Cost Carrier Market Outlook, By Other Distribution Channels (2021-2030) ($MN)
69 South America Low Cost Carrier Market Outlook, By Country (2021-2030) ($MN)
70 South America Low Cost Carrier Market Outlook, By Aircraft Type (2021-2030) ($MN)
71 South America Low Cost Carrier Market Outlook, By Narrow-Body (2021-2030) ($MN)
72 South America Low Cost Carrier Market Outlook, By Wide-Body (2021-2030) ($MN)
73 South America Low Cost Carrier Market Outlook, By Other Aircraft Types (2021-2030) ($MN)
74 South America Low Cost Carrier Market Outlook, By Purpose (2021-2030) ($MN)
75 South America Low Cost Carrier Market Outlook, By Business Travel (2021-2030) ($MN)
76 South America Low Cost Carrier Market Outlook, By Visual Flight Rules (VFR) (2021-2030) ($MN)
77 South America Low Cost Carrier Market Outlook, By Leisure Travel (2021-2030) ($MN)
78 South America Low Cost Carrier Market Outlook, By Other Purposes (2021-2030) ($MN)
79 South America Low Cost Carrier Market Outlook, By Operation (2021-2030) ($MN)
80 South America Low Cost Carrier Market Outlook, By Domestic (2021-2030) ($MN)
81 South America Low Cost Carrier Market Outlook, By International (2021-2030) ($MN)
82 South America Low Cost Carrier Market Outlook, By Distribution Channel (2021-2030) ($MN)
83 South America Low Cost Carrier Market Outlook, By Travel Agency (2021-2030) ($MN)
84 South America Low Cost Carrier Market Outlook, By Online (2021-2030) ($MN)
85 South America Low Cost Carrier Market Outlook, By Other Distribution Channels (2021-2030) ($MN)
86 Middle East & Africa Low Cost Carrier Market Outlook, By Country (2021-2030) ($MN)
87 Middle East & Africa Low Cost Carrier Market Outlook, By Aircraft Type (2021-2030) ($MN)
88 Middle East & Africa Low Cost Carrier Market Outlook, By Narrow-Body (2021-2030) ($MN)
89 Middle East & Africa Low Cost Carrier Market Outlook, By Wide-Body (2021-2030) ($MN)
90 Middle East & Africa Low Cost Carrier Market Outlook, By Other Aircraft Types (2021-2030) ($MN)
91 Middle East & Africa Low Cost Carrier Market Outlook, By Purpose (2021-2030) ($MN)
92 Middle East & Africa Low Cost Carrier Market Outlook, By Business Travel (2021-2030) ($MN)
93 Middle East & Africa Low Cost Carrier Market Outlook, By Visual Flight Rules (VFR) (2021-2030) ($MN)
94 Middle East & Africa Low Cost Carrier Market Outlook, By Leisure Travel (2021-2030) ($MN)
95 Middle East & Africa Low Cost Carrier Market Outlook, By Other Purposes (2021-2030) ($MN)
96 Middle East & Africa Low Cost Carrier Market Outlook, By Operation (2021-2030) ($MN)
97 Middle East & Africa Low Cost Carrier Market Outlook, By Domestic (2021-2030) ($MN)
98 Middle East & Africa Low Cost Carrier Market Outlook, By International (2021-2030) ($MN)
99 Middle East & Africa Low Cost Carrier Market Outlook, By Distribution Channel (2021-2030) ($MN)
100 Middle East & Africa Low Cost Carrier Market Outlook, By Travel Agency (2021-2030) ($MN)
101 Middle East & Africa Low Cost Carrier Market Outlook, By Online (2021-2030) ($MN)
102 Middle East & Africa Low Cost Carrier Market Outlook, By Other Distribution Channels (2021-2030) ($MN)
List of Figures
RESEARCH METHODOLOGY

We at ‘Stratistics’ opt for an extensive research approach which involves data mining, data validation, and data analysis. The various research sources include in-house repository, secondary research, competitor’s sources, social media research, client internal data, and primary research.
Our team of analysts prefers the most reliable and authenticated data sources in order to perform the comprehensive literature search. With access to most of the authenticated data bases our team highly considers the best mix of information through various sources to obtain extensive and accurate analysis.
Each report takes an average time of a month and a team of 4 industry analysts. The time may vary depending on the scope and data availability of the desired market report. The various parameters used in the market assessment are standardized in order to enhance the data accuracy.
Data Mining
The data is collected from several authenticated, reliable, paid and unpaid sources and is filtered depending on the scope & objective of the research. Our reports repository acts as an added advantage in this procedure. Data gathering from the raw material suppliers, distributors and the manufacturers is performed on a regular basis, this helps in the comprehensive understanding of the products value chain. Apart from the above mentioned sources the data is also collected from the industry consultants to ensure the objective of the study is in the right direction.
Market trends such as technological advancements, regulatory affairs, market dynamics (Drivers, Restraints, Opportunities and Challenges) are obtained from scientific journals, market related national & international associations and organizations.
Data Analysis
From the data that is collected depending on the scope & objective of the research the data is subjected for the analysis. The critical steps that we follow for the data analysis include:
- Product Lifecycle Analysis
- Competitor analysis
- Risk analysis
- Porters Analysis
- PESTEL Analysis
- SWOT Analysis
The data engineering is performed by the core industry experts considering both the Marketing Mix Modeling and the Demand Forecasting. The marketing mix modeling makes use of multiple-regression techniques to predict the optimal mix of marketing variables. Regression factor is based on a number of variables and how they relate to an outcome such as sales or profits.
Data Validation
The data validation is performed by the exhaustive primary research from the expert interviews. This includes telephonic interviews, focus groups, face to face interviews, and questionnaires to validate our research from all aspects. The industry experts we approach come from the leading firms, involved in the supply chain ranging from the suppliers, distributors to the manufacturers and consumers so as to ensure an unbiased analysis.
We are in touch with more than 15,000 industry experts with the right mix of consultants, CEO's, presidents, vice presidents, managers, experts from both supply side and demand side, executives and so on.
The data validation involves the primary research from the industry experts belonging to:
- Leading Companies
- Suppliers & Distributors
- Manufacturers
- Consumers
- Industry/Strategic Consultants
Apart from the data validation the primary research also helps in performing the fill gap research, i.e. providing solutions for the unmet needs of the research which helps in enhancing the reports quality.
For more details about research methodology, kindly write to us at info@strategymrc.com
Frequently Asked Questions
In case of any queries regarding this report, you can contact the customer service by filing the “Inquiry Before Buy” form available on the right hand side. You may also contact us through email: info@strategymrc.com or phone: +1-301-202-5929
Yes, the samples are available for all the published reports. You can request them by filling the “Request Sample” option available in this page.
Yes, you can request a sample with your specific requirements. All the customized samples will be provided as per the requirement with the real data masked.
All our reports are available in Digital PDF format. In case if you require them in any other formats, such as PPT, Excel etc you can submit a request through “Inquiry Before Buy” form available on the right hand side. You may also contact us through email: info@strategymrc.com or phone: +1-301-202-5929
We offer a free 15% customization with every purchase. This requirement can be fulfilled for both pre and post sale. You may send your customization requirements through email at info@strategymrc.com or call us on +1-301-202-5929.
We have 3 different licensing options available in electronic format.
- Single User Licence: Allows one person, typically the buyer, to have access to the ordered product. The ordered product cannot be distributed to anyone else.
- 2-5 User Licence: Allows the ordered product to be shared among a maximum of 5 people within your organisation.
- Corporate License: Allows the product to be shared among all employees of your organisation regardless of their geographical location.
All our reports are typically be emailed to you as an attachment.
To order any available report you need to register on our website. The payment can be made either through CCAvenue or PayPal payments gateways which accept all international cards.
We extend our support to 6 months post sale. A post sale customization is also provided to cover your unmet needs in the report.
Request Customization
We offer complimentary customization of up to 15% with every purchase. To share your customization requirements, feel free to email us at info@strategymrc.com or call us on +1-301-202-5929. .
Please Note: Customization within the 15% threshold is entirely free of charge. If your request exceeds this limit, we will conduct a feasibility assessment. Following that, a detailed quote and timeline will be provided.
WHY CHOOSE US ?

Assured Quality
Best in class reports with high standard of research integrity

24X7 Research Support
Continuous support to ensure the best customer experience.

Free Customization
Adding more values to your product of interest.

Safe & Secure Access
Providing a secured environment for all online transactions.

Trusted by 600+ Brands
Serving the most reputed brands across the world.