
Prefabricated Building Systems Market
Prefabricated Building Systems Market Forecasts to 2028 - Global Analysis By Product Type (Skeleton system, Panel System, Cellular System, Combined System and Other Product Types), Type (Permanent and Relocatable), Component (Metal, Non-Metal and Other Components), Weight, Application and By Geography

|
Years Covered |
2020-2028 |
|
Estimated Year Value (2022) |
US $148.58 BN |
|
Projected Year Value (2028) |
US $247.13 BN |
|
CAGR (2022 - 2028) |
6.0% |
|
Regions Covered |
North America, Europe, Asia Pacific, South America, and Middle East & Africa |
|
Countries Covered |
US, Canada, Mexico, Germany, UK, Italy, France, Spain, Japan, China, India, Australia, New Zealand, South Korea, Rest of Asia Pacific, South America, Argentina, Brazil, Chile, Middle East & Africa, Saudi Arabia, UAE, Qatar, and South Africa |
|
Largest Market |
Asia Pacific |
|
Highest Growing Market |
North America |
According to Stratistics MRC, the Global Prefabricated Building Systems Market is accounted for $148.58 billion in 2022 and is expected to reach $247.13 billion by 2028 growing at a CAGR of 8.85% during the forecast period. Prefabricated building systems are modular structures or assemblies of elements and components used in the construction and building sectors. These systems are often manufactured and assembled in factories before being brought to the construction site and installed or used to create structures. Metal, wood, glass, polymers, concrete, and other materials are employed in the manufacture of these systems. Prefabricated building systems are becoming a new trend in the building and construction industries, from setting up industrial facilities to creating residences and commercial spaces.
Market Dynamics:
Driver:
Increasing Government Initiative Bolstering the Growth of the Construction Industry
Building and construction industries are thriving in nations such as India and Singapore, where governments are investing extensively in growing the industry. The Singapore government spends at least S$2 billion every month on public infrastructure, according to the Australian Trade and Investment Commission. Furthermore, the government-wide circular economy program, which aims to build a circular economy in the Netherlands by 2050, is increasing the country's construction sector. Building and construction activity is also expanding as a result of different government efforts, such as foreign direct investment (FDI). Because of their eco-friendliness, flexibility, decreased site interruption, and cost advantages, prefabricated building systems are widely employed in the construction of residential and non-residential buildings.
Restraint:
Transportation and Logistics
Shipping prefabricated building components over long distances can be expensive. The cost of transportation, including fuel, permits, tolls, and handling fees, can add to the overall project expenses. For projects located in remote areas or with limited access, transportation costs may be even higher. Additionally, the availability and condition of transportation infrastructure, such as roads, bridges, and ports, can affect the logistics of transporting prefabricated building components. Inadequate infrastructure can result in delays, additional handling requirements, and increased transportation costs, which would impede the market's expansion.
Opportunity:
Growing infrastructure investments
The growing infrastructure investments are anticipated to boost the growth of the modular construction market because of the increase in industrialization and urbanization in developing nations like China, Vietnam, and India. Additionally, growing commercial real estate investments are anticipated to positively impact the prefabricated construction market's income. The industry is driven by advancing government initiatives to cut down on construction waste and promote green buildings. In addition, the government gives businesses subsidies that help standardize contemporary construction techniques. Shortly, the prefabricated construction industry is anticipated to be driven by rising R&D expenditures for innovative construction solutions.
Threat:
High Initial Costs
Prefabricated building systems can provide long-term cost savings the upfront costs can be relatively high. Setting up manufacturing facilities, investing in specialized machinery, and developing supply chains require significant capital investment. This initial cost barrier can deter some potential customers from adopting prefabricated systems, which may further restrict the growth of the market.
Covid-19 Impact:
During the COVID-19 pandemic is crippling many industries, public construction has been one of the few that has been able to function at some level. While the operation is expected to continue in the short term, work is projected to cease soon due to a variety of factors, such as supply chain disruption, shortages of subcontractors and materials, and the cancellation of cost management contracts. Building and construction activities have been temporarily halted in some places. For example, construction output in the United Kingdom declined by a record 35.0% in Quarter 2 2020 compared to Quarter 1 2020. This decrease in value was caused by the corona virus epidemic. The drop in building and construction operations has drastically reduced demand for prefabricated building systems, which is having a severe influence on the prefabricated building systems industry.
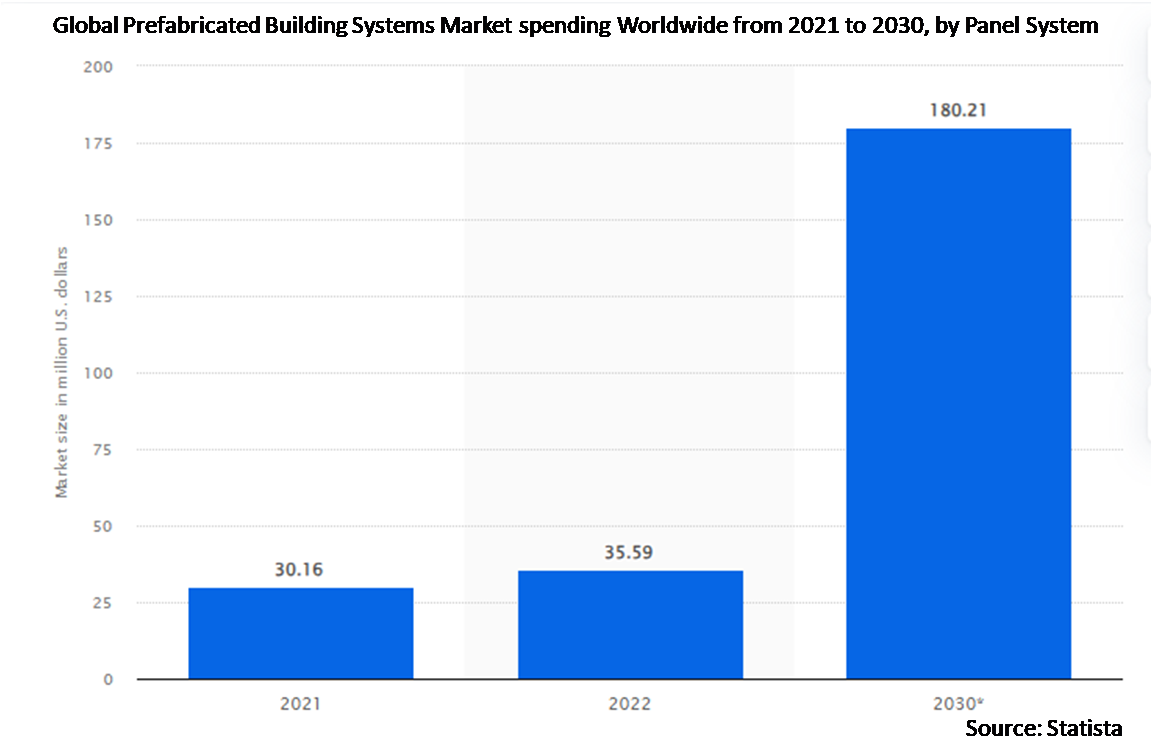
The Panel systems segment is expected to be the largest during the forecast period
The panel systems segment held the largest share in the prefabricated building systems market owing to the increasing demand for panel systems. The demand for panel systems such as ventilated thermal panels is on the rise in the residential and non-residential sectors owing to the superior properties they offer, such as short production times, easy transportation and installation services, adaptable designs, easy relocation, the ability to be used in any kind of environmental conditions, and more. In addition, the ventilated thermal panel (VTP)-based wall and roof system offers homeowners and builders a faster and more energy-efficient building. Also, prefabricated building systems significantly reduce on-site waste removal costs while eliminating costly material overruns and delays caused by weather and material shortages. Thus, these extensive characteristics of panel systems are the key factors anticipated to boost the usage of prefabricated building systems during the forecast period.
The Commercial segment is expected to have the highest CAGR during the forecast period
The commercial segment had the highest CAGR in the prefabricated building systems market, owing to the rising use of prefabricated building systems in the commercial sector. Prefabricated building systems are widely utilized in the construction of railways, highways, mining, hydropower, petroleum, tourism, and military affairs such as offices, accommodations, canteens, recreation, gyms, and more. It is extensively employed in these situations since prefabrication takes less than half the time that traditional construction does. This is due to better upfront planning, the elimination of on-site weather factors, subcontractor scheduling delays, and faster manufacturing because numerous sections may be manufactured simultaneously.
Region with largest share:
The Asia Pacific region dominated the global market share. With growing residential and industrial activities, the demand for prefabricated building systems is increasing in the region. Despite volatile growth in the real estate sector, the significant development of rail and road infrastructure by the Chinese government in order to withstand the demand stemming from the growing industrial and service sectors has resulted in significant growth in the Chinese construction industry in recent years. As the construction industry is dominated by state-owned and private enterprises, increased government and private spending in this regard is expected to push the industry toward global primacy.
Region with highest CAGR:
North America will continue to dominate the Prefabricated Building Systems market during the forecast period. The prefabricated building systems market in North America has been steadily growing due to factors such as cost-efficiency, time savings, sustainability, and advancements in manufacturing technologies. Prefabricated building systems have gained traction in the residential sector, particularly in the construction of single-family homes, multi-family housing, and affordable housing units. Prefabricated homes offer faster construction time, reduced labor costs, and improved energy efficiency. Moreover, the integration of Building Information Modelling (BIM), robotics, automation, and digitalization has enhanced the design, production, and installation processes in the prefabricated building systems market. These advancements have improved accuracy, productivity, and customization capabilities.

Key players in the market
Some of the key players in Prefabricated Building Systems market include Abtech Inc., Algeco Scotsman, Alta-Fab Structures, Art’s Way Manufacturing, Astron Buildings, Butler Manufacturing Company, Champion Home Builders, Inc., Cimc Modular Building Systems Holding, Clayton Homes, Inc., DuBox, Fleetwood Australia, GRAITC Groups, Guerdon Modular Buildings, Hickory Group, Horizon North Logistics, Katerra, Kirby Building Systems LLC, Kleusberg GmbH & Co KG, KOMA Modular, Laing O'Rourke, Lendlease Corporation, Lindal Cedar Homes, Inc., Modern Prefab Systems Pvt. Ltd., Modular Engineering, Niko Prefab Building Systems Pvt. Ltd., Par-Kut Internationals, Red Sea Housing Services, Ritz-Craft Corporation, Inc., Schulte Building Systems Inc., Skyline Champion Corporation, United Partition Systems Inc. and Vardhman Pre-Engineered Building Systems.
Key Developments:
In March 2023, DuBox, has opened a new factory at Rabigh, Saudi Arabia. Spread over a 70,000-sq-m area, it will design, manufacture and assemble safer, greener and smarter buildings
In April 2022, Art’s Way Manufacturing launches new branding and branding initiative, positioning the company as a legacy-leaving, forward-thinking power player in equipment manufacturing
In March 2021, ScotBilt shipped over 1,600 homes from its two manufacturing facilities in Georgia providing affordable housing throughout Alabama, Florida, Georgia and the Carolinas
Product Types Covered:
• Skeleton system
• Panel System
• Cellular System
• Combined System
• Other Product Types
Types Covered:
• Permanent
• Relocatable
Components Covered:
• Metal
• Non-Metal
• Other Components
Weights Covered:
• Light Weight (less than 2 tons)
• Heavy Weight (more than 2 tons)
Applications Covered:
• Residential
• Commercial
• Non-Residential
• Industrial
• Other Applications
Regions Covered:
• North America
o US
o Canada
o Mexico
• Europe
o Germany
o UK
o Italy
o France
o Spain
o Rest of Europe
• Asia Pacific
o Japan
o China
o India
o Australia
o New Zealand
o South Korea
o Rest of Asia Pacific
• South America
o Argentina
o Brazil
o Chile
o Rest of South America
• Middle East & Africa
o Saudi Arabia
o UAE
o Qatar
o South Africa
o Rest of Middle East & Africa
What our report offers:
- Market share assessments for the regional and country-level segments
- Strategic recommendations for the new entrants
- Covers Market data for the years 2020, 2021, 2022, 2025, and 2028
- Market Trends (Drivers, Constraints, Opportunities, Threats, Challenges, Investment Opportunities, and recommendations)
- Strategic recommendations in key business segments based on the market estimations
- Competitive landscaping mapping the key common trends
- Company profiling with detailed strategies, financials, and recent developments
- Supply chain trends mapping the latest technological advancements
Free Customization Offerings:
All the customers of this report will be entitled to receive one of the following free customization options:
• Company Profiling
o Comprehensive profiling of additional market players (up to 3)
o SWOT Analysis of key players (up to 3)
• Regional Segmentation
o Market estimations, Forecasts and CAGR of any prominent country as per the client's interest (Note: Depends on feasibility check)
• Competitive Benchmarking
Benchmarking of key players based on product portfolio, geographical presence, and strategic alliances
Table of Contents
1 Executive Summary
2 Preface
2.1 Abstract
2.2 Stake Holders
2.3 Research Scope
2.4 Research Methodology
2.4.1 Data Mining
2.4.2 Data Analysis
2.4.3 Data Validation
2.4.4 Research Approach
2.5 Research Sources
2.5.1 Primary Research Sources
2.5.2 Secondary Research Sources
2.5.3 Assumptions
3 Market Trend Analysis
3.1 Introduction
3.2 Drivers
3.3 Restraints
3.4 Opportunities
3.5 Threats
3.6 Product Analysis
3.7 Application Analysis
3.8 Emerging Markets
3.9 Impact of Covid-19
4 Porters Five Force Analysis
4.1 Bargaining power of suppliers
4.2 Bargaining power of buyers
4.3 Threat of substitutes
4.4 Threat of new entrants
4.5 Competitive rivalry
5 Global Prefabricated Building Market, By Product Type
5.1 Introduction
5.2 Skeleton system
5.2.1 H Formed Frames
5.2.2 T Formed Frames
5.3 Panel System
5.3.1 Small Panel Systems
5.3.2 Large Panel Systems
5.4 Cellular System
5.4.1 Complete Cellular Systems
5.4.2 Incomplete Cellular Systems
5.5 Combined System
5.6 Other Product Types
6 Global Prefabricated Building Market, By Type
6.1 Introduction
6.2 Permanent
6.3 Relocatable
7 Global Prefabricated Building Market, By Component
7.1 Introduction
7.2 Metal
7.2.1 Steel
7.2.2 Aluminium
7.3 Non-Metal
7.3.1 Concrete
7.3.2 Glass
7.3.3 Timber
7.4 Other Components
8 Global Prefabricated Building Market, By Weight
8.1 Introduction
8.2 Light Weight (less than 2 tons)
8.3 Heavy Weight (more than 2 tons)
9 Global Prefabricated Building Market, By Application
9.1 Introduction
9.2 Residential
9.2.1 Private Dwellings
9.2.2 Apartments
9.2.3 Consortium
9.3 Commercial
9.3.1 Hospitals
9.3.2 Schools
9.3.3 Hotels
9.3.4 Shopping Malls
9.3.5 Retails
9.3.6 Banks
9.3.7 Airport
9.4 Non-Residential
9.4.1 Infrastructure
9.4.2 Commercial
9.5 Industrial
9.5.1 Oil Refineries
9.5.2 Manufacturing Plants
9.5.3 Chemical Processing Plants
9.6 Other Applications
10 Global Prefabricated Building Market, By Geography
10.1 Introduction
10.2 North America
10.2.1 US
10.2.2 Canada
10.2.3 Mexico
10.3 Europe
10.3.1 Germany
10.3.2 UK
10.3.3 Italy
10.3.4 France
10.3.5 Spain
10.3.6 Rest of Europe
10.4 Asia Pacific
10.4.1 Japan
10.4.2 China
10.4.3 India
10.4.4 Australia
10.4.5 New Zealand
10.4.6 South Korea
10.4.7 Rest of Asia Pacific
10.5 South America
10.5.1 Argentina
10.5.2 Brazil
10.5.3 Chile
10.5.4 Rest of South America
10.6 Middle East & Africa
10.6.1 Saudi Arabia
10.6.2 UAE
10.6.3 Qatar
10.6.4 South Africa
10.6.5 Rest of Middle East & Africa
11 Key Developments
11.1 Agreements, Partnerships, Collaborations and Joint Ventures
11.2 Acquisitions & Mergers
11.3 New Product Launch
11.4 Expansions
11.5 Other Key Strategies
12 Company Profiling
12.1 Abtech Inc.
12.2 Algeco Scotsman
12.3 Alta-Fab Structures
12.4 Art’s Way Manufacturing
12.5 Astron Buildings
12.6 Butler Manufacturing Company
12.7 Champion Home Builders, Inc.
12.8 Cimc Modular Building Systems Holding
12.9 Clayton Homes, Inc.
12.10 DuBox
12.11 Fleetwood Australia
12.12 GRAITC Groups
12.13 Guerdon Modular Buildings
12.14 Hickory Group
12.15 Horizon North Logistics
12.16 Katerra
12.17 Kirby Building Systems LLC
12.18 Kleusberg GmbH & Co KG
12.19 KOMA Modular
12.20 Laing O'Rourke
12.21 Lendlease Corporation
12.22 Lindal Cedar Homes, Inc.
12.23 Modern Prefab Systems Pvt. Ltd.
12.24 Modular Engineering
12.25 Niko Prefab Building Systems Pvt. Ltd.
12.26 Par-Kut Internationals
12.27 Red Sea Housing Services
12.28 Ritz-Craft Corporation, Inc.
12.29 Schulte Building Systems Inc.
12.30 Skyline Champion Corporation
12.31 United Partition Systems Inc.
12.32 Vardhman Pre-Engineered Building Systems
List of Tables
1 Global Prefabricated Building Market Outlook, By Region (2020-2028) ($MN)
2 Global Prefabricated Building Market Outlook, By Product Type (2020-2028) ($MN)
3 Global Prefabricated Building Market Outlook, By Skeleton system (2020-2028) ($MN)
4 Global Prefabricated Building Market Outlook, By H Formed Frames (2020-2028) ($MN)
5 Global Prefabricated Building Market Outlook, By T Formed Frames (2020-2028) ($MN)
6 Global Prefabricated Building Market Outlook, By Panel System (2020-2028) ($MN)
7 Global Prefabricated Building Market Outlook, By Small Panel Systems (2020-2028) ($MN)
8 Global Prefabricated Building Market Outlook, By Large Panel Systems (2020-2028) ($MN)
9 Global Prefabricated Building Market Outlook, By Cellular System (2020-2028) ($MN)
10 Global Prefabricated Building Market Outlook, By Complete Cellular Systems (2020-2028) ($MN)
11 Global Prefabricated Building Market Outlook, By Incomplete Cellular Systems (2020-2028) ($MN)
12 Global Prefabricated Building Market Outlook, By Combined System (2020-2028) ($MN)
13 Global Prefabricated Building Market Outlook, By Other Product Types (2020-2028) ($MN)
14 Global Prefabricated Building Market Outlook, By Type (2020-2028) ($MN)
15 Global Prefabricated Building Market Outlook, By Permanent (2020-2028) ($MN)
16 Global Prefabricated Building Market Outlook, By Relocatable (2020-2028) ($MN)
17 Global Prefabricated Building Market Outlook, By Component (2020-2028) ($MN)
18 Global Prefabricated Building Market Outlook, By Metal (2020-2028) ($MN)
19 Global Prefabricated Building Market Outlook, By Steel (2020-2028) ($MN)
20 Global Prefabricated Building Market Outlook, By Aluminium (2020-2028) ($MN)
21 Global Prefabricated Building Market Outlook, By Non-Metal (2020-2028) ($MN)
22 Global Prefabricated Building Market Outlook, By Concrete (2020-2028) ($MN)
23 Global Prefabricated Building Market Outlook, By Glass (2020-2028) ($MN)
24 Global Prefabricated Building Market Outlook, By Timber (2020-2028) ($MN)
25 Global Prefabricated Building Market Outlook, By Other Components (2020-2028) ($MN)
26 Global Prefabricated Building Market Outlook, By Weight (2020-2028) ($MN)
27 Global Prefabricated Building Market Outlook, By Light Weight (less than 2 tons) (2020-2028) ($MN)
28 Global Prefabricated Building Market Outlook, By Heavy Weight (more than 2 tons) (2020-2028) ($MN)
29 Global Prefabricated Building Market Outlook, By Application (2020-2028) ($MN)
30 Global Prefabricated Building Market Outlook, By Residential (2020-2028) ($MN)
31 Global Prefabricated Building Market Outlook, By Private Dwellings (2020-2028) ($MN)
32 Global Prefabricated Building Market Outlook, By Apartments (2020-2028) ($MN)
33 Global Prefabricated Building Market Outlook, By Consortium (2020-2028) ($MN)
34 Global Prefabricated Building Market Outlook, By Commercial (2020-2028) ($MN)
35 Global Prefabricated Building Market Outlook, By Hospitals (2020-2028) ($MN)
36 Global Prefabricated Building Market Outlook, By Schools (2020-2028) ($MN)
37 Global Prefabricated Building Market Outlook, By Hotels (2020-2028) ($MN)
38 Global Prefabricated Building Market Outlook, By Shopping Malls (2020-2028) ($MN)
39 Global Prefabricated Building Market Outlook, By Retails (2020-2028) ($MN)
40 Global Prefabricated Building Market Outlook, By Banks (2020-2028) ($MN)
41 Global Prefabricated Building Market Outlook, By Airport (2020-2028) ($MN)
42 Global Prefabricated Building Market Outlook, By Non-Residential (2020-2028) ($MN)
43 Global Prefabricated Building Market Outlook, By Infrastructure (2020-2028) ($MN)
44 Global Prefabricated Building Market Outlook, By Commercial (2020-2028) ($MN)
45 Global Prefabricated Building Market Outlook, By Industrial (2020-2028) ($MN)
46 Global Prefabricated Building Market Outlook, By Oil Refineries (2020-2028) ($MN)
47 Global Prefabricated Building Market Outlook, By Manufacturing Plants (2020-2028) ($MN)
48 Global Prefabricated Building Market Outlook, By Chemical Processing Plants (2020-2028) ($MN)
49 Global Prefabricated Building Market Outlook, By Other Applications (2020-2028) ($MN)
Note: Tables for North America, Europe, APAC, South America, and Middle East & Africa Regions are also represented in the same manner as above.
List of Figures
RESEARCH METHODOLOGY

We at ‘Stratistics’ opt for an extensive research approach which involves data mining, data validation, and data analysis. The various research sources include in-house repository, secondary research, competitor’s sources, social media research, client internal data, and primary research.
Our team of analysts prefers the most reliable and authenticated data sources in order to perform the comprehensive literature search. With access to most of the authenticated data bases our team highly considers the best mix of information through various sources to obtain extensive and accurate analysis.
Each report takes an average time of a month and a team of 4 industry analysts. The time may vary depending on the scope and data availability of the desired market report. The various parameters used in the market assessment are standardized in order to enhance the data accuracy.
Data Mining
The data is collected from several authenticated, reliable, paid and unpaid sources and is filtered depending on the scope & objective of the research. Our reports repository acts as an added advantage in this procedure. Data gathering from the raw material suppliers, distributors and the manufacturers is performed on a regular basis, this helps in the comprehensive understanding of the products value chain. Apart from the above mentioned sources the data is also collected from the industry consultants to ensure the objective of the study is in the right direction.
Market trends such as technological advancements, regulatory affairs, market dynamics (Drivers, Restraints, Opportunities and Challenges) are obtained from scientific journals, market related national & international associations and organizations.
Data Analysis
From the data that is collected depending on the scope & objective of the research the data is subjected for the analysis. The critical steps that we follow for the data analysis include:
- Product Lifecycle Analysis
- Competitor analysis
- Risk analysis
- Porters Analysis
- PESTEL Analysis
- SWOT Analysis
The data engineering is performed by the core industry experts considering both the Marketing Mix Modeling and the Demand Forecasting. The marketing mix modeling makes use of multiple-regression techniques to predict the optimal mix of marketing variables. Regression factor is based on a number of variables and how they relate to an outcome such as sales or profits.
Data Validation
The data validation is performed by the exhaustive primary research from the expert interviews. This includes telephonic interviews, focus groups, face to face interviews, and questionnaires to validate our research from all aspects. The industry experts we approach come from the leading firms, involved in the supply chain ranging from the suppliers, distributors to the manufacturers and consumers so as to ensure an unbiased analysis.
We are in touch with more than 15,000 industry experts with the right mix of consultants, CEO's, presidents, vice presidents, managers, experts from both supply side and demand side, executives and so on.
The data validation involves the primary research from the industry experts belonging to:
- Leading Companies
- Suppliers & Distributors
- Manufacturers
- Consumers
- Industry/Strategic Consultants
Apart from the data validation the primary research also helps in performing the fill gap research, i.e. providing solutions for the unmet needs of the research which helps in enhancing the reports quality.
For more details about research methodology, kindly write to us at info@strategymrc.com
Frequently Asked Questions
In case of any queries regarding this report, you can contact the customer service by filing the “Inquiry Before Buy” form available on the right hand side. You may also contact us through email: info@strategymrc.com or phone: +1-301-202-5929
Yes, the samples are available for all the published reports. You can request them by filling the “Request Sample” option available in this page.
Yes, you can request a sample with your specific requirements. All the customized samples will be provided as per the requirement with the real data masked.
All our reports are available in Digital PDF format. In case if you require them in any other formats, such as PPT, Excel etc you can submit a request through “Inquiry Before Buy” form available on the right hand side. You may also contact us through email: info@strategymrc.com or phone: +1-301-202-5929
We offer a free 15% customization with every purchase. This requirement can be fulfilled for both pre and post sale. You may send your customization requirements through email at info@strategymrc.com or call us on +1-301-202-5929.
We have 3 different licensing options available in electronic format.
- Single User Licence: Allows one person, typically the buyer, to have access to the ordered product. The ordered product cannot be distributed to anyone else.
- 2-5 User Licence: Allows the ordered product to be shared among a maximum of 5 people within your organisation.
- Corporate License: Allows the product to be shared among all employees of your organisation regardless of their geographical location.
All our reports are typically be emailed to you as an attachment.
To order any available report you need to register on our website. The payment can be made either through CCAvenue or PayPal payments gateways which accept all international cards.
We extend our support to 6 months post sale. A post sale customization is also provided to cover your unmet needs in the report.
Request Customization
We offer complimentary customization of up to 15% with every purchase. To share your customization requirements, feel free to email us at info@strategymrc.com or call us on +1-301-202-5929. .
Please Note: Customization within the 15% threshold is entirely free of charge. If your request exceeds this limit, we will conduct a feasibility assessment. Following that, a detailed quote and timeline will be provided.
WHY CHOOSE US ?

Assured Quality
Best in class reports with high standard of research integrity

24X7 Research Support
Continuous support to ensure the best customer experience.

Free Customization
Adding more values to your product of interest.

Safe & Secure Access
Providing a secured environment for all online transactions.

Trusted by 600+ Brands
Serving the most reputed brands across the world.