
Self Healing Networks Market
Self-healing Networks Market Forecasts to 2030 - Global Analysis By Component (Services, Solutions and Other Components), Organization Size, Network Type, Deployment Mode, Application, End User and By Geography

|
Years Covered |
2021-2030 |
|
Estimated Year Value (2023) |
US $1,361.4 MN |
|
Projected Year Value (2030) |
US $12,082.0 MN |
|
CAGR (2023 - 2030) |
36.6% |
|
Regions Covered |
North America, Europe, Asia Pacific, South America, and Middle East & Africa |
|
Countries Covered |
US, Canada, Mexico, Germany, UK, Italy, France, Spain, Japan, China, India, Australia, New Zealand, South Korea, Rest of Asia Pacific, South America, Argentina, Brazil, Chile, Middle East & Africa, Saudi Arabia, UAE, Qatar, and South Africa |
|
Largest Market |
North America |
|
Highest Growing Market |
Asia Pacific |
According to Stratistics MRC, the Global Self-Healing Networks Market is accounted for $1,361.4 million in 2023 and is expected to reach $12,082.0 million by 2030 growing at a CAGR of 36.6% during the forecast period. The self-healing network solution helps users handle network problems that are fixed without the involvement of people. All types of outages, malfunctions, and breaches can be found and fixed using self-healing network technologies. The vendor's I/A Series automation platform employs industry-standard Ethernet switches, ports, and fiber optic media in sophisticated mesh configurations to provide multiple transmission channels between various network stations, which is similar to mesh network technology.
According to the Cisco Annual Internet Report, 2018-2023, there were a total of 1,272 breaches, with a total of nearly 163 million records exposed as of November 2019.
Market Dynamics:
Driver:
Increasing use of automation technology
The next-generation services' low latency and determinism, along with the increasing complexity of network infrastructure, make it challenging to deploy and operate networks using static policies and conventional network management techniques. In order to defend highly data-driven, software-defined, and virtualized network components, these disruptive technologies are extremely important. Thus, the development of such disruptive technologies will fuel the market's expansion.
Restraint:
Increase in cyber threats
Cyberattacks are becoming more and more sophisticated, involving malware, phishing, and cryptocurrency, putting the information and assets of businesses, governments, and people at constant risk. However, as the number of linked devices rises, so do the threats, making IoT networks more susceptible to cyberattacks. Additionally, not all network engineers have the necessary training to defend against these attacks, which puts networks' security at risk and could slow the market.
Opportunity:
Advancements in the telecom sector
The telecommunications industry uses self-healing networks a lot to meet growing loads and exponential expansion. As a result of employees integrating their work, relaxation, communication, and shopping schedules into daily routines, communication networks are under a lot of stress. The market expansion is being fueled by the usage of automated provisioning and control platforms, which may simplify networks and consolidate the entire provisioning process.
Threat:
Lack of awareness
The inability of network managers to identify the proper self-healing network technologies could prove to be a major barrier to market expansion. Solutions with various capacities are being offered by a plethora of self-healing network suppliers all around the world. To operate their network infrastructure, many businesses and SMEs do not have access to qualified personnel. This is limiting the market's expansion.
Covid-19 Impact:
Conferences and seminars had to go online as a result of the COVID-19 epidemic, which had an impact on the networking sector. With a focus on creating long-term value, networking businesses are investing in the R&D of networking systems with self-healing capabilities. Leading networking businesses have also concentrated their investments on the development and testing of self-healing network solutions as a result of the changes in short-term company performance and financial results.
The services segment is expected to be the largest during the forecast period
The services segment is expected to be the largest during the forecast period. The need for services is increasing as more companies turn to self-healing networks services to help provide an appropriate platform to run and maintain their applications rather than spending money on the software. In order to provide a suitable platform to run and maintain their applications, businesses are increasingly using self-healing networks services rather than investing in the software, which raises the demand for services.
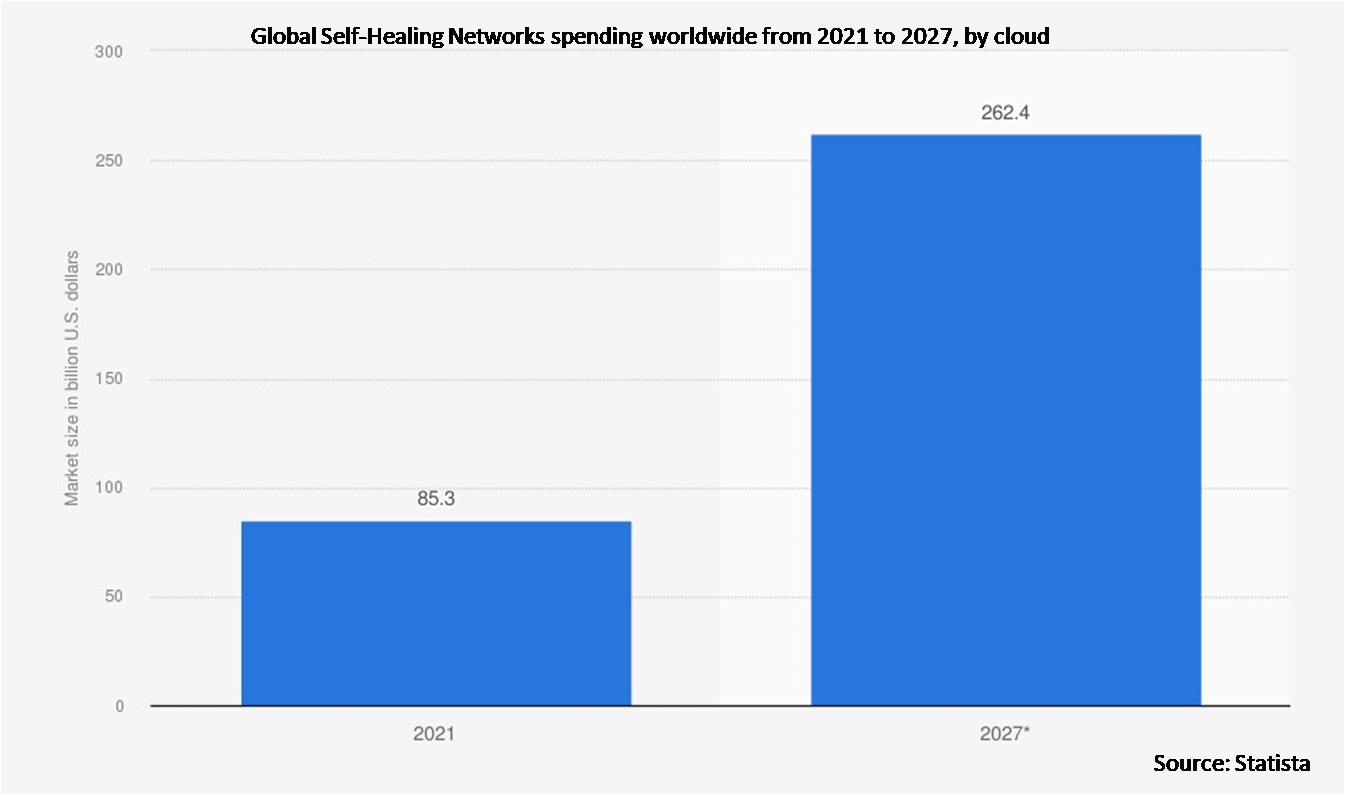
The cloud segment is expected to have the highest CAGR during the forecast period
The cloud segment is expected to have the highest CAGR during the forecast period. Self-healing networks vendors provide on-premises and cloud-based deployment options. The financial stability and IT infrastructure of the enterprises using self-healing networks solutions heavily influence the deployment mode. Cloud computing as a service helps firms ensure increased business agility in addition to helping them manage costs.
Region with largest share:
North America is projected to hold the largest market share during the forecast period. Rapid adoption of cutting-edge technologies, the exponential rise in data produced by IT and network equipment, and strict laws and regulations governing network data security are a few of the elements that will promote regional market expansion. Innate technological investments should support the growth of self-healing networks in the area even further.
Region with highest CAGR:
Asia Pacific is projected to hold the highest CAGR over the forecast period. This is because nations adopt new technologies at a rapid rate, and as a result, the demand for high-speed, low-latency networks to support emerging technologies like 5G and the rise of the Internet of Things (IoT) and the adoption of cloud-based services, as well as the rise of the IoT, are driving the market in this region to expand.

Key players in the market
Some of the key players in Self-Healing Networks market include Cisco Systems, Inc., Versa Networks, Inc., Fortra LLC, Nokia, IBM Corporation, Ericsson, CommScope, VMware, Inc., Appnomic, Ivanti, SolarWinds Corporation, Elisa Polystar, Huawei, Anuta Networks and Versa Networks.
Key Developments:
In November 2022, SolarWinds Corporation, a leading provider of simple, powerful, and secure IT management software, and DRYiCE, a division of HCL Software focused on humanizing enterprise application of AI, announced its intended expansion of their partnership aimed at revolutionizing IT operations for enterprises.
In October 2022, IBM Cloud Pak for Network Automation, in collaboration with Pliant.io, helps organizations increase their efficiency, lower overall operational costs, normalize configuration and management across many vendors and ensure network stability and security.
In June 2022, Elisa Polystar acquires Cardinality Ltd, a UK-based supplier of cloud-native data management (DataOps), service assurance and customer experience analytics for communications service providers (CSPs) globally.
Components Covered:
• Services
• Solutions
• Other Components
Organization Sizes Covered:
• SMEs
• Large Enterprises
Network Types Covered:
• Virtual
• Physical
• Hybrid
Deployment Modes Covered:
• Cloud
• On-premises
Applications Covered:
• Network Traffic Management
• Security Compliance Management
• Network Bandwidth Monitoring
• Network Access Control
• Network Provisioning
• Policy Management
• Root Cause Analysis
• Other Applications
End Users Covered:
• Media and Entertainment
• Telecom
• Healthcare and Life Sciences
• Education
• Retail and Consumer Goods
• Other End Users
Regions Covered:
• North America
o US
o Canada
o Mexico
• Europe
o Germany
o UK
o Italy
o France
o Spain
o Rest of Europe
• Asia Pacific
o Japan
o China
o India
o Australia
o New Zealand
o South Korea
o Rest of Asia Pacific
• South America
o Argentina
o Brazil
o Chile
o Rest of South America
• Middle East & Africa
o Saudi Arabia
o UAE
o Qatar
o South Africa
o Rest of Middle East & Africa
What our report offers:
- Market share assessments for the regional and country-level segments
- Strategic recommendations for the new entrants
- Covers Market data for the years 2021, 2022, 2023, 2026, and 2030
- Market Trends (Drivers, Constraints, Opportunities, Threats, Challenges, Investment Opportunities, and recommendations)
- Strategic recommendations in key business segments based on the market estimations
- Competitive landscaping mapping the key common trends
- Company profiling with detailed strategies, financials, and recent developments
- Supply chain trends mapping the latest technological advancements
Free Customization Offerings:
All the customers of this report will be entitled to receive one of the following free customization options:
• Company Profiling
o Comprehensive profiling of additional market players (up to 3)
o SWOT Analysis of key players (up to 3)
• Regional Segmentation
o Market estimations, Forecasts and CAGR of any prominent country as per the client's interest (Note: Depends on feasibility check)
• Competitive Benchmarking
o Benchmarking of key players based on product portfolio, geographical presence, and strategic alliances
Table of Contents
1 Executive Summary
2 Preface
2.1 Abstract
2.2 Stake Holders
2.3 Research Scope
2.4 Research Methodology
2.4.1 Data Mining
2.4.2 Data Analysis
2.4.3 Data Validation
2.4.4 Research Approach
2.5 Research Sources
2.5.1 Primary Research Sources
2.5.2 Secondary Research Sources
2.5.3 Assumptions
3 Market Trend Analysis
3.1 Introduction
3.2 Drivers
3.3 Restraints
3.4 Opportunities
3.5 Threats
3.6 Application Analysis
3.7 End User Analysis
3.8 Emerging Markets
3.9 Impact of Covid-19
4 Porters Five Force Analysis
4.1 Bargaining power of suppliers
4.2 Bargaining power of buyers
4.3 Threat of substitutes
4.4 Threat of new entrants
4.5 Competitive rivalry
5 Global Self-Healing Networks Market, By Component
5.1 Introduction
5.2 Services
5.2.1 Professional Services
5.2.2 Managed Services
5.3 Solutions
5.3.1 Network Monitoring Tools
5.3.2 Network Automation Software
5.3.3 Intent-based Networking Tools
5.4 Other Components
6 Global Self-Healing Networks Market, By Organization Size
6.1 Introduction
6.2 SMEs
6.3 Large Enterprises
7 Global Self-Healing Networks Market, By Network Type
7.1 Introduction
7.2 Virtual
7.3 Physical
7.4 Hybrid
8 Global Self-Healing Networks Market, By Deployment Mode
8.1 Introduction
8.2 Cloud
8.3 On-premises
9 Global Self-Healing Networks Market, By Application
9.1 Introduction
9.2 Network Traffic Management
9.3 Security Compliance Management
9.4 Network Bandwidth Monitoring
9.5 Network Access Control
9.6 Network Provisioning
9.7 Policy Management
9.8 Root Cause Analysis
9.9 Other Applications
10 Global Self-Healing Networks Market, By End User
10.1 Introduction
10.2 Media and Entertainment
10.3 Telecom
10.4 Healthcare and Life Sciences
10.5 Education
10.6 Retail and Consumer Goods
10.7 Other End Users
11 Global Self-Healing Networks Market, By Geography
11.1 Introduction
11.2 North America
11.2.1 US
11.2.2 Canada
11.2.3 Mexico
11.3 Europe
11.3.1 Germany
11.3.2 UK
11.3.3 Italy
11.3.4 France
11.3.5 Spain
11.3.6 Rest of Europe
11.4 Asia Pacific
11.4.1 Japan
11.4.2 China
11.4.3 India
11.4.4 Australia
11.4.5 New Zealand
11.4.6 South Korea
11.4.7 Rest of Asia Pacific
11.5 South America
11.5.1 Argentina
11.5.2 Brazil
11.5.3 Chile
11.5.4 Rest of South America
11.6 Middle East & Africa
11.6.1 Saudi Arabia
11.6.2 UAE
11.6.3 Qatar
11.6.4 South Africa
11.6.5 Rest of Middle East & Africa
12 Key Developments
12.1 Agreements, Partnerships, Collaborations and Joint Ventures
12.2 Acquisitions & Mergers
12.3 New Product Launch
12.4 Expansions
12.5 Other Key Strategies
13 Company Profiling
13.1 Cisco Systems, Inc.
13.2 Versa Networks, Inc.
13.3 Fortra LLC
13.4 Nokia
13.5 IBM Corporation
13.6 Ericsson
13.7 CommScope
13.8 VMware, Inc.
13.9 Appnomic
13.10 Ivanti
13.11 SolarWinds Corporation
13.12 Elisa Polystar
13.13 Huawei
13.14 Anuta Networks
13.15 Versa Networks
List of Tables
1 Global Self-Healing Networks Market Outlook, By Region (2021-2030) ($MN)
2 Global Self-Healing Networks Market Outlook, By Component (2021-2030) ($MN)
3 Global Self-Healing Networks Market Outlook, By Services (2021-2030) ($MN)
4 Global Self-Healing Networks Market Outlook, By Professional Services (2021-2030) ($MN)
5 Global Self-Healing Networks Market Outlook, By Managed Services (2021-2030) ($MN)
6 Global Self-Healing Networks Market Outlook, By Solutions (2021-2030) ($MN)
7 Global Self-Healing Networks Market Outlook, By Network Monitoring Tools (2021-2030) ($MN)
8 Global Self-Healing Networks Market Outlook, By Network Automation Software (2021-2030) ($MN)
9 Global Self-Healing Networks Market Outlook, By Intent-based Networking Tools (2021-2030) ($MN)
10 Global Self-Healing Networks Market Outlook, By Other Components (2021-2030) ($MN)
11 Global Self-Healing Networks Market Outlook, By Organization Size (2021-2030) ($MN)
12 Global Self-Healing Networks Market Outlook, By SMEs (2021-2030) ($MN)
13 Global Self-Healing Networks Market Outlook, By Large Enterprises (2021-2030) ($MN)
14 Global Self-Healing Networks Market Outlook, By Network Type (2021-2030) ($MN)
15 Global Self-Healing Networks Market Outlook, By Virtual (2021-2030) ($MN)
16 Global Self-Healing Networks Market Outlook, By Physical (2021-2030) ($MN)
17 Global Self-Healing Networks Market Outlook, By Hybrid (2021-2030) ($MN)
18 Global Self-Healing Networks Market Outlook, By Deployment Mode (2021-2030) ($MN)
19 Global Self-Healing Networks Market Outlook, By Cloud (2021-2030) ($MN)
20 Global Self-Healing Networks Market Outlook, By On-premises (2021-2030) ($MN)
21 Global Self-Healing Networks Market Outlook, By Application (2021-2030) ($MN)
22 Global Self-Healing Networks Market Outlook, By Network Traffic Management (2021-2030) ($MN)
23 Global Self-Healing Networks Market Outlook, By Security Compliance Management (2021-2030) ($MN)
24 Global Self-Healing Networks Market Outlook, By Network Bandwidth Monitoring (2021-2030) ($MN)
25 Global Self-Healing Networks Market Outlook, By Network Access Control (2021-2030) ($MN)
26 Global Self-Healing Networks Market Outlook, By Network Provisioning (2021-2030) ($MN)
27 Global Self-Healing Networks Market Outlook, By Policy Management (2021-2030) ($MN)
28 Global Self-Healing Networks Market Outlook, By Root Cause Analysis (2021-2030) ($MN)
29 Global Self-Healing Networks Market Outlook, By Other Applications (2021-2030) ($MN)
30 Global Self-Healing Networks Market Outlook, By End User (2021-2030) ($MN)
31 Global Self-Healing Networks Market Outlook, By Media and Entertainment (2021-2030) ($MN)
32 Global Self-Healing Networks Market Outlook, By Telecom (2021-2030) ($MN)
33 Global Self-Healing Networks Market Outlook, By Healthcare and Life Sciences (2021-2030) ($MN)
34 Global Self-Healing Networks Market Outlook, By Education (2021-2030) ($MN)
35 Global Self-Healing Networks Market Outlook, By Retail and Consumer Goods (2021-2030) ($MN)
36 Global Self-Healing Networks Market Outlook, By Other End Users (2021-2030) ($MN)
Note: Tables for North America, Europe, APAC, South America, and Middle East & Africa Regions are also represented in the same manner as above.
List of Figures
RESEARCH METHODOLOGY

We at ‘Stratistics’ opt for an extensive research approach which involves data mining, data validation, and data analysis. The various research sources include in-house repository, secondary research, competitor’s sources, social media research, client internal data, and primary research.
Our team of analysts prefers the most reliable and authenticated data sources in order to perform the comprehensive literature search. With access to most of the authenticated data bases our team highly considers the best mix of information through various sources to obtain extensive and accurate analysis.
Each report takes an average time of a month and a team of 4 industry analysts. The time may vary depending on the scope and data availability of the desired market report. The various parameters used in the market assessment are standardized in order to enhance the data accuracy.
Data Mining
The data is collected from several authenticated, reliable, paid and unpaid sources and is filtered depending on the scope & objective of the research. Our reports repository acts as an added advantage in this procedure. Data gathering from the raw material suppliers, distributors and the manufacturers is performed on a regular basis, this helps in the comprehensive understanding of the products value chain. Apart from the above mentioned sources the data is also collected from the industry consultants to ensure the objective of the study is in the right direction.
Market trends such as technological advancements, regulatory affairs, market dynamics (Drivers, Restraints, Opportunities and Challenges) are obtained from scientific journals, market related national & international associations and organizations.
Data Analysis
From the data that is collected depending on the scope & objective of the research the data is subjected for the analysis. The critical steps that we follow for the data analysis include:
- Product Lifecycle Analysis
- Competitor analysis
- Risk analysis
- Porters Analysis
- PESTEL Analysis
- SWOT Analysis
The data engineering is performed by the core industry experts considering both the Marketing Mix Modeling and the Demand Forecasting. The marketing mix modeling makes use of multiple-regression techniques to predict the optimal mix of marketing variables. Regression factor is based on a number of variables and how they relate to an outcome such as sales or profits.
Data Validation
The data validation is performed by the exhaustive primary research from the expert interviews. This includes telephonic interviews, focus groups, face to face interviews, and questionnaires to validate our research from all aspects. The industry experts we approach come from the leading firms, involved in the supply chain ranging from the suppliers, distributors to the manufacturers and consumers so as to ensure an unbiased analysis.
We are in touch with more than 15,000 industry experts with the right mix of consultants, CEO's, presidents, vice presidents, managers, experts from both supply side and demand side, executives and so on.
The data validation involves the primary research from the industry experts belonging to:
- Leading Companies
- Suppliers & Distributors
- Manufacturers
- Consumers
- Industry/Strategic Consultants
Apart from the data validation the primary research also helps in performing the fill gap research, i.e. providing solutions for the unmet needs of the research which helps in enhancing the reports quality.
For more details about research methodology, kindly write to us at info@strategymrc.com
Frequently Asked Questions
In case of any queries regarding this report, you can contact the customer service by filing the “Inquiry Before Buy” form available on the right hand side. You may also contact us through email: info@strategymrc.com or phone: +1-301-202-5929
Yes, the samples are available for all the published reports. You can request them by filling the “Request Sample” option available in this page.
Yes, you can request a sample with your specific requirements. All the customized samples will be provided as per the requirement with the real data masked.
All our reports are available in Digital PDF format. In case if you require them in any other formats, such as PPT, Excel etc you can submit a request through “Inquiry Before Buy” form available on the right hand side. You may also contact us through email: info@strategymrc.com or phone: +1-301-202-5929
We offer a free 15% customization with every purchase. This requirement can be fulfilled for both pre and post sale. You may send your customization requirements through email at info@strategymrc.com or call us on +1-301-202-5929.
We have 3 different licensing options available in electronic format.
- Single User Licence: Allows one person, typically the buyer, to have access to the ordered product. The ordered product cannot be distributed to anyone else.
- 2-5 User Licence: Allows the ordered product to be shared among a maximum of 5 people within your organisation.
- Corporate License: Allows the product to be shared among all employees of your organisation regardless of their geographical location.
All our reports are typically be emailed to you as an attachment.
To order any available report you need to register on our website. The payment can be made either through CCAvenue or PayPal payments gateways which accept all international cards.
We extend our support to 6 months post sale. A post sale customization is also provided to cover your unmet needs in the report.
Request Customization
We provide a free 15% customization on every purchase. This requirement can be fulfilled for both pre and post sale. You may send your customization requirements through email at info@strategymrc.com or call us on +1-301-202-5929.
Note: This customization is absolutely free until it falls under the 15% bracket. If your requirement exceeds this a feasibility check will be performed. Post that, a quote will be provided along with the timelines.
WHY CHOOSE US ?

Assured Quality
Best in class reports with high standard of research integrity

24X7 Research Support
Continuous support to ensure the best customer experience.

Free Customization
Adding more values to your product of interest.

Safe & Secure Access
Providing a secured environment for all online transactions.

Trusted by 600+ Brands
Serving the most reputed brands across the world.