
Stadium Market
Stadium Market Forecasts to 2030 - Global Analysis By Type (Sports Stadiums, Indoor Arenas, Cricket Grounds, Multi-purpose Stadiums, Baseball Parks and Other Types), Size (Major Stadiums, Mid-Sized Stadiums, Small-Scale Stadiums and Mega-Stadiums), Application, End User and By Geography

|
Years Covered |
2021-2030 |
|
Estimated Year Value (2023) |
US $271.30 BN |
|
Projected Year Value (2030) |
US $528.69 BN |
|
CAGR (2023 - 2030) |
10% |
|
Regions Covered |
North America, Europe, Asia Pacific, South America, and Middle East & Africa |
|
Countries Covered |
US, Canada, Mexico, Germany, UK, Italy, France, Spain, Japan, China, India, Australia, New Zealand, South Korea, Rest of Asia Pacific, South America, Argentina, Brazil, Chile, Middle East & Africa, Saudi Arabia, UAE, Qatar, and South Africa |
|
Largest Market |
Asia Pacific |
|
Highest Growing Market |
Europe |
According to Stratistics MRC, the Global Stadium Market is accounted for $271.30 billion in 2023 and is expected to reach $528.69 billion by 2030 growing at a CAGR of 10.0% during the forecast period. The industrial and financial framework that revolves around building, operating, managing, and using sports arenas and stadiums is referred to as the stadium market. It includes a variety of participants, such as stadium developers, architects, construction firms, technology suppliers, event planners, sports teams, and spectators. It involves the organization, creation, and maintenance of stadiums, the size and capacity of which may vary depending on the sport or event for which they are intended.
Market Dynamics:
Driver:
Technological developments and generating income
The stadium market has been significantly influenced by the rapid growth of technology. High-definition television displays, smartphone apps, augmented reality (AR), virtual reality (VR), and data analytics are among the technologies stadiums are implementing to improve fan engagement, create interactive experiences, and deliver personalized content. Additionally, for sports teams, event planners, and venue operators, stadiums are an important source of income. Ticket sales, corporate sponsorships, advertising, concessions, retail sales, and hospitality services are a few instances of revenue sources. Building and renovating stadiums is driven by the possibility of bringing in tremendous amounts of money.
Restraint:
High Cost
Stadium construction, maintenance, and renovation all come with high upfront expenses. The costs associated with building and infrastructure, in particular those related to land purchase, supplies, labor, and technological integration, can be high. Furthermore, continuing operational expenses like maintenance, utilities, security, and staffing can put a strain on your finances.
Opportunity:
Initiatives for sustainability
Within the stadium industry, there is a growing emphasis on environmental responsibility and eco-friendly procedures. There are opportunities to mitigate the environmental effects and improve the stadium's reputation as an environmentally friendly venue by using sustainable design concepts, energy-efficient technologies, renewable energy sources, waste management systems, and water conservation measures.
Threat:
Financing obstacles
For stadium projects, finding funding can be difficult. Due to the long-term nature of the investments, the unpredictability of revenue streams, and potential risks related to the market demand for sporting events, private investors and lenders may be wary. In order to secure financial support, public funding for stadiums may be complicated by scrutiny and competition for scarce resources.
Covid-19 Impact:
Numerous sporting events, including important leagues, tournaments, and championships, have been discontinued or postponed as a result of the pandemic. Sports teams and stadiums have suffered significant financial losses as a result of this. Stadiums were subject to rigid capacity restrictions, social segregation measures, and health and safety regulations to avert the virus's spread. This decreased the number of spectators permitted at events, which had an effect on revenue from tickets, concessions, and products. The financial uncertainty brought on by the pandemic forced the postponement or cancellation of numerous stadium repair and construction projects.
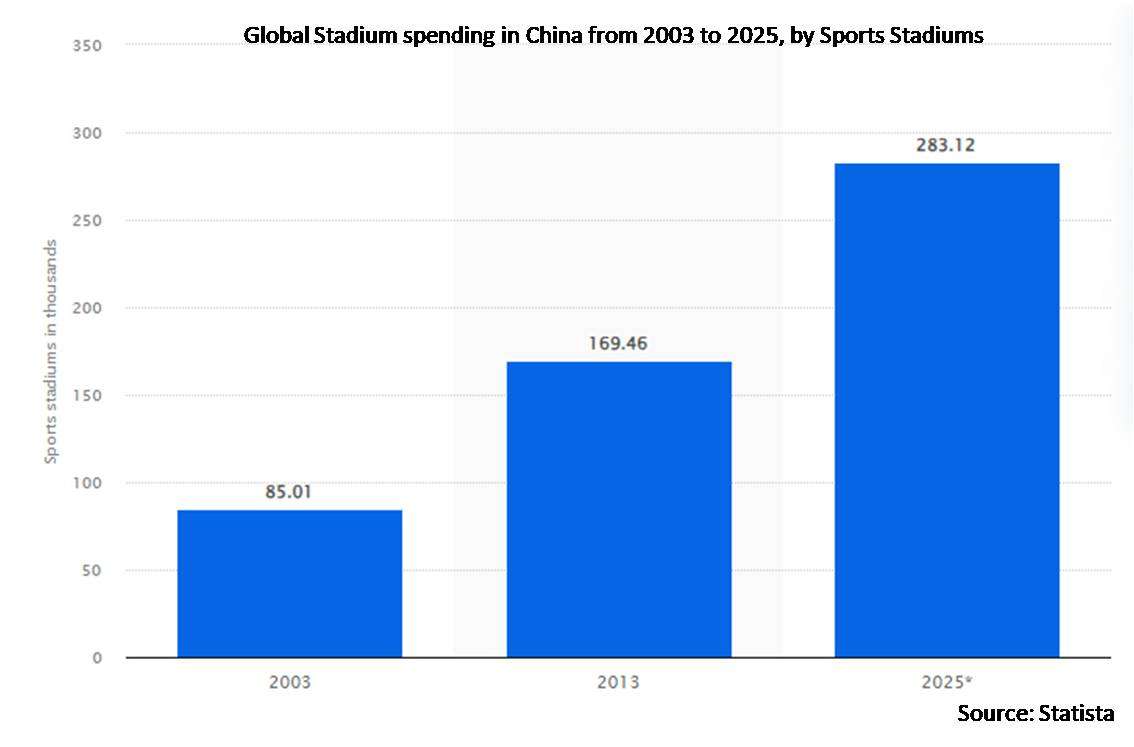
The sports stadium segment is expected to be the largest during the forecast period
Over the anticipated period, the sports stadium sector, which can vary depending on requirements including location, popularity of a particular sport, and venue size, held the largest share of the stadium market. The stadium market's sports stadium category includes all the different sports-specific locations created to hold different sporting events. These stadiums are designed to accommodate the demands and requirements of various sports, including appropriate seating, amenities, and facilities for participants and spectators.
The sports events segment is expected to have the highest CAGR during the forecast period
The hosting and management of various sporting events and contests inside stadiums and arenas is referred to as the sports events segment of the stadium market. This sector includes a broad range of sports-related tasks and offerings, such as organizing and managing sporting events, selling tickets, marketing them, providing security, running concession stands, and engaging fans. Stadium-based sporting events can range from national and international tournaments to local and regional competitions.
Region with largest share:
Over the projection period, the Asia-Pacific area held the largest share. Governments in the region have taken steps to improve sports infrastructure because they recognize how important sports are. Additionally, the rise of the middle class in many Asia-Pacific nations has increased consumer spending on sports and entertainment, which has fueled the construction of stadiums. Stadium investments for a variety of sports have expanded as a result of robust economic expansion in nations like China.
Region with highest CAGR:
Due to advancements in sports infrastructure and stadium construction, the Europe area is anticipated to have profitable growth over the extrapolated period. Through the use of technology like Wi-Fi, smartphone apps, and digital displays that can boost income, European stadiums are putting more and more emphasis on improving the fan experience. Moreover, a rising emphasis is also being placed on sustainability and the upgrading of older stadiums to satisfy eco-friendly requirements and provide better amenities. When hosting international events, certain governments in Europe provide financial incentives and help with stadium building.

Key players in the market
Some of the key players in Stadium market include VenuWorks, AECOM, Rossetti, AEG Facilities, Hunt Construction Group, Daktronics, SMG, Gilbane Building Company, Populous, Shaw Sports Turf, SIS Pitches and Spartan Surfaces.
Key Developments:
In August 2023, Turner and AECOM among group chosen to manage construction of $2.1B Tennessee Titans stadium. Global construction firms Turner Construction and AECOM Hunt Construction, who built SoFi Stadium in a joint venture, are among the chosen group that will be presented to the Nashville Sports Authority for approval
Types Covered:
• Sports Stadiums
• Indoor Arenas
• Cricket Grounds
• Multi-purpose Stadiums
• Baseball Parks
• Other Types
Sizes Covered:
• Major Stadiums
• Mid-Sized Stadiums
• Small-Scale Stadiums
• Mega-Stadiums
Applications Covered:
• Cultural and Community Events
• E-Sports Tournaments
• Sports Events
• Entertainment and Spectacle Shows
• Training and Practice Facilities
• Other Applications
End Users Covered:
• Educational Institutions
• Government Agencies
• Tourism Boards
• Recreational Centers
• Sports Clubs/Teams
• Other End Users
Regions Covered:
• North America
o US
o Canada
o Mexico
• Europe
o Germany
o UK
o Italy
o France
o Spain
o Rest of Europe
• Asia Pacific
o Japan
o China
o India
o Australia
o New Zealand
o South Korea
o Rest of Asia Pacific
• South America
o Argentina
o Brazil
o Chile
o Rest of South America
• Middle East & Africa
o Saudi Arabia
o UAE
o Qatar
o South Africa
o Rest of Middle East & Africa
What our report offers:
- Market share assessments for the regional and country-level segments
- Strategic recommendations for the new entrants
- Covers Market data for the years 2021, 2022, 2023, 2026, and 2030
- Market Trends (Drivers, Constraints, Opportunities, Threats, Challenges, Investment Opportunities, and recommendations)
- Strategic recommendations in key business segments based on the market estimations
- Competitive landscaping mapping the key common trends
- Company profiling with detailed strategies, financials, and recent developments
- Supply chain trends mapping the latest technological advancements
Free Customization Offerings:
All the customers of this report will be entitled to receive one of the following free customization options:
• Company Profiling
o Comprehensive profiling of additional market players (up to 3)
o SWOT Analysis of key players (up to 3)
• Regional Segmentation
o Market estimations, Forecasts and CAGR of any prominent country as per the client's interest (Note: Depends on feasibility check)
• Competitive Benchmarking
Benchmarking of key players based on product portfolio, geographical presence, and strategic alliances
Table of Contents
1 Executive Summary
2 Preface
2.1 Abstract
2.2 Stake Holders
2.3 Research Scope
2.4 Research Methodology
2.4.1 Data Mining
2.4.2 Data Analysis
2.4.3 Data Validation
2.4.4 Research Approach
2.5 Research Sources
2.5.1 Primary Research Sources
2.5.2 Secondary Research Sources
2.5.3 Assumptions
3 Market Trend Analysis
3.1 Introduction
3.2 Drivers
3.3 Restraints
3.4 Opportunities
3.5 Threats
3.6 Application Analysis
3.7 End User Analysis
3.8 Emerging Markets
3.9 Impact of Covid-19
4 Porters Five Force Analysis
4.1 Bargaining power of suppliers
4.2 Bargaining power of buyers
4.3 Threat of substitutes
4.4 Threat of new entrants
4.5 Competitive rivalry
5 Global Stadium Market, By Type
5.1 Introduction
5.2 Sports Stadiums
5.3 Indoor Arenas
5.4 Cricket Grounds
5.5 Multi-purpose Stadiums
5.6 Baseball Parks
5.7 Other Types
6 Global Stadium Market, By Size
6.1 Introduction
6.2 Major Stadiums
6.3 Mid-Sized Stadiums
6.4 Small-Scale Stadiums
6.5 Mega-Stadiums
7 Global Stadium Market, By Application
7.1 Introduction
7.2 Cultural and Community Events
7.3 E-Sports Tournaments
7.4 Sports Events
7.5 Entertainment and Spectacle Shows
7.6 Training and Practice Facilities
7.7 Other Applications
8 Global Stadium Market, By End User
8.1 Introduction
8.2 Educational Institutions
8.3 Government Agencies
8.4 Tourism Boards
8.5 Recreational Centers
8.6 Sports Clubs/Teams
8.7 Other End Users
9 Global Stadium Market, By Geography
9.1 Introduction
9.2 North America
9.2.1 US
9.2.2 Canada
9.2.3 Mexico
9.3 Europe
9.3.1 Germany
9.3.2 UK
9.3.3 Italy
9.3.4 France
9.3.5 Spain
9.3.6 Rest of Europe
9.4 Asia Pacific
9.4.1 Japan
9.4.2 China
9.4.3 India
9.4.4 Australia
9.4.5 New Zealand
9.4.6 South Korea
9.4.7 Rest of Asia Pacific
9.5 South America
9.5.1 Argentina
9.5.2 Brazil
9.5.3 Chile
9.5.4 Rest of South America
9.6 Middle East & Africa
9.6.1 Saudi Arabia
9.6.2 UAE
9.6.3 Qatar
9.6.4 South Africa
9.6.5 Rest of Middle East & Africa
10 Key Developments
10.1 Agreements, Partnerships, Collaborations and Joint Ventures
10.2 Acquisitions & Mergers
10.3 New Product Launch
10.4 Expansions
10.5 Other Key Strategies
11 Company Profiling
11.1 VenuWorks
11.2 AECOM
11.3 Rossetti
11.4 AEG Facilities
11.5 Hunt Construction Group
11.6 Daktronics
11.7 SMG
11.8 Gilbane Building Company
11.9 Populous
11.10 Shaw Sports Turf
11.11 SIS Pitches
11.12 Spartan Surfaces
List of Tables
1 Global Stadium Market Outlook, By Region (2021-2030) ($MN)
2 Global Stadium Market Outlook, By Type (2021-2030) ($MN)
3 Global Stadium Market Outlook, By Sports Stadiums (2021-2030) ($MN)
4 Global Stadium Market Outlook, By Indoor Arenas (2021-2030) ($MN)
5 Global Stadium Market Outlook, By Cricket Grounds (2021-2030) ($MN)
6 Global Stadium Market Outlook, By Multi-purpose Stadiums (2021-2030) ($MN)
7 Global Stadium Market Outlook, By Baseball Parks (2021-2030) ($MN)
8 Global Stadium Market Outlook, By Other Types (2021-2030) ($MN)
9 Global Stadium Market Outlook, By Size (2021-2030) ($MN)
10 Global Stadium Market Outlook, By Major Stadiums (2021-2030) ($MN)
11 Global Stadium Market Outlook, By Mid-Sized Stadiums (2021-2030) ($MN)
12 Global Stadium Market Outlook, By Small-Scale Stadiums (2021-2030) ($MN)
13 Global Stadium Market Outlook, By Mega-Stadiums (2021-2030) ($MN)
14 Global Stadium Market Outlook, By Application (2021-2030) ($MN)
15 Global Stadium Market Outlook, By Cultural and Community Events (2021-2030) ($MN)
16 Global Stadium Market Outlook, By E-Sports Tournaments (2021-2030) ($MN)
17 Global Stadium Market Outlook, By Sports Events (2021-2030) ($MN)
18 Global Stadium Market Outlook, By Entertainment and Spectacle Shows (2021-2030) ($MN)
19 Global Stadium Market Outlook, By Training and Practice Facilities (2021-2030) ($MN)
20 Global Stadium Market Outlook, By Other Applications (2021-2030) ($MN)
21 Global Stadium Market Outlook, By End User (2021-2030) ($MN)
22 Global Stadium Market Outlook, By Educational Institutions (2021-2030) ($MN)
23 Global Stadium Market Outlook, By Government Agencies (2021-2030) ($MN)
24 Global Stadium Market Outlook, By Tourism Boards (2021-2030) ($MN)
25 Global Stadium Market Outlook, By Recreational Centers (2021-2030) ($MN)
26 Global Stadium Market Outlook, By Sports Clubs/Teams (2021-2030) ($MN)
27 Global Stadium Market Outlook, By Other End Users (2021-2030) ($MN)
28 North America Stadium Market Outlook, By Country (2021-2030) ($MN)
29 North America Stadium Market Outlook, By Type (2021-2030) ($MN)
30 North America Stadium Market Outlook, By Sports Stadiums (2021-2030) ($MN)
31 North America Stadium Market Outlook, By Indoor Arenas (2021-2030) ($MN)
32 North America Stadium Market Outlook, By Cricket Grounds (2021-2030) ($MN)
33 North America Stadium Market Outlook, By Multi-purpose Stadiums (2021-2030) ($MN)
34 North America Stadium Market Outlook, By Baseball Parks (2021-2030) ($MN)
35 North America Stadium Market Outlook, By Other Types (2021-2030) ($MN)
36 North America Stadium Market Outlook, By Size (2021-2030) ($MN)
37 North America Stadium Market Outlook, By Major Stadiums (2021-2030) ($MN)
38 North America Stadium Market Outlook, By Mid-Sized Stadiums (2021-2030) ($MN)
39 North America Stadium Market Outlook, By Small-Scale Stadiums (2021-2030) ($MN)
40 North America Stadium Market Outlook, By Mega-Stadiums (2021-2030) ($MN)
41 North America Stadium Market Outlook, By Application (2021-2030) ($MN)
42 North America Stadium Market Outlook, By Cultural and Community Events (2021-2030) ($MN)
43 North America Stadium Market Outlook, By E-Sports Tournaments (2021-2030) ($MN)
44 North America Stadium Market Outlook, By Sports Events (2021-2030) ($MN)
45 North America Stadium Market Outlook, By Entertainment and Spectacle Shows (2021-2030) ($MN)
46 North America Stadium Market Outlook, By Training and Practice Facilities (2021-2030) ($MN)
47 North America Stadium Market Outlook, By Other Applications (2021-2030) ($MN)
48 North America Stadium Market Outlook, By End User (2021-2030) ($MN)
49 North America Stadium Market Outlook, By Educational Institutions (2021-2030) ($MN)
50 North America Stadium Market Outlook, By Government Agencies (2021-2030) ($MN)
51 North America Stadium Market Outlook, By Tourism Boards (2021-2030) ($MN)
52 North America Stadium Market Outlook, By Recreational Centers (2021-2030) ($MN)
53 North America Stadium Market Outlook, By Sports Clubs/Teams (2021-2030) ($MN)
54 North America Stadium Market Outlook, By Other End Users (2021-2030) ($MN)
55 Europe Stadium Market Outlook, By Country (2021-2030) ($MN)
56 Europe Stadium Market Outlook, By Type (2021-2030) ($MN)
57 Europe Stadium Market Outlook, By Sports Stadiums (2021-2030) ($MN)
58 Europe Stadium Market Outlook, By Indoor Arenas (2021-2030) ($MN)
59 Europe Stadium Market Outlook, By Cricket Grounds (2021-2030) ($MN)
60 Europe Stadium Market Outlook, By Multi-purpose Stadiums (2021-2030) ($MN)
61 Europe Stadium Market Outlook, By Baseball Parks (2021-2030) ($MN)
62 Europe Stadium Market Outlook, By Other Types (2021-2030) ($MN)
63 Europe Stadium Market Outlook, By Size (2021-2030) ($MN)
64 Europe Stadium Market Outlook, By Major Stadiums (2021-2030) ($MN)
65 Europe Stadium Market Outlook, By Mid-Sized Stadiums (2021-2030) ($MN)
66 Europe Stadium Market Outlook, By Small-Scale Stadiums (2021-2030) ($MN)
67 Europe Stadium Market Outlook, By Mega-Stadiums (2021-2030) ($MN)
68 Europe Stadium Market Outlook, By Application (2021-2030) ($MN)
69 Europe Stadium Market Outlook, By Cultural and Community Events (2021-2030) ($MN)
70 Europe Stadium Market Outlook, By E-Sports Tournaments (2021-2030) ($MN)
71 Europe Stadium Market Outlook, By Sports Events (2021-2030) ($MN)
72 Europe Stadium Market Outlook, By Entertainment and Spectacle Shows (2021-2030) ($MN)
73 Europe Stadium Market Outlook, By Training and Practice Facilities (2021-2030) ($MN)
74 Europe Stadium Market Outlook, By Other Applications (2021-2030) ($MN)
75 Europe Stadium Market Outlook, By End User (2021-2030) ($MN)
76 Europe Stadium Market Outlook, By Educational Institutions (2021-2030) ($MN)
77 Europe Stadium Market Outlook, By Government Agencies (2021-2030) ($MN)
78 Europe Stadium Market Outlook, By Tourism Boards (2021-2030) ($MN)
79 Europe Stadium Market Outlook, By Recreational Centers (2021-2030) ($MN)
80 Europe Stadium Market Outlook, By Sports Clubs/Teams (2021-2030) ($MN)
81 Europe Stadium Market Outlook, By Other End Users (2021-2030) ($MN)
82 Asia Pacific Stadium Market Outlook, By Country (2021-2030) ($MN)
83 Asia Pacific Stadium Market Outlook, By Type (2021-2030) ($MN)
84 Asia Pacific Stadium Market Outlook, By Sports Stadiums (2021-2030) ($MN)
85 Asia Pacific Stadium Market Outlook, By Indoor Arenas (2021-2030) ($MN)
86 Asia Pacific Stadium Market Outlook, By Cricket Grounds (2021-2030) ($MN)
87 Asia Pacific Stadium Market Outlook, By Multi-purpose Stadiums (2021-2030) ($MN)
88 Asia Pacific Stadium Market Outlook, By Baseball Parks (2021-2030) ($MN)
89 Asia Pacific Stadium Market Outlook, By Other Types (2021-2030) ($MN)
90 Asia Pacific Stadium Market Outlook, By Size (2021-2030) ($MN)
91 Asia Pacific Stadium Market Outlook, By Major Stadiums (2021-2030) ($MN)
92 Asia Pacific Stadium Market Outlook, By Mid-Sized Stadiums (2021-2030) ($MN)
93 Asia Pacific Stadium Market Outlook, By Small-Scale Stadiums (2021-2030) ($MN)
94 Asia Pacific Stadium Market Outlook, By Mega-Stadiums (2021-2030) ($MN)
95 Asia Pacific Stadium Market Outlook, By Application (2021-2030) ($MN)
96 Asia Pacific Stadium Market Outlook, By Cultural and Community Events (2021-2030) ($MN)
97 Asia Pacific Stadium Market Outlook, By E-Sports Tournaments (2021-2030) ($MN)
98 Asia Pacific Stadium Market Outlook, By Sports Events (2021-2030) ($MN)
99 Asia Pacific Stadium Market Outlook, By Entertainment and Spectacle Shows (2021-2030) ($MN)
100 Asia Pacific Stadium Market Outlook, By Training and Practice Facilities (2021-2030) ($MN)
101 Asia Pacific Stadium Market Outlook, By Other Applications (2021-2030) ($MN)
102 Asia Pacific Stadium Market Outlook, By End User (2021-2030) ($MN)
103 Asia Pacific Stadium Market Outlook, By Educational Institutions (2021-2030) ($MN)
104 Asia Pacific Stadium Market Outlook, By Government Agencies (2021-2030) ($MN)
105 Asia Pacific Stadium Market Outlook, By Tourism Boards (2021-2030) ($MN)
106 Asia Pacific Stadium Market Outlook, By Recreational Centers (2021-2030) ($MN)
107 Asia Pacific Stadium Market Outlook, By Sports Clubs/Teams (2021-2030) ($MN)
108 Asia Pacific Stadium Market Outlook, By Other End Users (2021-2030) ($MN)
109 South America Stadium Market Outlook, By Country (2021-2030) ($MN)
110 South America Stadium Market Outlook, By Type (2021-2030) ($MN)
111 South America Stadium Market Outlook, By Sports Stadiums (2021-2030) ($MN)
112 South America Stadium Market Outlook, By Indoor Arenas (2021-2030) ($MN)
113 South America Stadium Market Outlook, By Cricket Grounds (2021-2030) ($MN)
114 South America Stadium Market Outlook, By Multi-purpose Stadiums (2021-2030) ($MN)
115 South America Stadium Market Outlook, By Baseball Parks (2021-2030) ($MN)
116 South America Stadium Market Outlook, By Other Types (2021-2030) ($MN)
117 South America Stadium Market Outlook, By Size (2021-2030) ($MN)
118 South America Stadium Market Outlook, By Major Stadiums (2021-2030) ($MN)
119 South America Stadium Market Outlook, By Mid-Sized Stadiums (2021-2030) ($MN)
120 South America Stadium Market Outlook, By Small-Scale Stadiums (2021-2030) ($MN)
121 South America Stadium Market Outlook, By Mega-Stadiums (2021-2030) ($MN)
122 South America Stadium Market Outlook, By Application (2021-2030) ($MN)
123 South America Stadium Market Outlook, By Cultural and Community Events (2021-2030) ($MN)
124 South America Stadium Market Outlook, By E-Sports Tournaments (2021-2030) ($MN)
125 South America Stadium Market Outlook, By Sports Events (2021-2030) ($MN)
126 South America Stadium Market Outlook, By Entertainment and Spectacle Shows (2021-2030) ($MN)
127 South America Stadium Market Outlook, By Training and Practice Facilities (2021-2030) ($MN)
128 South America Stadium Market Outlook, By Other Applications (2021-2030) ($MN)
129 South America Stadium Market Outlook, By End User (2021-2030) ($MN)
130 South America Stadium Market Outlook, By Educational Institutions (2021-2030) ($MN)
131 South America Stadium Market Outlook, By Government Agencies (2021-2030) ($MN)
132 South America Stadium Market Outlook, By Tourism Boards (2021-2030) ($MN)
133 South America Stadium Market Outlook, By Recreational Centers (2021-2030) ($MN)
134 South America Stadium Market Outlook, By Sports Clubs/Teams (2021-2030) ($MN)
135 South America Stadium Market Outlook, By Other End Users (2021-2030) ($MN)
136 Middle East & Africa Stadium Market Outlook, By Country (2021-2030) ($MN)
137 Middle East & Africa Stadium Market Outlook, By Type (2021-2030) ($MN)
138 Middle East & Africa Stadium Market Outlook, By Sports Stadiums (2021-2030) ($MN)
139 Middle East & Africa Stadium Market Outlook, By Indoor Arenas (2021-2030) ($MN)
140 Middle East & Africa Stadium Market Outlook, By Cricket Grounds (2021-2030) ($MN)
141 Middle East & Africa Stadium Market Outlook, By Multi-purpose Stadiums (2021-2030) ($MN)
142 Middle East & Africa Stadium Market Outlook, By Baseball Parks (2021-2030) ($MN)
143 Middle East & Africa Stadium Market Outlook, By Other Types (2021-2030) ($MN)
144 Middle East & Africa Stadium Market Outlook, By Size (2021-2030) ($MN)
145 Middle East & Africa Stadium Market Outlook, By Major Stadiums (2021-2030) ($MN)
146 Middle East & Africa Stadium Market Outlook, By Mid-Sized Stadiums (2021-2030) ($MN)
147 Middle East & Africa Stadium Market Outlook, By Small-Scale Stadiums (2021-2030) ($MN)
148 Middle East & Africa Stadium Market Outlook, By Mega-Stadiums (2021-2030) ($MN)
149 Middle East & Africa Stadium Market Outlook, By Application (2021-2030) ($MN)
150 Middle East & Africa Stadium Market Outlook, By Cultural and Community Events (2021-2030) ($MN)
151 Middle East & Africa Stadium Market Outlook, By E-Sports Tournaments (2021-2030) ($MN)
152 Middle East & Africa Stadium Market Outlook, By Sports Events (2021-2030) ($MN)
153 Middle East & Africa Stadium Market Outlook, By Entertainment and Spectacle Shows (2021-2030) ($MN)
154 Middle East & Africa Stadium Market Outlook, By Training and Practice Facilities (2021-2030) ($MN)
155 Middle East & Africa Stadium Market Outlook, By Other Applications (2021-2030) ($MN)
156 Middle East & Africa Stadium Market Outlook, By End User (2021-2030) ($MN)
157 Middle East & Africa Stadium Market Outlook, By Educational Institutions (2021-2030) ($MN)
158 Middle East & Africa Stadium Market Outlook, By Government Agencies (2021-2030) ($MN)
159 Middle East & Africa Stadium Market Outlook, By Tourism Boards (2021-2030) ($MN)
160 Middle East & Africa Stadium Market Outlook, By Recreational Centers (2021-2030) ($MN)
161 Middle East & Africa Stadium Market Outlook, By Sports Clubs/Teams (2021-2030) ($MN)
162 Middle East & Africa Stadium Market Outlook, By Other End Users (2021-2030) ($MN)
List of Figures
RESEARCH METHODOLOGY

We at ‘Stratistics’ opt for an extensive research approach which involves data mining, data validation, and data analysis. The various research sources include in-house repository, secondary research, competitor’s sources, social media research, client internal data, and primary research.
Our team of analysts prefers the most reliable and authenticated data sources in order to perform the comprehensive literature search. With access to most of the authenticated data bases our team highly considers the best mix of information through various sources to obtain extensive and accurate analysis.
Each report takes an average time of a month and a team of 4 industry analysts. The time may vary depending on the scope and data availability of the desired market report. The various parameters used in the market assessment are standardized in order to enhance the data accuracy.
Data Mining
The data is collected from several authenticated, reliable, paid and unpaid sources and is filtered depending on the scope & objective of the research. Our reports repository acts as an added advantage in this procedure. Data gathering from the raw material suppliers, distributors and the manufacturers is performed on a regular basis, this helps in the comprehensive understanding of the products value chain. Apart from the above mentioned sources the data is also collected from the industry consultants to ensure the objective of the study is in the right direction.
Market trends such as technological advancements, regulatory affairs, market dynamics (Drivers, Restraints, Opportunities and Challenges) are obtained from scientific journals, market related national & international associations and organizations.
Data Analysis
From the data that is collected depending on the scope & objective of the research the data is subjected for the analysis. The critical steps that we follow for the data analysis include:
- Product Lifecycle Analysis
- Competitor analysis
- Risk analysis
- Porters Analysis
- PESTEL Analysis
- SWOT Analysis
The data engineering is performed by the core industry experts considering both the Marketing Mix Modeling and the Demand Forecasting. The marketing mix modeling makes use of multiple-regression techniques to predict the optimal mix of marketing variables. Regression factor is based on a number of variables and how they relate to an outcome such as sales or profits.
Data Validation
The data validation is performed by the exhaustive primary research from the expert interviews. This includes telephonic interviews, focus groups, face to face interviews, and questionnaires to validate our research from all aspects. The industry experts we approach come from the leading firms, involved in the supply chain ranging from the suppliers, distributors to the manufacturers and consumers so as to ensure an unbiased analysis.
We are in touch with more than 15,000 industry experts with the right mix of consultants, CEO's, presidents, vice presidents, managers, experts from both supply side and demand side, executives and so on.
The data validation involves the primary research from the industry experts belonging to:
- Leading Companies
- Suppliers & Distributors
- Manufacturers
- Consumers
- Industry/Strategic Consultants
Apart from the data validation the primary research also helps in performing the fill gap research, i.e. providing solutions for the unmet needs of the research which helps in enhancing the reports quality.
For more details about research methodology, kindly write to us at info@strategymrc.com
Frequently Asked Questions
In case of any queries regarding this report, you can contact the customer service by filing the “Inquiry Before Buy” form available on the right hand side. You may also contact us through email: info@strategymrc.com or phone: +1-301-202-5929
Yes, the samples are available for all the published reports. You can request them by filling the “Request Sample” option available in this page.
Yes, you can request a sample with your specific requirements. All the customized samples will be provided as per the requirement with the real data masked.
All our reports are available in Digital PDF format. In case if you require them in any other formats, such as PPT, Excel etc you can submit a request through “Inquiry Before Buy” form available on the right hand side. You may also contact us through email: info@strategymrc.com or phone: +1-301-202-5929
We offer a free 15% customization with every purchase. This requirement can be fulfilled for both pre and post sale. You may send your customization requirements through email at info@strategymrc.com or call us on +1-301-202-5929.
We have 3 different licensing options available in electronic format.
- Single User Licence: Allows one person, typically the buyer, to have access to the ordered product. The ordered product cannot be distributed to anyone else.
- 2-5 User Licence: Allows the ordered product to be shared among a maximum of 5 people within your organisation.
- Corporate License: Allows the product to be shared among all employees of your organisation regardless of their geographical location.
All our reports are typically be emailed to you as an attachment.
To order any available report you need to register on our website. The payment can be made either through CCAvenue or PayPal payments gateways which accept all international cards.
We extend our support to 6 months post sale. A post sale customization is also provided to cover your unmet needs in the report.
Request Customization
We offer complimentary customization of up to 15% with every purchase. To share your customization requirements, feel free to email us at info@strategymrc.com or call us on +1-301-202-5929. .
Please Note: Customization within the 15% threshold is entirely free of charge. If your request exceeds this limit, we will conduct a feasibility assessment. Following that, a detailed quote and timeline will be provided.
WHY CHOOSE US ?

Assured Quality
Best in class reports with high standard of research integrity

24X7 Research Support
Continuous support to ensure the best customer experience.

Free Customization
Adding more values to your product of interest.

Safe & Secure Access
Providing a secured environment for all online transactions.

Trusted by 600+ Brands
Serving the most reputed brands across the world.