
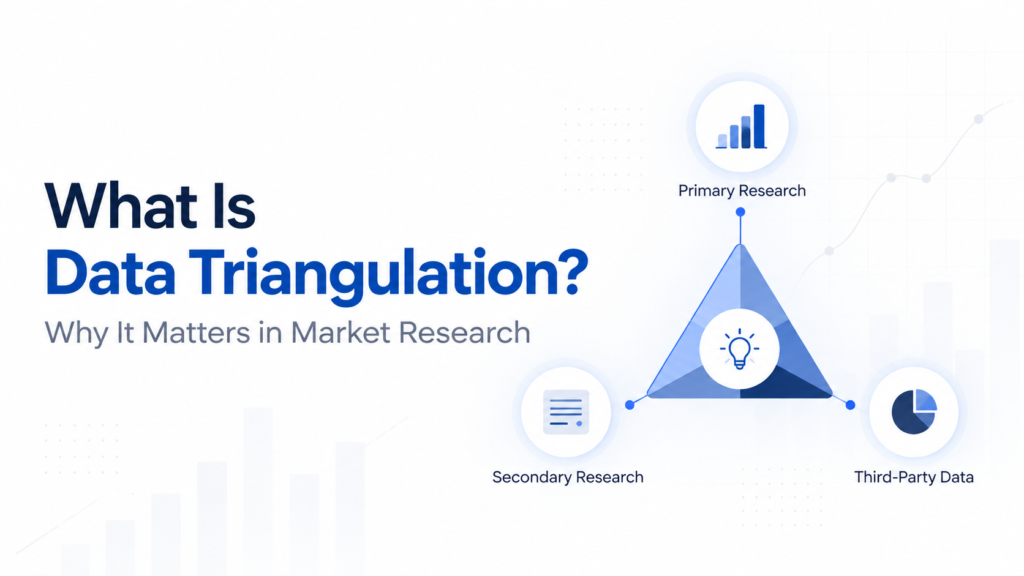
Market research rarely depends on a single number or one source of information.
A company may publish its revenue, an industry association may report shipment volumes, government databases may provide trade statistics, and industry experts may have completely different insights about what is actually happening in the market.
So how do researchers decide which information to trust?
One of the most important methods is data triangulation.
Data triangulation helps researchers compare multiple sources, validate assumptions, identify inconsistencies, and arrive at a more reliable estimate of market size, growth, or future demand.
What Is Data Triangulation in Market Research?
Data triangulation is the process of using multiple independent sources or research methods to examine the same market question.
Instead of relying on one dataset, researchers compare information from several sources.
For example, when estimating the size of an industrial equipment market, researchers may examine:
- Manufacturer revenues
- Production volumes
- Import and export statistics
- Distributor sales
- Industry association data
- Government databases
- Company annual reports
- Expert interviews
- Customer demand
When several independent sources point toward a similar result, confidence in the estimate increases.
If the numbers differ significantly, researchers investigate why before finalizing the market estimate.
A Simple Example of Data Triangulation
Imagine researchers are estimating the market for a specialized semiconductor manufacturing system.
One source suggests annual industry sales of $5 billion.
However, researchers would not immediately use that figure.
They might also calculate the market using:
Company revenues:
Combine estimated sales from major manufacturers.
Shipment data:
Estimate the number of systems sold and multiply it by average selling prices.
Customer investment:
Analyze capital expenditure from semiconductor manufacturers purchasing the equipment.
If these methods produce estimates of $4.8 billion, $5.1 billion, and $5 billion, researchers can have greater confidence that the market is close to that range.
This is the basic principle behind triangulation.
Why Is Data Triangulation Important?
Market data is rarely perfect.
Many markets have incomplete reporting, private companies, inconsistent definitions, limited regional data, or rapidly changing technologies.
Triangulation reduces the risk of depending too heavily on one potentially inaccurate source.
It Improves Market Size Accuracy
A market-size estimate becomes more reliable when researchers validate it from multiple directions.
For example, a bottom-up calculation based on company revenues can be compared with a top-down estimate based on industry production.
Large differences between the two may indicate that something has been missed.
It Identifies Data Inconsistencies
Different sources often provide different numbers.
This does not always mean one source is wrong.
Differences may result from:
- Different market definitions
- Different geographic coverage
- Different base years
- Revenue versus shipment measurements
- Currency conversions
- Different product categories
Triangulation helps researchers identify and understand these differences.
Primary and Secondary Research Work Together
A strong triangulation process typically combines secondary research and primary research.
Secondary research may include:
- Annual reports
- Government publications
- Industry databases
- Trade statistics
- Investor presentations
- Academic studies
- Industry associations
- Company websites
Primary research can include interviews with:
- Manufacturers
- Distributors
- Suppliers
- Industry experts
- Consultants
- Customers
- Technology specialists
Secondary research provides the initial evidence.
Primary research helps researchers verify assumptions and understand information that may not be publicly available.
Triangulation in Top-Down and Bottom-Up Market Sizing
Data triangulation is particularly important when estimating market size.
Top-Down Approach
The top-down method begins with a broader market and narrows it using factors such as:
- Product category
- Geography
- Application
- Customer industry
- Technology penetration
Bottom-Up Approach
The bottom-up method builds the market from individual components.
Researchers may estimate:
- Company sales
- Product shipments
- Average selling prices
- Production capacity
- Customer numbers
Researchers can then compare the results of both approaches.
If both methods produce similar estimates, confidence increases.
If they produce very different results, the assumptions must be reviewed.
How Triangulation Helps When Public Data Is Limited
Some markets are relatively easy to analyze because major companies publish detailed information.
Others are much harder.
This is common in:
- Emerging technologies
- Specialized industrial markets
- Private-company dominated industries
- New geographic markets
- Highly fragmented industries
In these cases, researchers may need to combine indirect indicators.
For example, the size of an emerging technology market might be estimated using:
- Funding activity
- Production capacity
- Patent activity
- Customer adoption
- Equipment purchases
- Supplier revenues
- Expert interviews
No single source provides the complete answer.
The value comes from combining the evidence.
Data Triangulation in Market Forecasting
Triangulation is also useful when forecasting future growth.
Researchers may examine several indicators before estimating a future CAGR.
These can include:
- Historical market growth
- Production capacity expansion
- Technology adoption
- Government policies
- Investment trends
- Customer demand
- Pricing changes
- New product launches
For example, strong investment alone may not guarantee market growth.
Researchers may compare investment activity with actual production, customer adoption, and industry capacity before adjusting a forecast.
This helps prevent forecasts from being based on a single trend.
Why Two Research Reports Can Still Have Different Numbers
Even when both reports use data triangulation, their final estimates may differ.
Researchers may use different:
- Market definitions
- Segmentation structures
- Data sources
- Forecast assumptions
- Geographic boundaries
- Currency calculations
This is why buyers should not evaluate a market research report based only on the final market-size number.
Understanding how the number was calculated is equally important.
What Buyers Should Look for in a Research Methodology
Before relying on a market estimate, buyers should understand whether the research process includes:
- Multiple independent data sources
- Primary and secondary research
- Top-down and bottom-up validation
- Clearly defined market boundaries
- Transparent assumptions
- Historical data validation
- Expert verification
A transparent methodology makes it easier to understand where an estimate comes from and how much confidence should be placed in it.
Data triangulation is one of the most important techniques used to improve the reliability of market research.
Instead of trusting one source, researchers compare multiple datasets, methodologies, and expert perspectives to determine whether the available evidence supports the same conclusion.
This is particularly important when estimating market size, forecasting future growth, or analyzing emerging industries where reliable public data may be limited.
Market research will always involve assumptions.
The objective of triangulation is not to remove every uncertainty. It is to test those assumptions from multiple directions and build an estimate that is supported by the strongest available evidence.