
Agricultural Tractor Market
Agricultural Tractor Market Forecasts to 2030 - Global Analysis By Type (Orchard Tractors, Row-crop Tractors and Other Types), Driveline Type (2 Wheel Drive and 4 Wheel Drive), Engine Power (Less than 40 HP, 40HP to 80 HP and Other Engine Power), Propulsion, Operation, Application and By Geography

|
Years Covered |
2021-2030 |
|
Estimated Year Value (2023) |
US $68.4 BN |
|
Projected Year Value (2030) |
US $114.2 BN |
|
CAGR (2023 - 2030) |
7.6% |
|
Regions Covered |
North America, Europe, Asia Pacific, South America, and Middle East & Africa |
|
Countries Covered |
US, Canada, Mexico, Germany, UK, Italy, France, Spain, Japan, China, India, Australia, New Zealand, South Korea, Rest of Asia Pacific, South America, Argentina, Brazil, Chile, Middle East & Africa, Saudi Arabia, UAE, Qatar, and South Africa |
|
Largest Market |
North America |
|
Highest Growing Market |
Asia Pacific |
According to Stratistics MRC, the Global Agricultural Tractor Market is accounted for $68.4 billion in 2023 and is expected to reach $114.2 billion by 2030 growing at a CAGR of 7.6% during the forecast period. A tractor is a vehicle with one or two tiny front wheels and two huge back wheels. In agricultural, construction, and logistical applications, it is utilized to move associated tools such as rotators, ploughing, tilling, sowing, cultivating, and harvesting. There are two sizes of tractors: two wheels and four wheels. Additionally, it comes in a variety of power levels, from 20 HP to more than 20 HP.
According to the Indian Brand Equity Foundation, 58% of the total population in India are farmers.
Market Dynamics:
Driver:
Shorter replacement cycles
Farmers are increasingly apt to replace their tractors more regularly as they try to increase output and remain competitive. Newer models with greater features, better fuel efficiency, and increased performance have been released as a result of technological breakthroughs and design innovation in tractors. In order to maximize their agricultural operations, farmers realize the advantage of upgrading to these cutting-edge models. Farmers are replacing aging equipment with newer, greener options as a result of changing agricultural techniques and growing environmental restrictions, which also drives the need for more environmentally friendly and sustainable tractors.
Restraint:
Fragmentation of land holdings
In many regions, especially in developing countries, land ownership is fragmented into small and scattered plots, making it challenging for farmers to justify the investment in large and high-powered tractors. Smaller land holdings require smaller, more affordable tractors, which may lead to reduced sales for manufacturers of larger, more powerful machines. Moreover, servicing and maintaining a dispersed fleet of tractors can be logistically complex and costly for both farmers and equipment suppliers. As a result, the fragmentation of land holdings restricts the widespread adoption of agricultural tractors and influences the market dynamics in regions with such land distribution patterns.
Opportunity:
Growing rate of farm mechanization in emerging nations
Modernizing agriculture to increase productivity and fulfill expanding food demands is becoming more important as these nations undergo economic expansion and increased urbanization. Improvements in yields, labor dependency reduction, and efficiency are just a few advantages of farm mechanization. Agricultural tractors are in high demand as a result of farmers in these countries realizing the benefits of implementing automated operations. Government programs and subsidies that support agricultural development further increase the market's potential for growth in these developing nations, making it a desirable possibility for tractor suppliers and manufacturers.
Threat:
High dependence on commodity costs
As the profitability of farmers heavily relies on commodity prices, fluctuations in the prices of crops and agricultural products directly impact their purchasing power for tractors and farm equipment. During periods of low commodity prices, farmers may be hesitant to invest in expensive machinery like tractors, leading to a decline in tractor sales. Additionally, uncertainty in the agricultural sector due to unpredictable market conditions can cause farmers to postpone or forego tractor purchases altogether, affecting overall market demand. Manufacturers and suppliers in the agricultural tractor market must navigate these price volatility challenges and develop strategies to mitigate the impact of fluctuating commodity costs on their sales and business growth.
Covid-19 Impact:
The COVID-19 pandemic had a mixed impact on the agricultural tractor market. In the initial phases, the market experienced disruptions in production, supply chain, and logistics due to lockdowns and restrictions, causing delays and shortages. However, as the pandemic progressed, agriculture was deemed essential, leading to increased demand for tractors as farmers sought to maintain productivity. The shift towards mechanization and modern farming practices also boosted tractor sales. The government's stimulus packages and financial support for the agricultural sector further supported the market. Despite challenges, the pandemic accelerated the adoption of technology-driven tractors and highlighted the importance of resilient agricultural machinery supply chains.
The 4 wheel drive segment is expected to be the largest during the forecast period
The 4 wheel drive segment is expected to have lucrative growth owing to the increasing demand for high power agricultural tractors to perform various agricultural tasks efficiently. For instance, powerful agricultural tasks such as tilling and sowing can be easily performed with 4WD tractors. In a four-wheel-drive tractor, all four wheels receive power from the engine. 4WD tractors provide enhanced performance, high speed, and reduced slippage. All these factors are anticipated to drive the 4WD segment's growth over the forecast period.
The less than 40 HP segment is expected to have the highest CAGR during the forecast period
The less than 40 HP segment is anticipated to witness the fastest CAGR growth during the forecast period. The low price, small size, and better convenience provided by tractors with less than 40 HP to carry out all essential farming tasks may be credited for the significant growth. Most farmers in the region favour these machines, which are mostly used in the Asia Pacific region, where 85% of farmlands are less than 10 hectares.
Region with largest share:
During the forecast period, it is expected that the North American Agricultural Tractor market will continue to hold a majority of the market share. Factors driving this growth include increasing farm sizes, a need for higher productivity, and technological advancements in tractor design. Key players in the market continually strive to introduce innovative features, such as GPS guidance systems and precision farming capabilities, to cater to the evolving needs of farmers. Additionally, government subsidies and favorable policies further boost the adoption of agricultural tractors, making North America a dynamic and competitive market for this essential agricultural machinery.
Region with highest CAGR:
Asia Pacific is projected to have the highest CAGR over the forecast period, as agriculture remains a primary economic activity in many countries within the region, the demand for agricultural tractors continues to grow steadily. Factors driving this demand include the need to improve farm efficiency, address labor shortages, and adopt modern agricultural practices, the rising population, increasing food demand. Additionally, local and international manufacturers compete to offer a diverse range of tractors, including small utility tractors and high-powered models, tailored to meet the varying needs of farmers across Asia Pacific's diverse agricultural landscape.

Key players in the market
Some of the key players in Agricultural Tractor market include AGCO Corp., CLAAS KGaAmbH, CNH Industrial N.V., Deere & Company, Escorts Ltd., International Tractors Ltd., KubotaCorp., Mahindra & Mahindra Ltd., Tractors and Farm Equipment Ltd., YanmarCo., Ltd., Massey Feguson Limited, Iseki & Co. Ltd, Enerpac Tool Group, Bucher Industries, Alamo Group, Inc., J C Bamford Excavators Ltd, Mitsubishi Heavy Industries Ltd. and Zetor Tractors AS.
Key Developments:
In January 2023, Zetor Tractors and VST Tillers Tractors Ltd launched two best-in-class tractors at the CII Agro Tech India 2022 presentation. These 45 HP and 50 HP segment tractors are jointly generated by VST & ZETOR at their India & Czech Republic plants.
In November 2022, VST Tillers Tractors Ltd and ZETOR TRACTORS unveiled two best-in-class tractors at the CII Agro Tech India 2022 exhibition. These 45 HP and 50 HP category tractors are jointly developed by VST & ZETOR at their India & Czech Republic plants.
In June 2022, Solis Yanmar company launched three new tractor models in the below 30 HP category for Turkish farms that are to be exported from India.
Types Covered:
• Orchard Tractors
• Row-crop Tractors
• Other Types
Driveline Types Covered:
• 2 Wheel Drive
• 4 Wheel Drive
Engine Powers Covered:
• Less than 40 HP
• 40HP to 80 HP
• 81HP to 120 HP
• 121 HP to 180 HP
• 181 HP to 250 HP
• More than 250 HP
Propulsions Covered:
• Internal Combustion Engine (ICE)
• Electric and Hybrid
Operations Covered:
• Autonomous Tractor Vehicle
• Manual Tractor Vehicle
Applications Covered:
• Harvesting
• Seed Sowing
• Irrigation
• Ploughing
• Other Applications
Regions Covered:
• North America
o US
o Canada
o Mexico
• Europe
o Germany
o UK
o Italy
o France
o Spain
o Rest of Europe
• Asia Pacific
o Japan
o China
o India
o Australia
o New Zealand
o South Korea
o Rest of Asia Pacific
• South America
o Argentina
o Brazil
o Chile
o Rest of South America
• Middle East & Africa
o Saudi Arabia
o UAE
o Qatar
o South Africa
o Rest of Middle East & Africa
What our report offers:
- Market share assessments for the regional and country-level segments
- Strategic recommendations for the new entrants
- Covers Market data for the years 2021, 2022, 2023, 2026, and 2030
- Market Trends (Drivers, Constraints, Opportunities, Threats, Challenges, Investment Opportunities, and recommendations)
- Strategic recommendations in key business segments based on the market estimations
- Competitive landscaping mapping the key common trends
- Company profiling with detailed strategies, financials, and recent developments
- Supply chain trends mapping the latest technological advancements
Free Customization Offerings:
All the customers of this report will be entitled to receive one of the following free customization options:
• Company Profiling
o Comprehensive profiling of additional market players (up to 3)
o SWOT Analysis of key players (up to 3)
• Regional Segmentation
o Market estimations, Forecasts and CAGR of any prominent country as per the client's interest (Note: Depends on feasibility check)
• Competitive Benchmarking
Benchmarking of key players based on product portfolio, geographical presence, and strategic alliances
Table of Contents
1 Executive Summary
2 Preface
2.1 Abstract
2.2 Stake Holders
2.3 Research Scope
2.4 Research Methodology
2.4.1 Data Mining
2.4.2 Data Analysis
2.4.3 Data Validation
2.4.4 Research Approach
2.5 Research Sources
2.5.1 Primary Research Sources
2.5.2 Secondary Research Sources
2.5.3 Assumptions
3 Market Trend Analysis
3.1 Introduction
3.2 Drivers
3.3 Restraints
3.4 Opportunities
3.5 Threats
3.6 Application Analysis
3.7 Emerging Markets
3.8 Impact of Covid-19
4 Porters Five Force Analysis
4.1 Bargaining power of suppliers
4.2 Bargaining power of buyers
4.3 Threat of substitutes
4.4 Threat of new entrants
4.5 Competitive rivalry
5 Global Agriculture Tractor Market, By Type
5.1 Introduction
5.2 Orchard Tractors
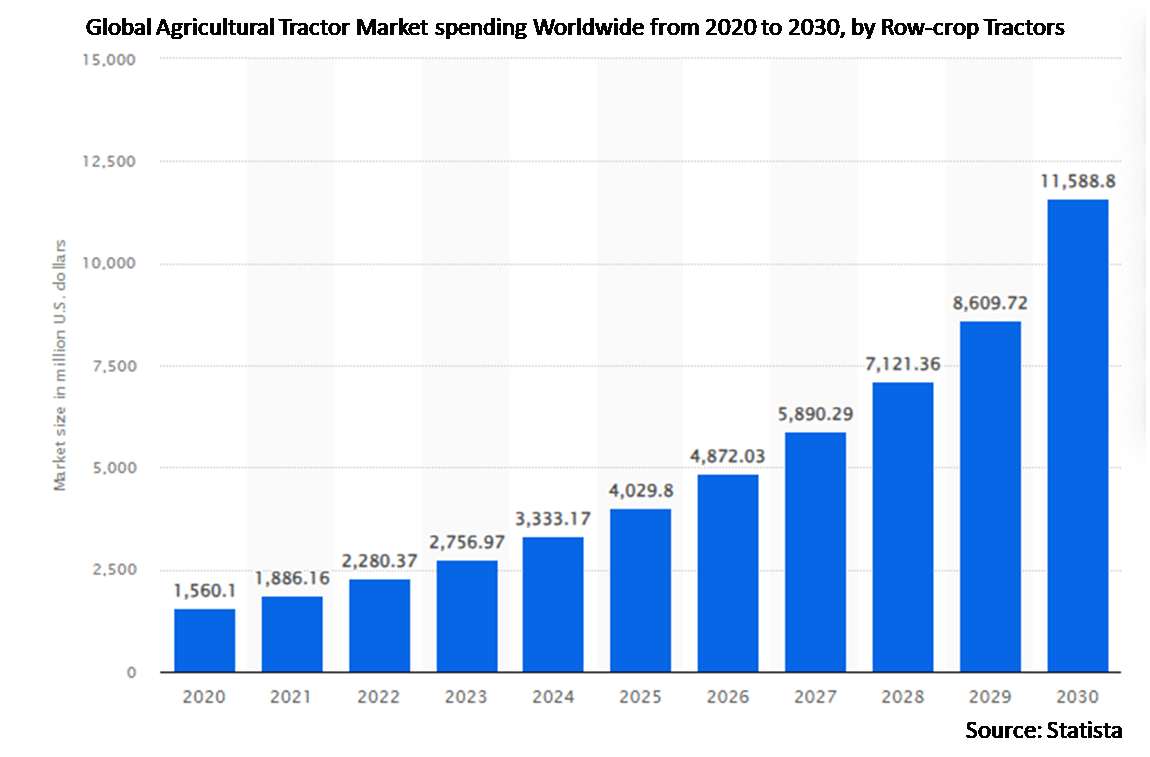
5.3 Row-crop Tractors
5.4 Other Types
6 Global Agriculture Tractor Market, By Driveline Type
6.1 Introduction
6.2 2 Wheel Drive
6.3 4 Wheel Drive
7 Global Agriculture Tractor Market, By Engine Power
7.1 Introduction
7.2 Less than 40 HP
7.3 40HP to 80 HP
7.4 81HP to 120 HP
7.5 121 HP to 180 HP
7.6 181 HP to 250 HP
7.7 More than 250 HP
8 Global Agriculture Tractor Market, By Propulsion
8.1 Introduction
8.2 Internal Combustion Engine (ICE)
8.3 Electric and Hybrid
8.4 Other Propulsions
9 Global Agriculture Tractor Market, By Operation
9.1 Introduction
9.2 Autonomous Tractor Vehicle
9.3 Manual Tractor Vehicle
9.4 Other Operations
10 Global Agriculture Tractor Market, By Application
10.1 Introduction
10.2 Harvesting
10.3 Seed Sowing
10.4 Irrigation
10.5 Ploughing
10.6 Other Applications
11 Global Agriculture Tractor Market, By Geography
11.1 Introduction
11.2 North America
11.2.1 US
11.2.2 Canada
11.2.3 Mexico
11.3 Europe
11.3.1 Germany
11.3.2 UK
11.3.3 Italy
11.3.4 France
11.3.5 Spain
11.3.6 Rest of Europe
11.4 Asia Pacific
11.4.1 Japan
11.4.2 China
11.4.3 India
11.4.4 Australia
11.4.5 New Zealand
11.4.6 South Korea
11.4.7 Rest of Asia Pacific
11.5 South America
11.5.1 Argentina
11.5.2 Brazil
11.5.3 Chile
11.5.4 Rest of South America
11.6 Middle East & Africa
11.6.1 Saudi Arabia
11.6.2 UAE
11.6.3 Qatar
11.6.4 South Africa
11.6.5 Rest of Middle East & Africa
12 Key Developments
12.1 Agreements, Partnerships, Collaborations and Joint Ventures
12.2 Acquisitions & Mergers
12.3 New Product Launch
12.4 Expansions
12.5 Other Key Strategies
13 Company Profiling
13.1 AGCO Corp.
13.2 CLAAS KGaAmbH
13.3 CNH Industrial N.V.
13.4 Deere & Company
13.5 Escorts Ltd.
13.6 International Tractors Ltd.
13.7 KubotaCorp.
13.8 Mahindra & Mahindra Ltd.
13.9 Tractors and Farm Equipment Ltd.
13.10 YanmarCo., Ltd.
13.11 Massey Feguson Limited
13.12 Iseki & Co. Ltd
13.13 Enerpac Tool Group
13.14 Bucher Industries
13.15 Alamo Group, Inc.
13.16 J C Bamford Excavators Ltd
13.17 Mitsubishi Heavy Industries Ltd.
13.18 Zetor Tractors AS
List of Tables
1 Global Agriculture Tractor Market Outlook, By Region (2021-2030) ($MN)
2 Global Agriculture Tractor Market Outlook, By Type (2021-2030) ($MN)
3 Global Agriculture Tractor Market Outlook, By Orchard Tractors (2021-2030) ($MN)
4 Global Agriculture Tractor Market Outlook, By Row-crop Tractors (2021-2030) ($MN)
5 Global Agriculture Tractor Market Outlook, By Other Types (2021-2030) ($MN)
6 Global Agriculture Tractor Market Outlook, By Driveline Type (2021-2030) ($MN)
7 Global Agriculture Tractor Market Outlook, By 2 Wheel Drive (2021-2030) ($MN)
8 Global Agriculture Tractor Market Outlook, By 4 Wheel Drive (2021-2030) ($MN)
9 Global Agriculture Tractor Market Outlook, By Engine Power (2021-2030) ($MN)
10 Global Agriculture Tractor Market Outlook, By Less than 40 HP (2021-2030) ($MN)
11 Global Agriculture Tractor Market Outlook, By 40HP to 80 HP (2021-2030) ($MN)
12 Global Agriculture Tractor Market Outlook, By 81HP to 120 HP (2021-2030) ($MN)
13 Global Agriculture Tractor Market Outlook, By 121 HP to 180 HP (2021-2030) ($MN)
14 Global Agriculture Tractor Market Outlook, By 181 HP to 250 HP (2021-2030) ($MN)
15 Global Agriculture Tractor Market Outlook, By More than 250 HP (2021-2030) ($MN)
16 Global Agriculture Tractor Market Outlook, By Propulsion (2021-2030) ($MN)
17 Global Agriculture Tractor Market Outlook, By Internal Combustion Engine (ICE) (2021-2030) ($MN)
18 Global Agriculture Tractor Market Outlook, By Electric and Hybrid (2021-2030) ($MN)
19 Global Agriculture Tractor Market Outlook, By Other Propulsions (2021-2030) ($MN)
20 Global Agriculture Tractor Market Outlook, By Operation (2021-2030) ($MN)
21 Global Agriculture Tractor Market Outlook, By Autonomous Tractor Vehicle (2021-2030) ($MN)
22 Global Agriculture Tractor Market Outlook, By Manual Tractor Vehicle (2021-2030) ($MN)
23 Global Agriculture Tractor Market Outlook, By Other Operations (2021-2030) ($MN)
24 Global Agriculture Tractor Market Outlook, By Application (2021-2030) ($MN)
25 Global Agriculture Tractor Market Outlook, By Harvesting (2021-2030) ($MN)
26 Global Agriculture Tractor Market Outlook, By Seed Sowing (2021-2030) ($MN)
27 Global Agriculture Tractor Market Outlook, By Irrigation (2021-2030) ($MN)
28 Global Agriculture Tractor Market Outlook, By Ploughing (2021-2030) ($MN)
29 Global Agriculture Tractor Market Outlook, By Other Applications (2021-2030) ($MN)
Note: Tables for North America, Europe, APAC, South America, and Middle East & Africa Regions are also represented in the same manner as above.
List of Figures
RESEARCH METHODOLOGY

We at ‘Stratistics’ opt for an extensive research approach which involves data mining, data validation, and data analysis. The various research sources include in-house repository, secondary research, competitor’s sources, social media research, client internal data, and primary research.
Our team of analysts prefers the most reliable and authenticated data sources in order to perform the comprehensive literature search. With access to most of the authenticated data bases our team highly considers the best mix of information through various sources to obtain extensive and accurate analysis.
Each report takes an average time of a month and a team of 4 industry analysts. The time may vary depending on the scope and data availability of the desired market report. The various parameters used in the market assessment are standardized in order to enhance the data accuracy.
Data Mining
The data is collected from several authenticated, reliable, paid and unpaid sources and is filtered depending on the scope & objective of the research. Our reports repository acts as an added advantage in this procedure. Data gathering from the raw material suppliers, distributors and the manufacturers is performed on a regular basis, this helps in the comprehensive understanding of the products value chain. Apart from the above mentioned sources the data is also collected from the industry consultants to ensure the objective of the study is in the right direction.
Market trends such as technological advancements, regulatory affairs, market dynamics (Drivers, Restraints, Opportunities and Challenges) are obtained from scientific journals, market related national & international associations and organizations.
Data Analysis
From the data that is collected depending on the scope & objective of the research the data is subjected for the analysis. The critical steps that we follow for the data analysis include:
- Product Lifecycle Analysis
- Competitor analysis
- Risk analysis
- Porters Analysis
- PESTEL Analysis
- SWOT Analysis
The data engineering is performed by the core industry experts considering both the Marketing Mix Modeling and the Demand Forecasting. The marketing mix modeling makes use of multiple-regression techniques to predict the optimal mix of marketing variables. Regression factor is based on a number of variables and how they relate to an outcome such as sales or profits.
Data Validation
The data validation is performed by the exhaustive primary research from the expert interviews. This includes telephonic interviews, focus groups, face to face interviews, and questionnaires to validate our research from all aspects. The industry experts we approach come from the leading firms, involved in the supply chain ranging from the suppliers, distributors to the manufacturers and consumers so as to ensure an unbiased analysis.
We are in touch with more than 15,000 industry experts with the right mix of consultants, CEO's, presidents, vice presidents, managers, experts from both supply side and demand side, executives and so on.
The data validation involves the primary research from the industry experts belonging to:
- Leading Companies
- Suppliers & Distributors
- Manufacturers
- Consumers
- Industry/Strategic Consultants
Apart from the data validation the primary research also helps in performing the fill gap research, i.e. providing solutions for the unmet needs of the research which helps in enhancing the reports quality.
For more details about research methodology, kindly write to us at info@strategymrc.com
Frequently Asked Questions
In case of any queries regarding this report, you can contact the customer service by filing the “Inquiry Before Buy” form available on the right hand side. You may also contact us through email: info@strategymrc.com or phone: +1-301-202-5929
Yes, the samples are available for all the published reports. You can request them by filling the “Request Sample” option available in this page.
Yes, you can request a sample with your specific requirements. All the customized samples will be provided as per the requirement with the real data masked.
All our reports are available in Digital PDF format. In case if you require them in any other formats, such as PPT, Excel etc you can submit a request through “Inquiry Before Buy” form available on the right hand side. You may also contact us through email: info@strategymrc.com or phone: +1-301-202-5929
We offer a free 15% customization with every purchase. This requirement can be fulfilled for both pre and post sale. You may send your customization requirements through email at info@strategymrc.com or call us on +1-301-202-5929.
We have 3 different licensing options available in electronic format.
- Single User Licence: Allows one person, typically the buyer, to have access to the ordered product. The ordered product cannot be distributed to anyone else.
- 2-5 User Licence: Allows the ordered product to be shared among a maximum of 5 people within your organisation.
- Corporate License: Allows the product to be shared among all employees of your organisation regardless of their geographical location.
All our reports are typically be emailed to you as an attachment.
To order any available report you need to register on our website. The payment can be made either through CCAvenue or PayPal payments gateways which accept all international cards.
We extend our support to 6 months post sale. A post sale customization is also provided to cover your unmet needs in the report.
Request Customization
We offer complimentary customization of up to 15% with every purchase. To share your customization requirements, feel free to email us at info@strategymrc.com or call us on +1-301-202-5929. .
Please Note: Customization within the 15% threshold is entirely free of charge. If your request exceeds this limit, we will conduct a feasibility assessment. Following that, a detailed quote and timeline will be provided.
WHY CHOOSE US ?

Assured Quality
Best in class reports with high standard of research integrity

24X7 Research Support
Continuous support to ensure the best customer experience.

Free Customization
Adding more values to your product of interest.

Safe & Secure Access
Providing a secured environment for all online transactions.

Trusted by 600+ Brands
Serving the most reputed brands across the world.