
Bluetooth Low Energy Market
Bluetooth Low Energy Market Forecasts to 2028 - Global Analysis By Product (Chipset, Module and Other Products), By Network Topology Type (Peripheral Device and Central Device), By Mode, By Technology, By Application, By End User and By Geography

|
Years Covered |
2020-2028 |
|
Estimated Year Value (2022) |
US $8.58 BN |
|
Projected Year Value (2028) |
US $27.85 BN |
|
CAGR (2022 - 2028) |
21.68% |
|
Regions Covered |
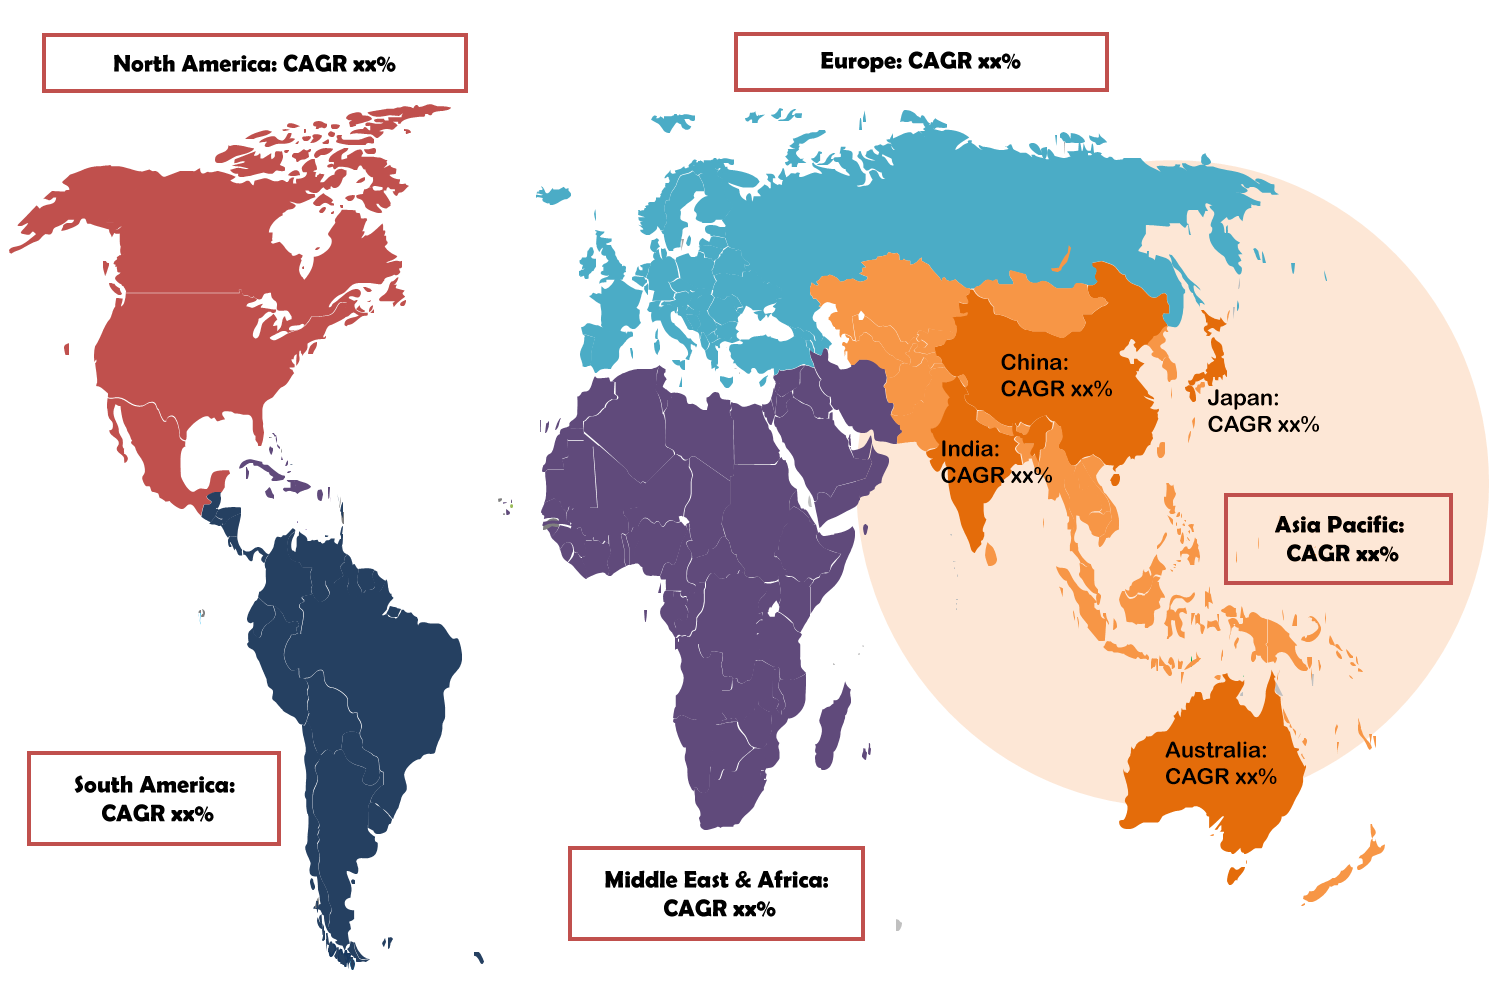
North America, Europe, Asia Pacific, South America, and Middle East & Africa |
|
Countries Covered |
US, Canada, Mexico, Germany, UK, Italy, France, Spain, Japan, China, India, Australia, New Zealand, South Korea, Rest of Asia Pacific, South America, Argentina, Brazil, Chile, Middle East & Africa, Saudi Arabia, UAE, Qatar, and South Africa |
|
Largest Market |
Asia Pacific |
|
Highest Growing Market |
Asia Pacific |
According to Stratistics MRC, the Global Bluetooth Low Energy Market is accounted for $8.58 billion in 2022 and is expected to reach $27.85 billion by 2028 growing at a CAGR of 21.68% during the forecast period. Bluetooth 4.0, frequently referred to as Bluetooth Low Energy (BLE), was initially announced in 2011 by the Nokia Corporation. Bluetooth connects devices wirelessly and is widely utilized in wireless technology for a wide range of purposes, including data transfer and sharing over a short distance. The main distinction between Bluetooth and Bluetooth Low Energy (BLE) is that BLE consumes less power than Bluetooth.
According to EnOcean GmbH, currently 14 billion wireless sensor networks (WSN’s) devices in low power mode across the globe has trashed about 400 TWh (terawatt-hour) of electricity. However, by 2020 with 50 million devices, the consumption will increase by factor 3.5 to over 1,400 TWh.

Market Dynamics:
Driver:
Adoption of IoT solutions
Currently, the market is expanding significantly due to rising demand for powered, low-maintenance wireless sensing equipment and advancements in the Internet of Things. IoT defines a system in the physical world using embedded wireless sensors that can be wired or wirelessly connected to the Internet. These sensors can establish wireless connections using a variety of technologies, including RFID, NFC, Bluetooth, Bluetooth Low Energy (BLE), and Zigbee.
Restraint:
Low data streaming
The primary issue faced by the Bluetooth low-energy market is the poor data streaming capability of low-energy Bluetooth modules. Moreover, heightened cyber security vulnerabilities are a serious worry for Bluetooth low-energy communications technology, particularly in medical devices. According to the U.S. Food and Drug Administration, this fragility could allow unauthorized users to wirelessly crash a device, prevent it from working, or access functions limited to its users.
Opportunity:
Burgeoning Bluetooth low energy maker movement
The approval of the Bluetooth v4.0 specification, followed by native support for the technology by renowned mobile operating system providers such as Android, iOS, and Windows, has produced a disruptive revolution in the Bluetooth Low Energy market. The ability of the Bluetooth Low Energy protocol to establish simple wireless connectivity to master devices such as tablets, smartphones, and many other hub devices has enabled new innovations in several markets, including smartphone accessories, automotive, computer peripherals, wearable electronic gadgets, and many others.
Threat:
Defect in technology
Bluetooth Low Energy is a standard among equipment found in hospitals and on retail store shelves. With more gadgets embracing wireless connections each day, a defect in the technology enabling complete access to medical devices is a big concern to digital-health product producers, not to mention their customers. Medical devices are becoming increasingly networked, and connected devices have inherent hazards that make them subject to security breaches. These breaches can impair the safety and effectiveness of the device and, if not corrected, may lead to patient damage.
Covid-19 Impact:
The COVID-19 (coronavirus) pandemic is harming society and the general economy across the world. The impact of this epidemic is expanding day by day and hurting the supply chain. The COVID-19 problem is producing uncertainty in the stock market, a major slowing of the supply chain, weakening corporate confidence, and increasing panic among the customer segments. The overall effect of the pandemic is impacting the production processes of various industries.
The chipsets segment is expected to be the largest during the forecast period
Chipsets segment is estimated to dominate the global market throughout the projection period. Bluetooth Low Energy chipsets are integrated circuits that feature a microprocessor along with protocol stacks, whereas a Bluetooth Low Energy module is an assembled circuit comprising a Bluetooth Low Energy chipset along with other electronic components. The manufacturer might supply the hardware solutions, depending on the production volume. Generally, if the manufacturing volume is less than 100,000 units, modules are selected, whereas for production volumes beyond 100,000 units, Bluetooth Low Energy chipsets are made.
The automotive segment is expected to have the highest CAGR during the forecast period
Automotive segment is expected to have lucrative growth during the forecast period. An important market for Bluetooth Low Energy is the automobile sector, which primarily uses the technology in its wireless multimedia receivers and audio systems. With Bluetooth Low Energy admiring widespread support made possible by its features, the original equipment manufacturers (OEMs) in the automotive industry are integrating the audio and multimedia systems in the vehicles, which is expected to drive the Bluetooth Low Energy market.
Region with largest share:
Due to the growth of the Bluetooth low-energy maker movement, the increased need for powered, low-maintenance wireless sensing equipment, and advancements in the internet of things in this region, the Asia-Pacific region is predicted to have a dominant position in the market during the forecasted period. Wireless technology will play a significant role in the future to improve the connectivity between any desirable equipment as the APAC area economy accelerates towards an interconnected environment. As a result, there will be ample opportunities for BLE, an ultra-low-power technology, to flourish across a variety of end-user industries, including automotive, wireless audio and infotainment devices, wearable electronics, industrial and home automation, and many others.
Region with highest CAGR:
Asia Pacific region is estimated to have profitable growth throughout the extrapolated period, as Asia's largest market for BLE technology is China, which has the second-largest economy in the world. It has quickly advanced in fields like education, infrastructure, high-tech manufacturing, scholarly publication, patents, and commercial applications and is currently a global leader in some of these sectors. These aspects are propelling the regions demand.
Key players in the market
Some of the key players in Bluetooth Low Energy market include Bluegiga Technologies , Cambridge Silicon Radio, Dialog, Ericsson Technologies, IBM, Infineon Technologies AG, Lenovo, Microsoft, Motorola Solutions, Nordic Semiconductor, NXP Semiconductors N.V, Panasonic, Qualcomm (CSR), Renesas Electronics , Samsung Electronics, Silicon Labs, STMicroelectronics, Texas Instruments and Toshiba Corporation.
Key Developments:
In June 2022, Texas Instruments introduced a new range of microcontrollers which enable high quality Bluetooth low energy at half the price of competing devices. These microcontrollers feature the best in-class standby current and radiofrequency performance, and is christened SimpleLinkTM Bluetooth LE CC2340.
In October 2020, Samsung Electronics introduced SmartThings Find, a tracking software which easily locates Galaxy devices. The solution utilizes Bluetooth low energy and ultra-wideband technologies to help people find and select Galaxy smartphones, tablets, smartwatches and earbuds.
Products Covered:
• Chipset
• Module
• Other Products
Network Topology Types Covered:
• Peripheral Device
• Central Device
Modes Covered:
• Dual Mode
• Single Mode
Technologies Covered:
• Discrete Solutions
• Integrated Module
• Other Technologies
Applications Covered:
• Medical
• Sensing
• Industry Automation
• Healthcare
• Automotive
• Sports and Fitness
• Consumer Electronics
• Electronic Devices
• Asset Tracking & Proximity Marketing
• Wearable Electronics
• Gaming
• Targeting and Shooting Controls
• Other Applications
End Users Covered:
• Manufacturing
• Telecommunication
• Home Appliances
• Other End Users
Regions Covered:
• North America
o US
o Canada
o Mexico
• Europe
o Germany
o UK
o Italy
o France
o Spain
o Rest of Europe
• Asia Pacific
o Japan
o China
o India
o Australia
o New Zealand
o South Korea
o Rest of Asia Pacific
• South America
o Argentina
o Brazil
o Chile
o Rest of South America
• Middle East & Africa
o Saudi Arabia
o UAE
o Qatar
o South Africa
o Rest of Middle East & Africa
What our report offers:
- Market share assessments for the regional and country-level segments
- Strategic recommendations for the new entrants
- Covers Market data for the years 2020, 2021, 2022, 2025, and 2028
- Market Trends (Drivers, Constraints, Opportunities, Threats, Challenges, Investment Opportunities, and recommendations)
- Strategic recommendations in key business segments based on the market estimations
- Competitive landscaping mapping the key common trends
- Company profiling with detailed strategies, financials, and recent developments
- Supply chain trends mapping the latest technological advancements
Free Customization Offerings:
All the customers of this report will be entitled to receive one of the following free customization options:
• Company Profiling
o Comprehensive profiling of additional market players (up to 3)
o SWOT Analysis of key players (up to 3)
• Regional Segmentation
o Market estimations, Forecasts and CAGR of any prominent country as per the client's interest (Note: Depends on feasibility check)
• Competitive Benchmarking
Benchmarking of key players based on product portfolio, geographical presence, and strategic alliances
Table of Contents
1 Executive Summary
2 Preface
2.1 Abstract
2.2 Stake Holders
2.3 Research Scope
2.4 Research Methodology
2.4.1 Data Mining
2.4.2 Data Analysis
2.4.3 Data Validation
2.4.4 Research Approach
2.5 Research Sources
2.5.1 Primary Research Sources
2.5.2 Secondary Research Sources
2.5.3 Assumptions
3 Market Trend Analysis
3.1 Introduction
3.2 Drivers
3.3 Restraints
3.4 Opportunities
3.5 Threats
3.6 Product Analysis
3.7 Technology Analysis
3.8 Application Analysis
3.9 End User Analysis
3.10 Emerging Markets
3.11 Impact of Covid-19
4 Porters Five Force Analysis
4.1 Bargaining power of suppliers
4.2 Bargaining power of buyers
4.3 Threat of substitutes
4.4 Threat of new entrants
4.5 Competitive rivalry
5 Global Bluetooth Low Energy Market, By Product
5.1 Introduction
5.2 Chipset
5.3 Module
5.4 Other Products
6 Global Bluetooth Low Energy Market, By Network Topology Type
6.1 Introduction
6.2 Peripheral Device
6.3 Central Device
7 Global Bluetooth Low Energy Market, By Mode
7.1 Introduction
7.2 Dual Mode
7.3 Single Mode
8 Global Bluetooth Low Energy Market, By Technology
8.1 Introduction
8.2 Discrete Solutions
8.3 Integrated Module
8.4 Other Technologies
9 Global Bluetooth Low Energy Market, By Application
9.1 Introduction
9.2 Medical
9.3 Sensing
9.4 Industry Automation
9.4.1 Automatic Door Openers
9.4.2 Lighting Controls
9.5 Healthcare
9.5.1 Glucose Monitors
9.5.2 Blood Pressure Monitors
9.5.3 Heart Rate Monitors
9.6 Automotive
9.6.1 Wireless Keyless Entry
9.6.2 Wireless Diagnostic Sensors
9.6.3 Navigation Systems
9.6.4 Infotainment System
9.7 Sports and Fitness
9.7.1 Gym Machines
9.7.2 Heart Rate Profile
9.7.3 Weight Scale Profile
9.7.4 Body Composition Service
9.7.5 Bike Computers
9.7.6 Speed Sensors
9.8 Consumer Electronics
9.8.1 Audio Devices
9.8.1.1 Wireless Headsets
9.8.1.2 3D glasses for TV’s
9.8.1.3 Wireless Speakers
9.8.1.4 Wireless Sound Bars
9.8.2 Mobile Handsets
9.8.3 Personal Computers
9.8.3.1 3D Glasses
9.8.3.2 Track Pads
9.8.3.3 Desktops
9.8.3.4 Laptops
9.8.3.5 Printers & Scanners
9.8.3.6 Mouse
9.8.3.7 Keyboard
9.9 Electronic Devices
9.9.1 Smart Locks
9.9.2 Fans
9.9.3 Lights
9.9.4 Air Conditioners
9.10 Asset Tracking & Proximity Marketing
9.11 Wearable Electronics
9.11.1 Wearable Health Monitoring
9.11.1.1 Home Health Monitoring
9.11.2 General Wearable Electronics
9.11.2.1 Smart Watch
9.11.2.2 Smart Glass
9.12 Gaming
9.12.1 3D Glasses
9.12.2 Motion Based Controllers
9.13 Targeting and Shooting Controls
9.14 Other Applications
10 Global Bluetooth Low Energy Market, By End User
10.1 Introduction
10.2 Manufacturing
10.3 Telecommunication
10.4 Home Appliances
10.5 Other End Users
11 Global Bluetooth Low Energy Market, By Geography
11.1 Introduction
11.2 North America
11.2.1 US
11.2.2 Canada
11.2.3 Mexico
11.3 Europe
11.3.1 Germany
11.3.2 UK
11.3.3 Italy
11.3.4 France
11.3.5 Spain
11.3.6 Rest of Europe
11.4 Asia Pacific
11.4.1 Japan
11.4.2 China
11.4.3 India
11.4.4 Australia
11.4.5 New Zealand
11.4.6 South Korea
11.4.7 Rest of Asia Pacific
11.5 South America
11.5.1 Argentina
11.5.2 Brazil
11.5.3 Chile
11.5.4 Rest of South America
11.6 Middle East & Africa
11.6.1 Saudi Arabia
11.6.2 UAE
11.6.3 Qatar
11.6.4 South Africa
11.6.5 Rest of Middle East & Africa
12 Key Developments
12.1 Agreements, Partnerships, Collaborations and Joint Ventures
12.2 Acquisitions & Mergers
12.3 New Product Launch
12.4 Expansions
12.5 Other Key Strategies
13 Company Profiling
13.1 Bluegiga Technologies
13.2 Cambridge Silicon Radio
13.3 Dialog
13.4 Ericsson Technologies
13.5 IBM
13.6 Infineon Technologies AG
13.7 Lenovo
13.8 Microsoft
13.9 Motorola Solutions
13.10 Nordic Semiconductor
13.11 NXP Semiconductors N.V
13.12 Panasonic
13.13 Qualcomm (CSR)
13.14 Renesas Electronics
13.15 Samsung Electronics
13.16 Silicon Labs
13.17 STMicroelectronics
13.18 Texas Instruments
13.19 Toshiba Corporation
List of Tables
1 Global Bluetooth Low Energy Market Outlook, By Region (2020-2028) ($MN)
2 Global Bluetooth Low Energy Market Outlook, By Product (2020-2028) ($MN)
3 Global Bluetooth Low Energy Market Outlook, By Chipset (2020-2028) ($MN)
4 Global Bluetooth Low Energy Market Outlook, By Module (2020-2028) ($MN)
5 Global Bluetooth Low Energy Market Outlook, By Other Products (2020-2028) ($MN)
6 Global Bluetooth Low Energy Market Outlook, By Network Topology Type (2020-2028) ($MN)
7 Global Bluetooth Low Energy Market Outlook, By Peripheral Device (2020-2028) ($MN)
8 Global Bluetooth Low Energy Market Outlook, By Central Device (2020-2028) ($MN)
9 Global Bluetooth Low Energy Market Outlook, By Mode (2020-2028) ($MN)
10 Global Bluetooth Low Energy Market Outlook, By Dual Mode (2020-2028) ($MN)
11 Global Bluetooth Low Energy Market Outlook, By Single Mode (2020-2028) ($MN)
12 Global Bluetooth Low Energy Market Outlook, By Technology (2020-2028) ($MN)
13 Global Bluetooth Low Energy Market Outlook, By Discrete Solutions (2020-2028) ($MN)
14 Global Bluetooth Low Energy Market Outlook, By Integrated Module (2020-2028) ($MN)
15 Global Bluetooth Low Energy Market Outlook, By Other Technologies (2020-2028) ($MN)
16 Global Bluetooth Low Energy Market Outlook, By Application (2020-2028) ($MN)
17 Global Bluetooth Low Energy Market Outlook, By Medical (2020-2028) ($MN)
18 Global Bluetooth Low Energy Market Outlook, By Sensing (2020-2028) ($MN)
19 Global Bluetooth Low Energy Market Outlook, By Industry Automation (2020-2028) ($MN)
20 Global Bluetooth Low Energy Market Outlook, By Automatic Door Openers (2020-2028) ($MN)
21 Global Bluetooth Low Energy Market Outlook, By Lighting Controls (2020-2028) ($MN)
22 Global Bluetooth Low Energy Market Outlook, By Healthcare (2020-2028) ($MN)
23 Global Bluetooth Low Energy Market Outlook, By Glucose Monitors (2020-2028) ($MN)
24 Global Bluetooth Low Energy Market Outlook, By Blood Pressure Monitors (2020-2028) ($MN)
25 Global Bluetooth Low Energy Market Outlook, By Heart Rate Monitors (2020-2028) ($MN)
26 Global Bluetooth Low Energy Market Outlook, By Automotive (2020-2028) ($MN)
27 Global Bluetooth Low Energy Market Outlook, By Wireless Keyless Entry (2020-2028) ($MN)
28 Global Bluetooth Low Energy Market Outlook, By Wireless Diagnostic Sensors (2020-2028) ($MN)
29 Global Bluetooth Low Energy Market Outlook, By Navigation Systems (2020-2028) ($MN)
30 Global Bluetooth Low Energy Market Outlook, By Infotainment System (2020-2028) ($MN)
31 Global Bluetooth Low Energy Market Outlook, By Sports and Fitness (2020-2028) ($MN)
32 Global Bluetooth Low Energy Market Outlook, By Gym Machines (2020-2028) ($MN)
33 Global Bluetooth Low Energy Market Outlook, By Heart Rate Profile (2020-2028) ($MN)
34 Global Bluetooth Low Energy Market Outlook, By Weight Scale Profile (2020-2028) ($MN)
35 Global Bluetooth Low Energy Market Outlook, By Body Composition Service (2020-2028) ($MN)
36 Global Bluetooth Low Energy Market Outlook, By Bike Computers (2020-2028) ($MN)
37 Global Bluetooth Low Energy Market Outlook, By Speed Sensors (2020-2028) ($MN)
38 Global Bluetooth Low Energy Market Outlook, By Consumer Electronics (2020-2028) ($MN)
39 Global Bluetooth Low Energy Market Outlook, By Audio Devices (2020-2028) ($MN)
40 Global Bluetooth Low Energy Market Outlook, By Mobile Handsets (2020-2028) ($MN)
41 Global Bluetooth Low Energy Market Outlook, By Personal Computers (2020-2028) ($MN)
42 Global Bluetooth Low Energy Market Outlook, By Electronic Devices (2020-2028) ($MN)
43 Global Bluetooth Low Energy Market Outlook, By Smart Locks (2020-2028) ($MN)
44 Global Bluetooth Low Energy Market Outlook, By Fans (2020-2028) ($MN)
45 Global Bluetooth Low Energy Market Outlook, By Lights (2020-2028) ($MN)
46 Global Bluetooth Low Energy Market Outlook, By Air Conditioners (2020-2028) ($MN)
47 Global Bluetooth Low Energy Market Outlook, By Asset Tracking & Proximity Marketing (2020-2028) ($MN)
48 Global Bluetooth Low Energy Market Outlook, By Wearable Electronics (2020-2028) ($MN)
49 Global Bluetooth Low Energy Market Outlook, By Wearable Health Monitoring (2020-2028) ($MN)
50 Global Bluetooth Low Energy Market Outlook, By General Wearable Electronics (2020-2028) ($MN)
51 Global Bluetooth Low Energy Market Outlook, By Gaming (2020-2028) ($MN)
52 Global Bluetooth Low Energy Market Outlook, By 3D Glasses (2020-2028) ($MN)
53 Global Bluetooth Low Energy Market Outlook, By Motion Based Controllers (2020-2028) ($MN)
54 Global Bluetooth Low Energy Market Outlook, By Targeting and Shooting Controls (2020-2028) ($MN)
55 Global Bluetooth Low Energy Market Outlook, By Other Applications (2020-2028) ($MN)
56 Global Bluetooth Low Energy Market Outlook, By End User (2020-2028) ($MN)
57 Global Bluetooth Low Energy Market Outlook, By Manufacturing (2020-2028) ($MN)
58 Global Bluetooth Low Energy Market Outlook, By Telecommunication (2020-2028) ($MN)
59 Global Bluetooth Low Energy Market Outlook, By Home Appliances (2020-2028) ($MN)
60 Global Bluetooth Low Energy Market Outlook, By Other End Users (2020-2028) ($MN)
Note: Tables for North America, Europe, Asia Pacific, South America and Middle East & Africa Regions are also represented in the same manner as above.
List of Figures
RESEARCH METHODOLOGY

We at ‘Stratistics’ opt for an extensive research approach which involves data mining, data validation, and data analysis. The various research sources include in-house repository, secondary research, competitor’s sources, social media research, client internal data, and primary research.
Our team of analysts prefers the most reliable and authenticated data sources in order to perform the comprehensive literature search. With access to most of the authenticated data bases our team highly considers the best mix of information through various sources to obtain extensive and accurate analysis.
Each report takes an average time of a month and a team of 4 industry analysts. The time may vary depending on the scope and data availability of the desired market report. The various parameters used in the market assessment are standardized in order to enhance the data accuracy.
Data Mining
The data is collected from several authenticated, reliable, paid and unpaid sources and is filtered depending on the scope & objective of the research. Our reports repository acts as an added advantage in this procedure. Data gathering from the raw material suppliers, distributors and the manufacturers is performed on a regular basis, this helps in the comprehensive understanding of the products value chain. Apart from the above mentioned sources the data is also collected from the industry consultants to ensure the objective of the study is in the right direction.
Market trends such as technological advancements, regulatory affairs, market dynamics (Drivers, Restraints, Opportunities and Challenges) are obtained from scientific journals, market related national & international associations and organizations.
Data Analysis
From the data that is collected depending on the scope & objective of the research the data is subjected for the analysis. The critical steps that we follow for the data analysis include:
- Product Lifecycle Analysis
- Competitor analysis
- Risk analysis
- Porters Analysis
- PESTEL Analysis
- SWOT Analysis
The data engineering is performed by the core industry experts considering both the Marketing Mix Modeling and the Demand Forecasting. The marketing mix modeling makes use of multiple-regression techniques to predict the optimal mix of marketing variables. Regression factor is based on a number of variables and how they relate to an outcome such as sales or profits.
Data Validation
The data validation is performed by the exhaustive primary research from the expert interviews. This includes telephonic interviews, focus groups, face to face interviews, and questionnaires to validate our research from all aspects. The industry experts we approach come from the leading firms, involved in the supply chain ranging from the suppliers, distributors to the manufacturers and consumers so as to ensure an unbiased analysis.
We are in touch with more than 15,000 industry experts with the right mix of consultants, CEO's, presidents, vice presidents, managers, experts from both supply side and demand side, executives and so on.
The data validation involves the primary research from the industry experts belonging to:
- Leading Companies
- Suppliers & Distributors
- Manufacturers
- Consumers
- Industry/Strategic Consultants
Apart from the data validation the primary research also helps in performing the fill gap research, i.e. providing solutions for the unmet needs of the research which helps in enhancing the reports quality.
For more details about research methodology, kindly write to us at info@strategymrc.com
Frequently Asked Questions
In case of any queries regarding this report, you can contact the customer service by filing the “Inquiry Before Buy” form available on the right hand side. You may also contact us through email: info@strategymrc.com or phone: +1-301-202-5929
Yes, the samples are available for all the published reports. You can request them by filling the “Request Sample” option available in this page.
Yes, you can request a sample with your specific requirements. All the customized samples will be provided as per the requirement with the real data masked.
All our reports are available in Digital PDF format. In case if you require them in any other formats, such as PPT, Excel etc you can submit a request through “Inquiry Before Buy” form available on the right hand side. You may also contact us through email: info@strategymrc.com or phone: +1-301-202-5929
We offer a free 15% customization with every purchase. This requirement can be fulfilled for both pre and post sale. You may send your customization requirements through email at info@strategymrc.com or call us on +1-301-202-5929.
We have 3 different licensing options available in electronic format.
- Single User Licence: Allows one person, typically the buyer, to have access to the ordered product. The ordered product cannot be distributed to anyone else.
- 2-5 User Licence: Allows the ordered product to be shared among a maximum of 5 people within your organisation.
- Corporate License: Allows the product to be shared among all employees of your organisation regardless of their geographical location.
All our reports are typically be emailed to you as an attachment.
To order any available report you need to register on our website. The payment can be made either through CCAvenue or PayPal payments gateways which accept all international cards.
We extend our support to 6 months post sale. A post sale customization is also provided to cover your unmet needs in the report.
Request Customization
We offer complimentary customization of up to 15% with every purchase. To share your customization requirements, feel free to email us at info@strategymrc.com or call us on +1-301-202-5929. .
Please Note: Customization within the 15% threshold is entirely free of charge. If your request exceeds this limit, we will conduct a feasibility assessment. Following that, a detailed quote and timeline will be provided.
WHY CHOOSE US ?

Assured Quality
Best in class reports with high standard of research integrity

24X7 Research Support
Continuous support to ensure the best customer experience.

Free Customization
Adding more values to your product of interest.

Safe & Secure Access
Providing a secured environment for all online transactions.

Trusted by 600+ Brands
Serving the most reputed brands across the world.