
Cup Carriers Market
Cup Carriers Market Forecasts to 2030 - Global Analysis By Material (Plastic, Wood, Molded Pulp and Other Materials), Carrying Capacity, End User and By Geography

|
Years Covered |
2021-2030 |
|
Estimated Year Value (2023) |
US $343.6 MN |
|
Projected Year Value (2030) |
US $555.5 MN |
|
CAGR (2023 - 2030) |
7.1% |
|
Regions Covered |
North America, Europe, Asia Pacific, South America, and Middle East & Africa |
|
Countries Covered |
US, Canada, Mexico, Germany, UK, Italy, France, Spain, Japan, China, India, Australia, New Zealand, South Korea, Rest of Asia Pacific, South America, Argentina, Brazil, Chile, Middle East & Africa, Saudi Arabia, UAE, Qatar, and South Africa |
|
Largest Market |
North America |
|
Highest Growing Market |
Asia Pacific |
According to Stratistics MRC, the Global Cup Carriers Market is accounted for $343.6 million in 2023 and is expected to reach $555.5 million by 2030 growing at a CAGR of 7.1% during the forecast period. To carry and transport cups while keeping their stability and preventing spills, cup carriers are essential packaging devices. Frequently, materials like cardboard, paperboard, moulded fibre, or plastic are used to make them. These carriers come in a variety of designs, including those that can accommodate two, four, six, or more cups. Coffee shops, fast food chains, and other food service businesses regularly use them for takeaway orders, drive-thru services, and catering events.
According to a survey by the National Coffee Association USA, 62% of Americans drink coffee every day, and almost half (48%) of the daily coffee drinkers in the U.S. buy their coffee from a quick-service restaurant, cafes, and drive through.
Market Dynamics:
Driver:
Increasing e-commerce industry growth
Sales of cup carriers are predicted to increase due to the beverage market's continued growth and the popularity of online delivery services. Following the pandemic, there has been a surge in the movement of online food delivery, which is projected to continue during the projection period. Cup carriers come in a variety of sizes and materials and are an effective way to distribute liquids. Moreover, sustainable growth opportunities have been established by cup carriers constructed of wood, paper, and pulp that has been moulded.
Restraint:
Growing environmental concerns
Growing environmental concerns and stringent government regulations on the usage of plastic is limiting business expansion. Additionally, the industry needs to take into account the various demands of various sections and provide them with a standard that does not harm the company's reputation when customers use cup holders in a way that allows the product to be safely stored for a longer period of time in the holder and does not cause spilling over time, interfering in any way with the user's lifestyle.
Opportunity:
Increasing demand for cup carriers
Cup carriers are also becoming more popular because they can hold a variety of liquids. Additionally, it may function simultaneously as a cup holder, a coffee travel tote, and a travel drink holder. The insulated interiors and partitions of most multiple cup carriers help to maintain the drinks appropriate temperatures and readiness for drinking at all times. These cup carriers can be used in a variety of situations. This is the element accelerating the market's expansion.
Threat:
High cost
The end-use businesses purchase these products at specific, competitive pricing. The market expansion could be hindered by the rising prices of premium materials, manufacturing, distributing, and transportation. In addition, there is a growing level of competition among suppliers, manufacturers, and important businesses. Distributors and well-established, powerful competitors are obstacles for new market entrants.
Covid-19 Impact:
The market for cup carriers has been severely disrupted by the COVID-19 outbreak. The demand for takeaway and delivery services has increased as a result of the temporary closure of catering businesses and limitations on dine-in services. To ensure the safe and secure transportation of beverages, this has resulted in a growing need for cup carriers. Due to increased hygiene and safety concerns brought on by the pandemic, single-use packaging options like cup carriers are becoming more popular. However, the industry has had to deal with difficulties like supply-chain interruptions, rising raw material costs, and declining consumer expenditure.
The plastic segment is expected to be the largest during the forecast period
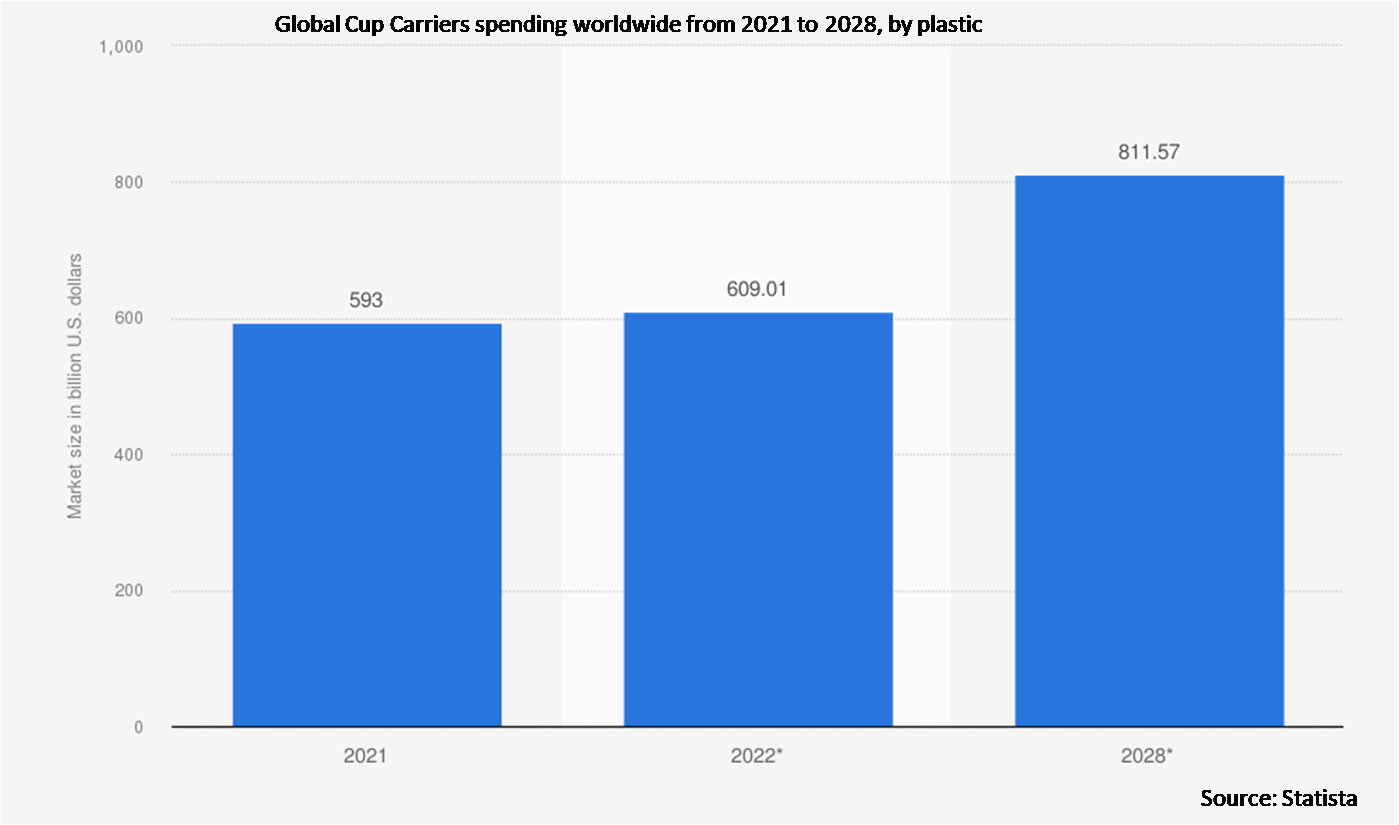
The plastic segment is expected to be the largest during the forecast period. Plastic cup carriers are renowned for their toughness and resistance to moisture. They have, however, come under fire for having an adverse effect on the environment. Plastic cup carriers are stronger against heavy loads, reducing the possibility of product loss, and providing greater protection. To address sustainability issues, efforts are being made to create biodegradable and compostable plastic cup carriers.
The food service segment is expected to have the highest CAGR during the forecast period
The food service segment is expected to have the highest CAGR during the forecast period, owing to the growing preference towards recyclability and biodegradability. A cup carrier with a handle makes it simple to transport several drinks at once. With the capacity to hold four hot or cold drinks simultaneously, this carrier makes it simple for users to transport drinks while on the go. For both drivers and passengers, cup holders in vehicle interiors offer useful advantages such beverage stability, convenience, attention reduction, organisation, and comfort.
Region with largest share:
North America is projected to hold the largest market share during the forecast period. The region's ongoing need for food to eat on the go is said to be the cause of the rise. The high levels of discretionary income in the US and Canada will further increase demand for the goods. The use of print-on-demand processes is one of the innovations aiding the industry expansion in this area. Such technological advancements are anticipated to maintain market expansion.
Region with highest CAGR:
Asia Pacific is projected to hold the highest CAGR over the forecast period, due to the rising trend of specialized food & beverage packaging. Due to the changing lifestyles and higher level of living in this area, cup holders and beverages are in high demand. Because the average person uses cup holders so frequently, this is boosting demand for them. People are also shifting from rural to urban areas as a result of rising family incomes, which is raising product consumption.

Key players in the market
Some of the key players in Cup Carriers market include Huhtamäki Oyj, Georgia-Pacific Consumer Products LP, Southern Champion Tray, LP, Green Paper Products, Graphic Packaging International, LLC, Sabert Corporation, CELLULOPACK SAS, Cascades inc, WestRock Company, MULTI-WAYS PACKAGING, PakTech, MULTIPAP, Pactiv LLC and Colpac Ltd.
Key Developments:
In July 2022, Georgia-Pacific Corp. has announced the successful completion of its $170 million acquisition of Insulair, Inc., a privately held manufacturer of premium insulated paper cups and lids.
In February 2022, Huhtamaki extended its support to Unilever’s Carte D’Or as it slashes plastic use with a move to recyclable paper by shifting the packaging for their ice cream to recyclable paper tubs and lids.
Materials Covered:
• Plastic
• Wood
• Molded Pulp
• Paper
• Other Materials
Carrying Capacities Covered:
• Above 4 Cups
• 02 Cups to 04 Cups
• Single Cup
End Users Covered:
• Household
• Food Service
• Institutional
• Pharmaceuticals
• Personal Care
• Other End Users
Regions Covered:
• North America
o US
o Canada
o Mexico
• Europe
o Germany
o UK
o Italy
o France
o Spain
o Rest of Europe
• Asia Pacific
o Japan
o China
o India
o Australia
o New Zealand
o South Korea
o Rest of Asia Pacific
• South America
o Argentina
o Brazil
o Chile
o Rest of South America
• Middle East & Africa
o Saudi Arabia
o UAE
o Qatar
o South Africa
o Rest of Middle East & Africa
What our report offers:
- Market share assessments for the regional and country-level segments
- Strategic recommendations for the new entrants
- Covers Market data for the years 2021, 2022, 2023, 2026, and 2030
- Market Trends (Drivers, Constraints, Opportunities, Threats, Challenges, Investment Opportunities, and recommendations)
- Strategic recommendations in key business segments based on the market estimations
- Competitive landscaping mapping the key common trends
- Company profiling with detailed strategies, financials, and recent developments
- Supply chain trends mapping the latest technological advancements
Free Customization Offerings:
All the customers of this report will be entitled to receive one of the following free customization options:
• Company Profiling
o Comprehensive profiling of additional market players (up to 3)
o SWOT Analysis of key players (up to 3)
• Regional Segmentation
o Market estimations, Forecasts and CAGR of any prominent country as per the client's interest (Note: Depends on feasibility check)
• Competitive Benchmarking
o Benchmarking of key players based on product portfolio, geographical presence, and strategic alliances
Table of Contents
1 Executive Summary
2 Preface
2.1 Abstract
2.2 Stake Holders
2.3 Research Scope
2.4 Research Methodology
2.4.1 Data Mining
2.4.2 Data Analysis
2.4.3 Data Validation
2.4.4 Research Approach
2.5 Research Sources
2.5.1 Primary Research Sources
2.5.2 Secondary Research Sources
2.5.3 Assumptions
3 Market Trend Analysis
3.1 Introduction
3.2 Drivers
3.3 Restraints
3.4 Opportunities
3.5 Threats
3.6 End User Analysis
3.7 Emerging Markets
3.8 Impact of Covid-19
4 Porters Five Force Analysis
4.1 Bargaining power of suppliers
4.2 Bargaining power of buyers
4.3 Threat of substitutes
4.4 Threat of new entrants
4.5 Competitive rivalry
5 Global Cup Carriers Market, By Material
5.1 Introduction
5.2 Plastic
5.2.1 Polyethylene (PE)
5.2.2 Polyethylene Terephthalate (PET)
5.2.3 Polypropylene (PP)
5.3 Wood
5.4 Molded Pulp
5.5 Paper
5.6 Other Materials
6 Global Cup Carriers Market, By Carrying Capacity
6.1 Introduction
6.2 Above 4 Cups
6.3 02 Cups to 04 Cups
6.4 Single Cup
7 Global Cup Carriers Market, By End User
7.1 Introduction
7.2 Household
7.3 Food Service
7.3.1 Restaurants
7.3.2 Quick Service Restaurant
7.3.3 Cafes
7.3.4 Hotels
7.4 Institutional
7.5 Pharmaceuticals
7.6 Personal Care
7.7 Other End Users
8 Global Cup Carriers Market, By Geography
8.1 Introduction
8.2 North America
8.2.1 US
8.2.2 Canada
8.2.3 Mexico
8.3 Europe
8.3.1 Germany
8.3.2 UK
8.3.3 Italy
8.3.4 France
8.3.5 Spain
8.3.6 Rest of Europe
8.4 Asia Pacific
8.4.1 Japan
8.4.2 China
8.4.3 India
8.4.4 Australia
8.4.5 New Zealand
8.4.6 South Korea
8.4.7 Rest of Asia Pacific
8.5 South America
8.5.1 Argentina
8.5.2 Brazil
8.5.3 Chile
8.5.4 Rest of South America
8.6 Middle East & Africa
8.6.1 Saudi Arabia
8.6.2 UAE
8.6.3 Qatar
8.6.4 South Africa
8.6.5 Rest of Middle East & Africa
9 Key Developments
9.1 Agreements, Partnerships, Collaborations and Joint Ventures
9.2 Acquisitions & Mergers
9.3 New Product Launch
9.4 Expansions
9.5 Other Key Strategies
10 Company Profiling
10.1 Huhtamäki Oyj
10.2 Georgia-Pacific Consumer Products LP
10.3 Southern Champion Tray, LP
10.4 Green Paper Products
10.5 Graphic Packaging International, LLC
10.6 Sabert Corporation
10.7 CELLULOPACK SAS
10.8 Cascades inc
10.9 WestRock Company
10.10 MULTI-WAYS PACKAGING
10.11 PakTech
10.12 MULTIPAP
10.13 Pactiv LLC
10.14 Colpac Ltd
List of Tables
1 Global Cup Carriers Market Outlook, By Region (2021-2030) ($MN)
2 Global Cup Carriers Market Outlook, By Material (2021-2030) ($MN)
3 Global Cup Carriers Market Outlook, By Plastic (2021-2030) ($MN)
4 Global Cup Carriers Market Outlook, By Polyethylene (PE) (2021-2030) ($MN)
5 Global Cup Carriers Market Outlook, By Polyethylene Terephthalate (PET) (2021-2030) ($MN)
6 Global Cup Carriers Market Outlook, By Polypropylene (PP) (2021-2030) ($MN)
7 Global Cup Carriers Market Outlook, By Wood (2021-2030) ($MN)
8 Global Cup Carriers Market Outlook, By Molded Pulp (2021-2030) ($MN)
9 Global Cup Carriers Market Outlook, By Paper (2021-2030) ($MN)
10 Global Cup Carriers Market Outlook, By Other Materials (2021-2030) ($MN)
11 Global Cup Carriers Market Outlook, By Carrying Capacity (2021-2030) ($MN)
12 Global Cup Carriers Market Outlook, By Above 4 Cups (2021-2030) ($MN)
13 Global Cup Carriers Market Outlook, By 02 Cups to 04 Cups (2021-2030) ($MN)
14 Global Cup Carriers Market Outlook, By Single Cup (2021-2030) ($MN)
15 Global Cup Carriers Market Outlook, By End User (2021-2030) ($MN)
16 Global Cup Carriers Market Outlook, By Household (2021-2030) ($MN)
17 Global Cup Carriers Market Outlook, By Food Service (2021-2030) ($MN)
18 Global Cup Carriers Market Outlook, By Restaurants (2021-2030) ($MN)
19 Global Cup Carriers Market Outlook, By Quick Service Restaurant (2021-2030) ($MN)
20 Global Cup Carriers Market Outlook, By Cafes (2021-2030) ($MN)
21 Global Cup Carriers Market Outlook, By Hotels (2021-2030) ($MN)
22 Global Cup Carriers Market Outlook, By Institutional (2021-2030) ($MN)
23 Global Cup Carriers Market Outlook, By Pharmaceuticals (2021-2030) ($MN)
24 Global Cup Carriers Market Outlook, By Personal Care (2021-2030) ($MN)
25 Global Cup Carriers Market Outlook, By Other End Users (2021-2030) ($MN)
26 North America Cup Carriers Market Outlook, By Country (2021-2030) ($MN)
27 North America Cup Carriers Market Outlook, By Material (2021-2030) ($MN)
28 North America Cup Carriers Market Outlook, By Plastic (2021-2030) ($MN)
29 North America Cup Carriers Market Outlook, By Polyethylene (PE) (2021-2030) ($MN)
30 North America Cup Carriers Market Outlook, By Polyethylene Terephthalate (PET) (2021-2030) ($MN)
31 North America Cup Carriers Market Outlook, By Polypropylene (PP) (2021-2030) ($MN)
32 North America Cup Carriers Market Outlook, By Wood (2021-2030) ($MN)
33 North America Cup Carriers Market Outlook, By Molded Pulp (2021-2030) ($MN)
34 North America Cup Carriers Market Outlook, By Paper (2021-2030) ($MN)
35 North America Cup Carriers Market Outlook, By Other Materials (2021-2030) ($MN)
36 North America Cup Carriers Market Outlook, By Carrying Capacity (2021-2030) ($MN)
37 North America Cup Carriers Market Outlook, By Above 4 Cups (2021-2030) ($MN)
38 North America Cup Carriers Market Outlook, By 02 Cups to 04 Cups (2021-2030) ($MN)
39 North America Cup Carriers Market Outlook, By Single Cup (2021-2030) ($MN)
40 North America Cup Carriers Market Outlook, By End User (2021-2030) ($MN)
41 North America Cup Carriers Market Outlook, By Household (2021-2030) ($MN)
42 North America Cup Carriers Market Outlook, By Food Service (2021-2030) ($MN)
43 North America Cup Carriers Market Outlook, By Restaurants (2021-2030) ($MN)
44 North America Cup Carriers Market Outlook, By Quick Service Restaurant (2021-2030) ($MN)
45 North America Cup Carriers Market Outlook, By Cafes (2021-2030) ($MN)
46 North America Cup Carriers Market Outlook, By Hotels (2021-2030) ($MN)
47 North America Cup Carriers Market Outlook, By Institutional (2021-2030) ($MN)
48 North America Cup Carriers Market Outlook, By Pharmaceuticals (2021-2030) ($MN)
49 North America Cup Carriers Market Outlook, By Personal Care (2021-2030) ($MN)
50 North America Cup Carriers Market Outlook, By Other End Users (2021-2030) ($MN)
51 Europe Cup Carriers Market Outlook, By Country (2021-2030) ($MN)
52 Europe Cup Carriers Market Outlook, By Material (2021-2030) ($MN)
53 Europe Cup Carriers Market Outlook, By Plastic (2021-2030) ($MN)
54 Europe Cup Carriers Market Outlook, By Polyethylene (PE) (2021-2030) ($MN)
55 Europe Cup Carriers Market Outlook, By Polyethylene Terephthalate (PET) (2021-2030) ($MN)
56 Europe Cup Carriers Market Outlook, By Polypropylene (PP) (2021-2030) ($MN)
57 Europe Cup Carriers Market Outlook, By Wood (2021-2030) ($MN)
58 Europe Cup Carriers Market Outlook, By Molded Pulp (2021-2030) ($MN)
59 Europe Cup Carriers Market Outlook, By Paper (2021-2030) ($MN)
60 Europe Cup Carriers Market Outlook, By Other Materials (2021-2030) ($MN)
61 Europe Cup Carriers Market Outlook, By Carrying Capacity (2021-2030) ($MN)
62 Europe Cup Carriers Market Outlook, By Above 4 Cups (2021-2030) ($MN)
63 Europe Cup Carriers Market Outlook, By 02 Cups to 04 Cups (2021-2030) ($MN)
64 Europe Cup Carriers Market Outlook, By Single Cup (2021-2030) ($MN)
65 Europe Cup Carriers Market Outlook, By End User (2021-2030) ($MN)
66 Europe Cup Carriers Market Outlook, By Household (2021-2030) ($MN)
67 Europe Cup Carriers Market Outlook, By Food Service (2021-2030) ($MN)
68 Europe Cup Carriers Market Outlook, By Restaurants (2021-2030) ($MN)
69 Europe Cup Carriers Market Outlook, By Quick Service Restaurant (2021-2030) ($MN)
70 Europe Cup Carriers Market Outlook, By Cafes (2021-2030) ($MN)
71 Europe Cup Carriers Market Outlook, By Hotels (2021-2030) ($MN)
72 Europe Cup Carriers Market Outlook, By Institutional (2021-2030) ($MN)
73 Europe Cup Carriers Market Outlook, By Pharmaceuticals (2021-2030) ($MN)
74 Europe Cup Carriers Market Outlook, By Personal Care (2021-2030) ($MN)
75 Europe Cup Carriers Market Outlook, By Other End Users (2021-2030) ($MN)
76 Asia Pacific Cup Carriers Market Outlook, By Country (2021-2030) ($MN)
77 Asia Pacific Cup Carriers Market Outlook, By Material (2021-2030) ($MN)
78 Asia Pacific Cup Carriers Market Outlook, By Plastic (2021-2030) ($MN)
79 Asia Pacific Cup Carriers Market Outlook, By Polyethylene (PE) (2021-2030) ($MN)
80 Asia Pacific Cup Carriers Market Outlook, By Polyethylene Terephthalate (PET) (2021-2030) ($MN)
81 Asia Pacific Cup Carriers Market Outlook, By Polypropylene (PP) (2021-2030) ($MN)
82 Asia Pacific Cup Carriers Market Outlook, By Wood (2021-2030) ($MN)
83 Asia Pacific Cup Carriers Market Outlook, By Molded Pulp (2021-2030) ($MN)
84 Asia Pacific Cup Carriers Market Outlook, By Paper (2021-2030) ($MN)
85 Asia Pacific Cup Carriers Market Outlook, By Other Materials (2021-2030) ($MN)
86 Asia Pacific Cup Carriers Market Outlook, By Carrying Capacity (2021-2030) ($MN)
87 Asia Pacific Cup Carriers Market Outlook, By Above 4 Cups (2021-2030) ($MN)
88 Asia Pacific Cup Carriers Market Outlook, By 02 Cups to 04 Cups (2021-2030) ($MN)
89 Asia Pacific Cup Carriers Market Outlook, By Single Cup (2021-2030) ($MN)
90 Asia Pacific Cup Carriers Market Outlook, By End User (2021-2030) ($MN)
91 Asia Pacific Cup Carriers Market Outlook, By Household (2021-2030) ($MN)
92 Asia Pacific Cup Carriers Market Outlook, By Food Service (2021-2030) ($MN)
93 Asia Pacific Cup Carriers Market Outlook, By Restaurants (2021-2030) ($MN)
94 Asia Pacific Cup Carriers Market Outlook, By Quick Service Restaurant (2021-2030) ($MN)
95 Asia Pacific Cup Carriers Market Outlook, By Cafes (2021-2030) ($MN)
96 Asia Pacific Cup Carriers Market Outlook, By Hotels (2021-2030) ($MN)
97 Asia Pacific Cup Carriers Market Outlook, By Institutional (2021-2030) ($MN)
98 Asia Pacific Cup Carriers Market Outlook, By Pharmaceuticals (2021-2030) ($MN)
99 Asia Pacific Cup Carriers Market Outlook, By Personal Care (2021-2030) ($MN)
100 Asia Pacific Cup Carriers Market Outlook, By Other End Users (2021-2030) ($MN)
101 South America Cup Carriers Market Outlook, By Country (2021-2030) ($MN)
102 South America Cup Carriers Market Outlook, By Material (2021-2030) ($MN)
103 South America Cup Carriers Market Outlook, By Plastic (2021-2030) ($MN)
104 South America Cup Carriers Market Outlook, By Polyethylene (PE) (2021-2030) ($MN)
105 South America Cup Carriers Market Outlook, By Polyethylene Terephthalate (PET) (2021-2030) ($MN)
106 South America Cup Carriers Market Outlook, By Polypropylene (PP) (2021-2030) ($MN)
107 South America Cup Carriers Market Outlook, By Wood (2021-2030) ($MN)
108 South America Cup Carriers Market Outlook, By Molded Pulp (2021-2030) ($MN)
109 South America Cup Carriers Market Outlook, By Paper (2021-2030) ($MN)
110 South America Cup Carriers Market Outlook, By Other Materials (2021-2030) ($MN)
111 South America Cup Carriers Market Outlook, By Carrying Capacity (2021-2030) ($MN)
112 South America Cup Carriers Market Outlook, By Above 4 Cups (2021-2030) ($MN)
113 South America Cup Carriers Market Outlook, By 02 Cups to 04 Cups (2021-2030) ($MN)
114 South America Cup Carriers Market Outlook, By Single Cup (2021-2030) ($MN)
115 South America Cup Carriers Market Outlook, By End User (2021-2030) ($MN)
116 South America Cup Carriers Market Outlook, By Household (2021-2030) ($MN)
117 South America Cup Carriers Market Outlook, By Food Service (2021-2030) ($MN)
118 South America Cup Carriers Market Outlook, By Restaurants (2021-2030) ($MN)
119 South America Cup Carriers Market Outlook, By Quick Service Restaurant (2021-2030) ($MN)
120 South America Cup Carriers Market Outlook, By Cafes (2021-2030) ($MN)
121 South America Cup Carriers Market Outlook, By Hotels (2021-2030) ($MN)
122 South America Cup Carriers Market Outlook, By Institutional (2021-2030) ($MN)
123 South America Cup Carriers Market Outlook, By Pharmaceuticals (2021-2030) ($MN)
124 South America Cup Carriers Market Outlook, By Personal Care (2021-2030) ($MN)
125 South America Cup Carriers Market Outlook, By Other End Users (2021-2030) ($MN)
126 Middle East & Africa Cup Carriers Market Outlook, By Country (2021-2030) ($MN)
127 Middle East & Africa Cup Carriers Market Outlook, By Material (2021-2030) ($MN)
128 Middle East & Africa Cup Carriers Market Outlook, By Plastic (2021-2030) ($MN)
129 Middle East & Africa Cup Carriers Market Outlook, By Polyethylene (PE) (2021-2030) ($MN)
130 Middle East & Africa Cup Carriers Market Outlook, By Polyethylene Terephthalate (PET) (2021-2030) ($MN)
131 Middle East & Africa Cup Carriers Market Outlook, By Polypropylene (PP) (2021-2030) ($MN)
132 Middle East & Africa Cup Carriers Market Outlook, By Wood (2021-2030) ($MN)
133 Middle East & Africa Cup Carriers Market Outlook, By Molded Pulp (2021-2030) ($MN)
134 Middle East & Africa Cup Carriers Market Outlook, By Paper (2021-2030) ($MN)
135 Middle East & Africa Cup Carriers Market Outlook, By Other Materials (2021-2030) ($MN)
136 Middle East & Africa Cup Carriers Market Outlook, By Carrying Capacity (2021-2030) ($MN)
137 Middle East & Africa Cup Carriers Market Outlook, By Above 4 Cups (2021-2030) ($MN)
138 Middle East & Africa Cup Carriers Market Outlook, By 02 Cups to 04 Cups (2021-2030) ($MN)
139 Middle East & Africa Cup Carriers Market Outlook, By Single Cup (2021-2030) ($MN)
140 Middle East & Africa Cup Carriers Market Outlook, By End User (2021-2030) ($MN)
141 Middle East & Africa Cup Carriers Market Outlook, By Household (2021-2030) ($MN)
142 Middle East & Africa Cup Carriers Market Outlook, By Food Service (2021-2030) ($MN)
143 Middle East & Africa Cup Carriers Market Outlook, By Restaurants (2021-2030) ($MN)
144 Middle East & Africa Cup Carriers Market Outlook, By Quick Service Restaurant (2021-2030) ($MN)
145 Middle East & Africa Cup Carriers Market Outlook, By Cafes (2021-2030) ($MN)
146 Middle East & Africa Cup Carriers Market Outlook, By Hotels (2021-2030) ($MN)
147 Middle East & Africa Cup Carriers Market Outlook, By Institutional (2021-2030) ($MN)
148 Middle East & Africa Cup Carriers Market Outlook, By Pharmaceuticals (2021-2030) ($MN)
149 Middle East & Africa Cup Carriers Market Outlook, By Personal Care (2021-2030) ($MN)
150 Middle East & Africa Cup Carriers Market Outlook, By Other End Users (2021-2030) ($MN)
List of Figures
RESEARCH METHODOLOGY

We at ‘Stratistics’ opt for an extensive research approach which involves data mining, data validation, and data analysis. The various research sources include in-house repository, secondary research, competitor’s sources, social media research, client internal data, and primary research.
Our team of analysts prefers the most reliable and authenticated data sources in order to perform the comprehensive literature search. With access to most of the authenticated data bases our team highly considers the best mix of information through various sources to obtain extensive and accurate analysis.
Each report takes an average time of a month and a team of 4 industry analysts. The time may vary depending on the scope and data availability of the desired market report. The various parameters used in the market assessment are standardized in order to enhance the data accuracy.
Data Mining
The data is collected from several authenticated, reliable, paid and unpaid sources and is filtered depending on the scope & objective of the research. Our reports repository acts as an added advantage in this procedure. Data gathering from the raw material suppliers, distributors and the manufacturers is performed on a regular basis, this helps in the comprehensive understanding of the products value chain. Apart from the above mentioned sources the data is also collected from the industry consultants to ensure the objective of the study is in the right direction.
Market trends such as technological advancements, regulatory affairs, market dynamics (Drivers, Restraints, Opportunities and Challenges) are obtained from scientific journals, market related national & international associations and organizations.
Data Analysis
From the data that is collected depending on the scope & objective of the research the data is subjected for the analysis. The critical steps that we follow for the data analysis include:
- Product Lifecycle Analysis
- Competitor analysis
- Risk analysis
- Porters Analysis
- PESTEL Analysis
- SWOT Analysis
The data engineering is performed by the core industry experts considering both the Marketing Mix Modeling and the Demand Forecasting. The marketing mix modeling makes use of multiple-regression techniques to predict the optimal mix of marketing variables. Regression factor is based on a number of variables and how they relate to an outcome such as sales or profits.
Data Validation
The data validation is performed by the exhaustive primary research from the expert interviews. This includes telephonic interviews, focus groups, face to face interviews, and questionnaires to validate our research from all aspects. The industry experts we approach come from the leading firms, involved in the supply chain ranging from the suppliers, distributors to the manufacturers and consumers so as to ensure an unbiased analysis.
We are in touch with more than 15,000 industry experts with the right mix of consultants, CEO's, presidents, vice presidents, managers, experts from both supply side and demand side, executives and so on.
The data validation involves the primary research from the industry experts belonging to:
- Leading Companies
- Suppliers & Distributors
- Manufacturers
- Consumers
- Industry/Strategic Consultants
Apart from the data validation the primary research also helps in performing the fill gap research, i.e. providing solutions for the unmet needs of the research which helps in enhancing the reports quality.
For more details about research methodology, kindly write to us at info@strategymrc.com
Frequently Asked Questions
In case of any queries regarding this report, you can contact the customer service by filing the “Inquiry Before Buy” form available on the right hand side. You may also contact us through email: info@strategymrc.com or phone: +1-301-202-5929
Yes, the samples are available for all the published reports. You can request them by filling the “Request Sample” option available in this page.
Yes, you can request a sample with your specific requirements. All the customized samples will be provided as per the requirement with the real data masked.
All our reports are available in Digital PDF format. In case if you require them in any other formats, such as PPT, Excel etc you can submit a request through “Inquiry Before Buy” form available on the right hand side. You may also contact us through email: info@strategymrc.com or phone: +1-301-202-5929
We offer a free 15% customization with every purchase. This requirement can be fulfilled for both pre and post sale. You may send your customization requirements through email at info@strategymrc.com or call us on +1-301-202-5929.
We have 3 different licensing options available in electronic format.
- Single User Licence: Allows one person, typically the buyer, to have access to the ordered product. The ordered product cannot be distributed to anyone else.
- 2-5 User Licence: Allows the ordered product to be shared among a maximum of 5 people within your organisation.
- Corporate License: Allows the product to be shared among all employees of your organisation regardless of their geographical location.
All our reports are typically be emailed to you as an attachment.
To order any available report you need to register on our website. The payment can be made either through CCAvenue or PayPal payments gateways which accept all international cards.
We extend our support to 6 months post sale. A post sale customization is also provided to cover your unmet needs in the report.
Request Customization
We offer complimentary customization of up to 15% with every purchase. To share your customization requirements, feel free to email us at info@strategymrc.com or call us on +1-301-202-5929. .
Please Note: Customization within the 15% threshold is entirely free of charge. If your request exceeds this limit, we will conduct a feasibility assessment. Following that, a detailed quote and timeline will be provided.
WHY CHOOSE US ?

Assured Quality
Best in class reports with high standard of research integrity

24X7 Research Support
Continuous support to ensure the best customer experience.

Free Customization
Adding more values to your product of interest.

Safe & Secure Access
Providing a secured environment for all online transactions.

Trusted by 600+ Brands
Serving the most reputed brands across the world.