
Genetically Modified Food Market
Genetically Modified Food Market Forecasts to 2030 - Global Analysis By Type (Animal Products, Fruits, Vegetables and Other Types), Trait, Crop Type and By Geography

|
Years Covered |
2021-2030 |
|
Estimated Year Value (2023) |
US $109.1 BN |
|
Projected Year Value (2030) |
US $193.1 BN |
|
CAGR (2023 - 2030) |
8.5% |
|
Regions Covered |
North America, Europe, Asia Pacific, South America, and Middle East & Africa |
|
Countries Covered |
US, Canada, Mexico, Germany, UK, Italy, France, Spain, Japan, China, India, Australia, New Zealand, South Korea, Rest of Asia Pacific, South America, Argentina, Brazil, Chile, Middle East & Africa, Saudi Arabia, UAE, Qatar, and South Africa |
|
Largest Market |
Europe |
|
Highest Growing Market |
Asia Pacific |
According to Stratistics MRC, the Global Genetically Modified Food Market is accounted for $109.1 billion in 2023 and is expected to reach $193.1 billion by 2030 growing at a CAGR of 8.5% during the forecast period. The production, distribution, and consumption of foods generated from organisms whose genetic material has been altered via the use of genetic engineering techniques is referred to as the ""genetically modified food market"" in the food industry. Foods that have been genetically modified (GM), commonly referred to as genetically engineered or biotech foods, are produced by adding particular genes or DNA sequences into the genetic code of plants, animals, or microbes in order to produce desired features or qualities.
According to USDA APHIS, In 2013, the USDA approved the import of a GM pineapple that is pink in color and that ""overexpresses"" a gene derived from tangerines and suppress other genes, increasing production of lycopene.
Market Dynamics:
Driver:
Increased crop yield
Crops that have undergone genetic modification (GM) are frequently designed to be more pest and disease-resistant, increasing crop yields. This aids in supplying food to the expanding world population. Crops that have been genetically modified (GM) are designed to be more resistant to pests, diseases, and unfavorable environmental factors, increasing agricultural productivity. This is especially important as the global population keeps expanding and food consumption rises. Moreover, it is well known that GM crops, such as insect-resistant cotton and herbicide-tolerant soybeans, significantly increase yields. Furthermore, higher agricultural yields can help stabilize and lower the cost of food, which is beneficial to both farmers and consumers.
Restraint:
Concerns from consumers
Concerns regarding the security and long-term health impacts of genetically modified organisms (GMOs) in food are widespread among consumers. These concerns frequently result from ignorance, inaccurate data, or distrust regarding the process of genetic modification and its possible dangers. However, consumer demand for better labeling of items containing GMOs and, in some circumstances, proposals for stronger legislation have been sparked by these worries. Additionally, the market for genetically modified foods is being impacted by a movement in customer preferences toward non-GMO and organic products.
Opportunity:
Increased taste and quality
Certain food products may benefit from genetic alteration to improve their flavor and quality, increasing market appeal. Techniques for genetic modification enable the improvement of a variety of sensory and qualitative characteristics in foods, increasing their appeal to consumers. For instance, GM crops can be developed to enhance texture, flavor, and nutritional value, resulting in tastier and more nutrient-dense fruits, vegetables, and other food products. Additionally, these adjustments not only take into account shifting customer preferences but also take into account problems like nutritional inadequacies and the demand for attractive but healthy food products.
Threat:
Environmental concerns
Genetically modified (GM) crops may have unforeseen ecological effects, such as the emergence of pest resistance and the potential for negative effects on creatures other than the targets of the GM crop. For instance, the cultivation of genetically modified (GM) crops designed for pest resistance may unintentionally result in the production of superbugs or resistant pests, necessitating the use of additional pesticides. However, hybridization between GM crops and their wild relatives may reduce the genetic variety of plant species, threatening biodiversity.
Covid-19 Impact:
Due to interruptions in global supply systems and the stress placed on traditional agriculture, the pandemic emphasized the need for greater food security and sustainability. Due to labor shortages, transportation issues, and broken supply chains brought on by the lockdown measures and trade restrictions, the manufacture and distribution of GM food products have been delayed and disrupted.
The Stacked Traits (ST) segment is expected to be the largest during the forecast period
During the projection period, the stacked traits (ST) sector is anticipated to be the largest due to the rising demand for crops with a combination of traits that raise agricultural output, minimize environmental impact, and improve nutritional value. Additionally, by tackling several issues simultaneously, stacked trait crops accelerate agricultural operations, resulting in higher yields and more sustainable farming. They also help farmers manage resources more effectively, use fewer chemicals, and adjust to changing weather patterns.
The Soybean segment is expected to have the highest CAGR during the forecast period
Soybean segment is expected to have the highest CAGR during the forecast period. Soybeans are a popular selection for health-conscious consumers looking for alternative protein sources because they are a valuable source of plant-based protein. Soy-based products are experiencing tremendous market growth as vegetarian and vegan diets become more prevalent. Furthermore, soy's expansion in the market for genetically modified foods makes it a high-potential sector due to the demand for sustainable protein sources and its potential to help reduce deforestation associated with the production of meat.
Region with largest share:
Europe is projected to hold largest share over the forecast period. The agricultural industry in Europe is established and highly technologically advanced, enabling the widespread use of genetically modified (GM) crops. Many European nations have adopted GM technology, especially in the production of crops like rapeseed, soybeans, and maize, which are widely used in the food industry. Moreover, the stringent regulations and labeling requirements for GM foods in Europe have helped to create a well-informed and cautious consumer base. While restricting market access, these laws promoted transparency and thorough safety assessments in the GM food industry, boosting customer confidence.
Region with highest CAGR:
Due to its huge and expanding population and the changing dietary tastes brought on by urbanization and changing lifestyles, Asia Pacific is predicted to have profitable growth. There is also a developing need for food products that are more healthy, convenient, and sustainable. Additionally, by providing increased agricultural yields, higher nutritional value, and less environmental impact, genetically modified (GM) crops may satisfy these demands and keep up with the region's changing nutritional requirements.

Key players in the market
Some of the key players in Genetically Modified Food market include DuPont de Nemours, Inc, Okanagan Specialty Fruits Inc, Stine Seed Company, Groupe Limagrain Holding, Monsanto, Bayer AG, Syngenta Crop Protection AG, Dalmia Continental Pvt. Ltd, Dow Chemical Company, BASF SE and ACH Food Companies Inc.
Key Developments:
In October 2023, BASF to build new fermentation plant for crop protection products in Ludwigshafen. BASF invests a high double-digit million euro amount in a new fermentation plant for biological and biotechnology-based crop protection products at its Ludwigshafen site. The plant will manufacture products that bring value to farmers including biological fungicides and biological seed treatment.
In October 2023, Bayer AG plans to bring its direct-seeded rice programme to the Philippines in 2024, offering farmers an alternative cultivation method touted to be more climate-friendly. Bayer launched the system in India this year and says it can help reduce water use by up to 40 per cent, greenhouse gas emissions by up to 45 per cent, and manual labour costs by up to 50 per cent.
Types Covered:
• Animal Products
• Fruits
• Vegetables
• Other Types
Traits Covered:
• Stacked Traits (ST)
• Herbicide Tolerance (HR)
• Insect Resistance (IR)
• Other Traits
Crop Types Covered:
• Canola
• Cotton
• Maize
• Soybean
• Other Crop Types
Regions Covered:
• North America
o US
o Canada
o Mexico
• Europe
o Germany
o UK
o Italy
o France
o Spain
o Rest of Europe
• Asia Pacific
o Japan
o China
o India
o Australia
o New Zealand
o South Korea
o Rest of Asia Pacific
• South America
o Argentina
o Brazil
o Chile
o Rest of South America
• Middle East & Africa
o Saudi Arabia
o UAE
o Qatar
o South Africa
o Rest of Middle East & Africa
What our report offers:
- Market share assessments for the regional and country-level segments
- Strategic recommendations for the new entrants
- Covers Market data for the years 2021, 2022, 2023, 2026, and 2030
- Market Trends (Drivers, Constraints, Opportunities, Threats, Challenges, Investment Opportunities, and recommendations)
- Strategic recommendations in key business segments based on the market estimations
- Competitive landscaping mapping the key common trends
- Company profiling with detailed strategies, financials, and recent developments
- Supply chain trends mapping the latest technological advancements
Free Customization Offerings:
All the customers of this report will be entitled to receive one of the following free customization options:
• Company Profiling
o Comprehensive profiling of additional market players (up to 3)
o SWOT Analysis of key players (up to 3)
• Regional Segmentation
o Market estimations, Forecasts and CAGR of any prominent country as per the client's interest (Note: Depends on feasibility check)
• Competitive Benchmarking
Benchmarking of key players based on product portfolio, geographical presence, and strategic alliances
Table of Contents
1 Executive Summary
2 Preface
2.1 Abstract
2.2 Stake Holders
2.3 Research Scope
2.4 Research Methodology
2.4.1 Data Mining
2.4.2 Data Analysis
2.4.3 Data Validation
2.4.4 Research Approach
2.5 Research Sources
2.5.1 Primary Research Sources
2.5.2 Secondary Research Sources
2.5.3 Assumptions
3 Market Trend Analysis
3.1 Introduction
3.2 Drivers
3.3 Restraints
3.4 Opportunities
3.5 Threats
3.6 Emerging Markets
3.7 Impact of Covid-19
4 Porters Five Force Analysis
4.1 Bargaining power of suppliers
4.2 Bargaining power of buyers
4.3 Threat of substitutes
4.4 Threat of new entrants
4.5 Competitive rivalry
5 Global Genetically Modified Food Market, By Type
5.1 Introduction
5.2 Animal Products
5.3 Fruits
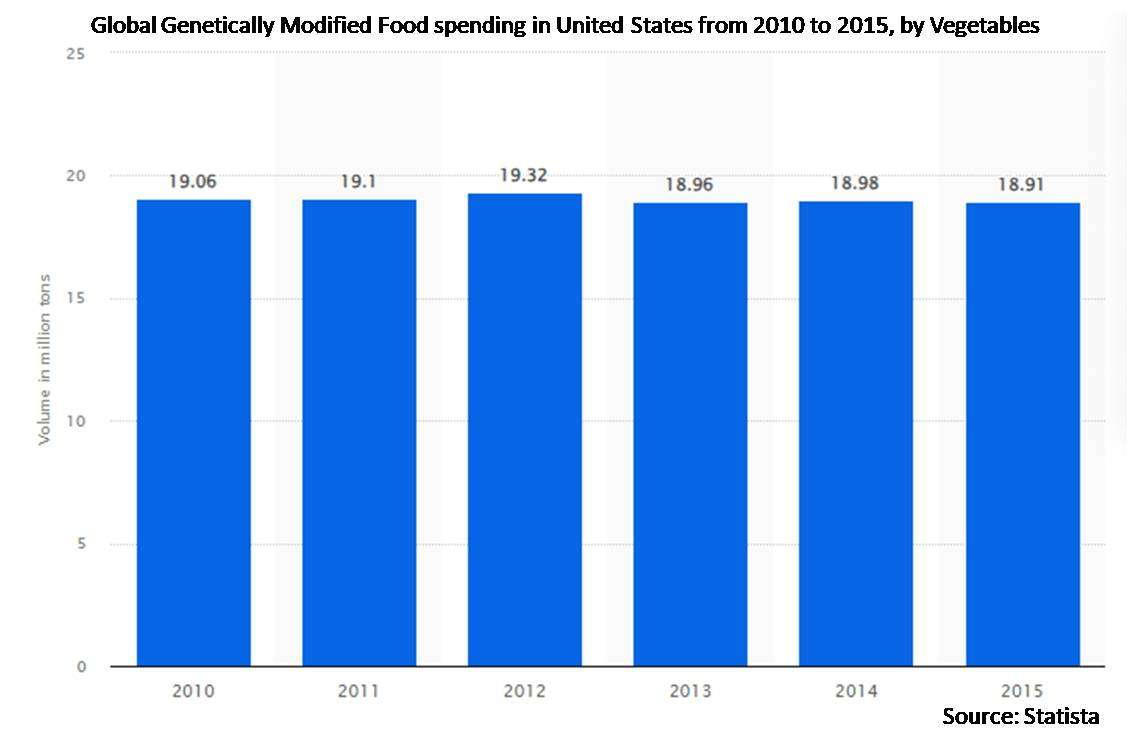
5.4 Vegetables
5.5 Other Types
6 Global Genetically Modified Food Market, By Trait
6.1 Introduction
6.2 Stacked Traits (ST)
6.3 Herbicide Tolerance (HR)
6.4 Insect Resistance (IR)
6.5 Other Traits
7 Global Genetically Modified Food Market, By Crop Type
7.1 Introduction
7.2 Canola
7.3 Cotton
7.4 Maize
7.5 Soybean
7.6 Other Crop Types
8 Global Genetically Modified Food Market, By Geography
8.1 Introduction
8.2 North America
8.2.1 US
8.2.2 Canada
8.2.3 Mexico
8.3 Europe
8.3.1 Germany
8.3.2 UK
8.3.3 Italy
8.3.4 France
8.3.5 Spain
8.3.6 Rest of Europe
8.4 Asia Pacific
8.4.1 Japan
8.4.2 China
8.4.3 India
8.4.4 Australia
8.4.5 New Zealand
8.4.6 South Korea
8.4.7 Rest of Asia Pacific
8.5 South America
8.5.1 Argentina
8.5.2 Brazil
8.5.3 Chile
8.5.4 Rest of South America
8.6 Middle East & Africa
8.6.1 Saudi Arabia
8.6.2 UAE
8.6.3 Qatar
8.6.4 South Africa
8.6.5 Rest of Middle East & Africa
9 Key Developments
9.1 Agreements, Partnerships, Collaborations and Joint Ventures
9.2 Acquisitions & Mergers
9.3 New Product Launch
9.4 Expansions
9.5 Other Key Strategies
10 Company Profiling
10.1 DuPont de Nemours, Inc
10.2 Okanagan Specialty Fruits Inc
10.3 Stine Seed Company
10.4 Groupe Limagrain Holding
10.5 Monsanto
10.6 Bayer AG
10.7 Syngenta Crop Protection AG
10.8 Dalmia Continental Pvt. Ltd
10.9 Dow Chemical Company
10.10 BASF SE
10.11 ACH Food Companies Inc
List of Tables
1 Global Genetically Modified Food Market Outlook, By Region (2021-2030) ($MN)
2 Global Genetically Modified Food Market Outlook, By Type (2021-2030) ($MN)
3 Global Genetically Modified Food Market Outlook, By Animal Products (2021-2030) ($MN)
4 Global Genetically Modified Food Market Outlook, By Fruits (2021-2030) ($MN)
5 Global Genetically Modified Food Market Outlook, By Vegetables (2021-2030) ($MN)
6 Global Genetically Modified Food Market Outlook, By Other Types (2021-2030) ($MN)
7 Global Genetically Modified Food Market Outlook, By Trait (2021-2030) ($MN)
8 Global Genetically Modified Food Market Outlook, By Stacked Traits (ST) (2021-2030) ($MN)
9 Global Genetically Modified Food Market Outlook, By Herbicide Tolerance (HR) (2021-2030) ($MN)
10 Global Genetically Modified Food Market Outlook, By Insect Resistance (IR) (2021-2030) ($MN)
11 Global Genetically Modified Food Market Outlook, By Other Traits (2021-2030) ($MN)
12 Global Genetically Modified Food Market Outlook, By Crop Type (2021-2030) ($MN)
13 Global Genetically Modified Food Market Outlook, By Canola (2021-2030) ($MN)
14 Global Genetically Modified Food Market Outlook, By Cotton (2021-2030) ($MN)
15 Global Genetically Modified Food Market Outlook, By Maize (2021-2030) ($MN)
16 Global Genetically Modified Food Market Outlook, By Soybean (2021-2030) ($MN)
17 Global Genetically Modified Food Market Outlook, By Other Crop Types (2021-2030) ($MN)
18 North America Genetically Modified Food Market Outlook, By Country (2021-2030) ($MN)
19 North America Genetically Modified Food Market Outlook, By Type (2021-2030) ($MN)
20 North America Genetically Modified Food Market Outlook, By Animal Products (2021-2030) ($MN)
21 North America Genetically Modified Food Market Outlook, By Fruits (2021-2030) ($MN)
22 North America Genetically Modified Food Market Outlook, By Vegetables (2021-2030) ($MN)
23 North America Genetically Modified Food Market Outlook, By Other Types (2021-2030) ($MN)
24 North America Genetically Modified Food Market Outlook, By Trait (2021-2030) ($MN)
25 North America Genetically Modified Food Market Outlook, By Stacked Traits (ST) (2021-2030) ($MN)
26 North America Genetically Modified Food Market Outlook, By Herbicide Tolerance (HR) (2021-2030) ($MN)
27 North America Genetically Modified Food Market Outlook, By Insect Resistance (IR) (2021-2030) ($MN)
28 North America Genetically Modified Food Market Outlook, By Other Traits (2021-2030) ($MN)
29 North America Genetically Modified Food Market Outlook, By Crop Type (2021-2030) ($MN)
30 North America Genetically Modified Food Market Outlook, By Canola (2021-2030) ($MN)
31 North America Genetically Modified Food Market Outlook, By Cotton (2021-2030) ($MN)
32 North America Genetically Modified Food Market Outlook, By Maize (2021-2030) ($MN)
33 North America Genetically Modified Food Market Outlook, By Soybean (2021-2030) ($MN)
34 North America Genetically Modified Food Market Outlook, By Other Crop Types (2021-2030) ($MN)
35 Europe Genetically Modified Food Market Outlook, By Country (2021-2030) ($MN)
36 Europe Genetically Modified Food Market Outlook, By Type (2021-2030) ($MN)
37 Europe Genetically Modified Food Market Outlook, By Animal Products (2021-2030) ($MN)
38 Europe Genetically Modified Food Market Outlook, By Fruits (2021-2030) ($MN)
39 Europe Genetically Modified Food Market Outlook, By Vegetables (2021-2030) ($MN)
40 Europe Genetically Modified Food Market Outlook, By Other Types (2021-2030) ($MN)
41 Europe Genetically Modified Food Market Outlook, By Trait (2021-2030) ($MN)
42 Europe Genetically Modified Food Market Outlook, By Stacked Traits (ST) (2021-2030) ($MN)
43 Europe Genetically Modified Food Market Outlook, By Herbicide Tolerance (HR) (2021-2030) ($MN)
44 Europe Genetically Modified Food Market Outlook, By Insect Resistance (IR) (2021-2030) ($MN)
45 Europe Genetically Modified Food Market Outlook, By Other Traits (2021-2030) ($MN)
46 Europe Genetically Modified Food Market Outlook, By Crop Type (2021-2030) ($MN)
47 Europe Genetically Modified Food Market Outlook, By Canola (2021-2030) ($MN)
48 Europe Genetically Modified Food Market Outlook, By Cotton (2021-2030) ($MN)
49 Europe Genetically Modified Food Market Outlook, By Maize (2021-2030) ($MN)
50 Europe Genetically Modified Food Market Outlook, By Soybean (2021-2030) ($MN)
51 Europe Genetically Modified Food Market Outlook, By Other Crop Types (2021-2030) ($MN)
52 Asia Pacific Genetically Modified Food Market Outlook, By Country (2021-2030) ($MN)
53 Asia Pacific Genetically Modified Food Market Outlook, By Type (2021-2030) ($MN)
54 Asia Pacific Genetically Modified Food Market Outlook, By Animal Products (2021-2030) ($MN)
55 Asia Pacific Genetically Modified Food Market Outlook, By Fruits (2021-2030) ($MN)
56 Asia Pacific Genetically Modified Food Market Outlook, By Vegetables (2021-2030) ($MN)
57 Asia Pacific Genetically Modified Food Market Outlook, By Other Types (2021-2030) ($MN)
58 Asia Pacific Genetically Modified Food Market Outlook, By Trait (2021-2030) ($MN)
59 Asia Pacific Genetically Modified Food Market Outlook, By Stacked Traits (ST) (2021-2030) ($MN)
60 Asia Pacific Genetically Modified Food Market Outlook, By Herbicide Tolerance (HR) (2021-2030) ($MN)
61 Asia Pacific Genetically Modified Food Market Outlook, By Insect Resistance (IR) (2021-2030) ($MN)
62 Asia Pacific Genetically Modified Food Market Outlook, By Other Traits (2021-2030) ($MN)
63 Asia Pacific Genetically Modified Food Market Outlook, By Crop Type (2021-2030) ($MN)
64 Asia Pacific Genetically Modified Food Market Outlook, By Canola (2021-2030) ($MN)
65 Asia Pacific Genetically Modified Food Market Outlook, By Cotton (2021-2030) ($MN)
66 Asia Pacific Genetically Modified Food Market Outlook, By Maize (2021-2030) ($MN)
67 Asia Pacific Genetically Modified Food Market Outlook, By Soybean (2021-2030) ($MN)
68 Asia Pacific Genetically Modified Food Market Outlook, By Other Crop Types (2021-2030) ($MN)
69 South America Genetically Modified Food Market Outlook, By Country (2021-2030) ($MN)
70 South America Genetically Modified Food Market Outlook, By Type (2021-2030) ($MN)
71 South America Genetically Modified Food Market Outlook, By Animal Products (2021-2030) ($MN)
72 South America Genetically Modified Food Market Outlook, By Fruits (2021-2030) ($MN)
73 South America Genetically Modified Food Market Outlook, By Vegetables (2021-2030) ($MN)
74 South America Genetically Modified Food Market Outlook, By Other Types (2021-2030) ($MN)
75 South America Genetically Modified Food Market Outlook, By Trait (2021-2030) ($MN)
76 South America Genetically Modified Food Market Outlook, By Stacked Traits (ST) (2021-2030) ($MN)
77 South America Genetically Modified Food Market Outlook, By Herbicide Tolerance (HR) (2021-2030) ($MN)
78 South America Genetically Modified Food Market Outlook, By Insect Resistance (IR) (2021-2030) ($MN)
79 South America Genetically Modified Food Market Outlook, By Other Traits (2021-2030) ($MN)
80 South America Genetically Modified Food Market Outlook, By Crop Type (2021-2030) ($MN)
81 South America Genetically Modified Food Market Outlook, By Canola (2021-2030) ($MN)
82 South America Genetically Modified Food Market Outlook, By Cotton (2021-2030) ($MN)
83 South America Genetically Modified Food Market Outlook, By Maize (2021-2030) ($MN)
84 South America Genetically Modified Food Market Outlook, By Soybean (2021-2030) ($MN)
85 South America Genetically Modified Food Market Outlook, By Other Crop Types (2021-2030) ($MN)
86 Middle East & Africa Genetically Modified Food Market Outlook, By Country (2021-2030) ($MN)
87 Middle East & Africa Genetically Modified Food Market Outlook, By Type (2021-2030) ($MN)
88 Middle East & Africa Genetically Modified Food Market Outlook, By Animal Products (2021-2030) ($MN)
89 Middle East & Africa Genetically Modified Food Market Outlook, By Fruits (2021-2030) ($MN)
90 Middle East & Africa Genetically Modified Food Market Outlook, By Vegetables (2021-2030) ($MN)
91 Middle East & Africa Genetically Modified Food Market Outlook, By Other Types (2021-2030) ($MN)
92 Middle East & Africa Genetically Modified Food Market Outlook, By Trait (2021-2030) ($MN)
93 Middle East & Africa Genetically Modified Food Market Outlook, By Stacked Traits (ST) (2021-2030) ($MN)
94 Middle East & Africa Genetically Modified Food Market Outlook, By Herbicide Tolerance (HR) (2021-2030) ($MN)
95 Middle East & Africa Genetically Modified Food Market Outlook, By Insect Resistance (IR) (2021-2030) ($MN)
96 Middle East & Africa Genetically Modified Food Market Outlook, By Other Traits (2021-2030) ($MN)
97 Middle East & Africa Genetically Modified Food Market Outlook, By Crop Type (2021-2030) ($MN)
98 Middle East & Africa Genetically Modified Food Market Outlook, By Canola (2021-2030) ($MN)
99 Middle East & Africa Genetically Modified Food Market Outlook, By Cotton (2021-2030) ($MN)
100 Middle East & Africa Genetically Modified Food Market Outlook, By Maize (2021-2030) ($MN)
101 Middle East & Africa Genetically Modified Food Market Outlook, By Soybean (2021-2030) ($MN)
102 Middle East & Africa Genetically Modified Food Market Outlook, By Other Crop Types (2021-2030) ($MN)
List of Figures
RESEARCH METHODOLOGY

We at ‘Stratistics’ opt for an extensive research approach which involves data mining, data validation, and data analysis. The various research sources include in-house repository, secondary research, competitor’s sources, social media research, client internal data, and primary research.
Our team of analysts prefers the most reliable and authenticated data sources in order to perform the comprehensive literature search. With access to most of the authenticated data bases our team highly considers the best mix of information through various sources to obtain extensive and accurate analysis.
Each report takes an average time of a month and a team of 4 industry analysts. The time may vary depending on the scope and data availability of the desired market report. The various parameters used in the market assessment are standardized in order to enhance the data accuracy.
Data Mining
The data is collected from several authenticated, reliable, paid and unpaid sources and is filtered depending on the scope & objective of the research. Our reports repository acts as an added advantage in this procedure. Data gathering from the raw material suppliers, distributors and the manufacturers is performed on a regular basis, this helps in the comprehensive understanding of the products value chain. Apart from the above mentioned sources the data is also collected from the industry consultants to ensure the objective of the study is in the right direction.
Market trends such as technological advancements, regulatory affairs, market dynamics (Drivers, Restraints, Opportunities and Challenges) are obtained from scientific journals, market related national & international associations and organizations.
Data Analysis
From the data that is collected depending on the scope & objective of the research the data is subjected for the analysis. The critical steps that we follow for the data analysis include:
- Product Lifecycle Analysis
- Competitor analysis
- Risk analysis
- Porters Analysis
- PESTEL Analysis
- SWOT Analysis
The data engineering is performed by the core industry experts considering both the Marketing Mix Modeling and the Demand Forecasting. The marketing mix modeling makes use of multiple-regression techniques to predict the optimal mix of marketing variables. Regression factor is based on a number of variables and how they relate to an outcome such as sales or profits.
Data Validation
The data validation is performed by the exhaustive primary research from the expert interviews. This includes telephonic interviews, focus groups, face to face interviews, and questionnaires to validate our research from all aspects. The industry experts we approach come from the leading firms, involved in the supply chain ranging from the suppliers, distributors to the manufacturers and consumers so as to ensure an unbiased analysis.
We are in touch with more than 15,000 industry experts with the right mix of consultants, CEO's, presidents, vice presidents, managers, experts from both supply side and demand side, executives and so on.
The data validation involves the primary research from the industry experts belonging to:
- Leading Companies
- Suppliers & Distributors
- Manufacturers
- Consumers
- Industry/Strategic Consultants
Apart from the data validation the primary research also helps in performing the fill gap research, i.e. providing solutions for the unmet needs of the research which helps in enhancing the reports quality.
For more details about research methodology, kindly write to us at info@strategymrc.com
Frequently Asked Questions
In case of any queries regarding this report, you can contact the customer service by filing the “Inquiry Before Buy” form available on the right hand side. You may also contact us through email: info@strategymrc.com or phone: +1-301-202-5929
Yes, the samples are available for all the published reports. You can request them by filling the “Request Sample” option available in this page.
Yes, you can request a sample with your specific requirements. All the customized samples will be provided as per the requirement with the real data masked.
All our reports are available in Digital PDF format. In case if you require them in any other formats, such as PPT, Excel etc you can submit a request through “Inquiry Before Buy” form available on the right hand side. You may also contact us through email: info@strategymrc.com or phone: +1-301-202-5929
We offer a free 15% customization with every purchase. This requirement can be fulfilled for both pre and post sale. You may send your customization requirements through email at info@strategymrc.com or call us on +1-301-202-5929.
We have 3 different licensing options available in electronic format.
- Single User Licence: Allows one person, typically the buyer, to have access to the ordered product. The ordered product cannot be distributed to anyone else.
- 2-5 User Licence: Allows the ordered product to be shared among a maximum of 5 people within your organisation.
- Corporate License: Allows the product to be shared among all employees of your organisation regardless of their geographical location.
All our reports are typically be emailed to you as an attachment.
To order any available report you need to register on our website. The payment can be made either through CCAvenue or PayPal payments gateways which accept all international cards.
We extend our support to 6 months post sale. A post sale customization is also provided to cover your unmet needs in the report.
Request Customization
We offer complimentary customization of up to 15% with every purchase. To share your customization requirements, feel free to email us at info@strategymrc.com or call us on +1-301-202-5929. .
Please Note: Customization within the 15% threshold is entirely free of charge. If your request exceeds this limit, we will conduct a feasibility assessment. Following that, a detailed quote and timeline will be provided.
WHY CHOOSE US ?

Assured Quality
Best in class reports with high standard of research integrity

24X7 Research Support
Continuous support to ensure the best customer experience.

Free Customization
Adding more values to your product of interest.

Safe & Secure Access
Providing a secured environment for all online transactions.

Trusted by 600+ Brands
Serving the most reputed brands across the world.