
Multi Touch Sensing Market
Multi-Touch Sensing Market Forecasts to 2030 - Global Analysis By Product (Smartphones, Tablets, Personal Computers & Laptops, Kiosks and Other Products), Technology, Application, End User and By Geography

|
Years Covered |
2021-2030 |
|
Estimated Year Value (2023) |
US $14.41 BN |
|
Projected Year Value (2030) |
US $31.66 BN |
|
CAGR (2023 - 2030) |
11.9% |
|
Regions Covered |
North America, Europe, Asia Pacific, South America, and Middle East & Africa |
|
Countries Covered |
US, Canada, Mexico, Germany, UK, Italy, France, Spain, Japan, China, India, Australia, New Zealand, South Korea, Rest of Asia Pacific, South America, Argentina, Brazil, Chile, Middle East & Africa, Saudi Arabia, UAE, Qatar, and South Africa |
|
Largest Market |
Asia Pacific |
|
Highest Growing Market |
North America |
According to Stratistics MRC, the Global Multi-Touch Sensing Market is accounted for $14.41 billion in 2023 and is expected to reach $31.66 billion by 2030 growing at a CAGR of 11.9% during the forecast period. Multi-touch sensing is a technology that enables the detection and tracking of multiple simultaneous touch points on a touch-sensitive surface, like screens or track pads. Popularized by devices such as smartphones and tablets, it allows users to interact with digital content using multiple fingers or gestures. Capacitive sensors in the device's display register changes in electrical charge caused by touch, enabling the recognition of various inputs. This intuitive and versatile technology has revolutionized user interfaces, enhancing the way people navigate, zoom, rotate, and manipulate digital content with ease.
According to the Consumer Technology Association (CTA), the US consumer technology industry is projected to generate over USD 505 billion in retail sales revenue for the first time ever. The estimation represents a 2.8% revenue increase from 2021's impressive 9.6% growth over 2020.
Market Dynamics:
Driver:
Growing consumer preference for touch-enabled devices
The demand for multi-touch sensing is expanding rapidly due to consumers' growing inclination towards touch-enabled gadgets. The sector is being driven by touch technology due to the growing need for smooth and simple user experiences. Multi-touch sensing systems are becoming increasingly prevalent due to the growing popularity of smartphones, tablets, and other touch-sensitive devices. The market is set to grow further as customers demand more interactive and user-friendly interfaces, meeting the changing demands of a tech-savvy audience.
Restraint:
Limited haptic feedback
Limited haptic feedback in multi-touch sensing is primarily due to technical challenges and cost considerations. Integrating effective haptic feedback is complex, requiring additional components and sophisticated engineering. The added complexity often results in higher production costs and device prices. Users may find the lack of physical response less engaging and immersive. The absence of tactile feedback diminishes the user experience, hindering the market's potential.
Opportunity:
Increasing integration in self-service terminals
The multi-touch sensing experiences a boost through increasing integration into self-service terminals, such as kiosks and ATMs. The demand for enhanced user experiences drives the adoption of multi-touch technology, providing intuitive and interactive interfaces for users. Self-service terminals with advanced touch capabilities offer efficiency, convenience, and improved accessibility, contributing to a positive user perception. As businesses across various sectors embrace these solutions, the market expands, fuelled by the growing reliance on user-friendly, touch-enabled interfaces in self-service applications.
Threat:
Security concerns
Security concerns in multi-touch sensing include the risk of unauthorized access, data breaches, and privacy issues arising from the collection and processing of sensitive user information. As these technologies become integral to various applications, the potential for malicious attacks and exploitation increases. Security vulnerabilities can undermine user trust, leading to reluctance in adopting multi-touch sensing solutions. This apprehension hampers market growth as businesses and consumers prioritize secure and reliable technologies.
Covid-19 Impact
The covid-19 pandemic significantly impacted the multi-touch sensing market as global supply chain disruptions, factory closures, and reduced consumer spending led to a decline in demand for electronic devices incorporating touch technology. The lockdown measures also hampered production and distribution, affecting market growth. However, the increasing emphasis on touchless interfaces and remote collaboration solutions in the post-pandemic era driven the market's recovery, with a renewed focus on innovation and technological advancements in touch-sensitive devices.
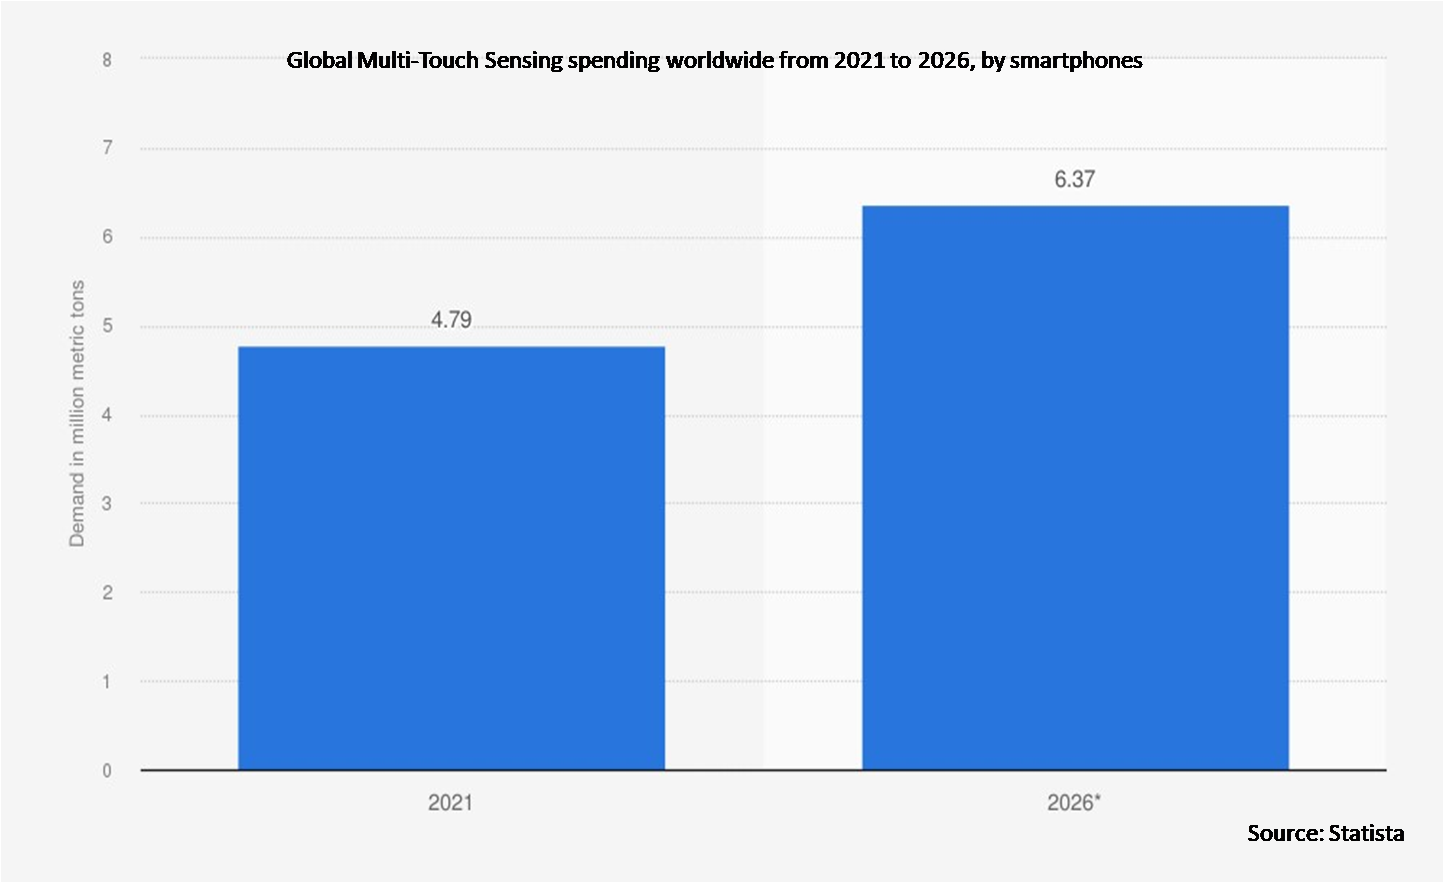
The smartphones segment is expected to be the largest during the forecast period
The smartphones segment is estimated to have a lucrative growth. Multi-Touch Sensing technology has revolutionized smartphones by enabling users to interact with their devices through intuitive touch gestures. It allows for the recognition of multiple touch points on a screen simultaneously, facilitating gestures like pinch-to-zoom and swipe navigation. This technology enhances user experience, making smartphones more user-friendly and responsive. Multi-Touch sensing solutions improved accuracy, speed, and support for various gestures, contributing to the seamless and interactive nature of modern smartphone interfaces.
The self-service terminals segment is expected to have the highest CAGR during the forecast period
The self-service terminals segment is anticipated to witness the highest CAGR growth during the forecast period, due to its pivotal role in enhancing user experiences. These terminals, including kiosks and ATMs, benefit from advanced touch interfaces, allowing users to interact intuitively and efficiently. Multi-Touch Sensing facilitates seamless navigation, faster transaction processing, and improved accessibility. The integration of this technology in SSTs optimizes user engagement, reduces transaction times, and enhances overall operational efficiency.
Region with largest share:
Asia Pacific is projected to hold the largest market share during the forecast period owing to the rising demand for interactive technologies in consumer electronics, automotive, and industrial applications. Increased adoption of smartphones, tablets, and touch-enabled devices, coupled with advancements in touch sensing technology, is driving market expansion. Key players are focusing on innovation and product development to cater to diverse industry needs. The Asia-Pacific Multi-Touch Sensing market is poised for continued expansion as industries embrace touch-based interfaces, creating new opportunities for market players in this dynamic and rapidly evolving technological landscape.
Region with highest CAGR:
North America is projected to have the highest CAGR over the forecast period, owing to the robust demand across sectors like consumer electronics, healthcare, and education. The widespread adoption of touch-enabled devices, such as smartphones and tablets, is a key driver, fostering innovation and technological advancements in touch sensing solutions. Companies are actively investing in research and development to stay competitive in this dynamic market. The region's tech-savvy consumers and industries' increasing emphasis on interactive technologies contribute to the sustained growth of the Multi-Touch Sensing market in North America, presenting lucrative opportunities for industry stakeholders.

Key players in the market
Some of the key players profiled in the Multi-Touch Sensing Market include Synaptics Incorporated, Cypress Semiconductor Corporation, NXP Semiconductors, Texas Instruments Incorporated, STMicroelectronics, Atmel Corporation, Microsoft Corporation, Apple Inc, ViewSonic Corporation, Samsung Electronics Limited, LG Display Limited, The 3M Company, Fujitsu Limited, Sharp Corporation, Planar Systems Inc, TouchNetix Limited, Zytronic PLC and Displax Interactive Systems.
Key Developments:
In June 2022, TouchNetix introduced the latest addition to the aXiom family of HMI chips with the release of a pure Force-Sensing chip – the AX54A-Force. This is a perfect small-sized chip to complement smart touch surfaces, touch button clusters and other solutions where touch functionality is integrated.
In November 2020, ViewSonic Corp., a leading global provider of visual solutions, announced the new vTouch driver for ViewSonic TD series touch monitor now enables all macOS users using touch and gesture controls. TD Series owners could easily install ViewSonic’s vTouch by downloading the driver at ViewSonic website. This new driver works across the entire TD series.
Products Covered:
• Smartphones
• Tablets
• Personal Computers & Laptops
• Kiosks
• Other Products
Technologies Covered:
• Capacitive Touch
• Resistive Touch
• Infrared Touch
• Optical Touch
• Surface Acoustic Wave (SAW) Touch
• Projected Capacitive Touch (PCT)
• Mutual Capacitance
• Self-Capacitance
• Other Technologies
Applications Covered:
• Digital Signage
• Gaming Consoles
• Interactive Displays
• Self-Service Terminals
• Medical Devices
• Other Applications
End Users Covered:
• Smart Home
• Aerospace
• Retail
• Industrial
• Entertainment
• Other End Users
Regions Covered:
• North America
o US
o Canada
o Mexico
• Europe
o Germany
o UK
o Italy
o France
o Spain
o Rest of Europe
• Asia Pacific
o Japan
o China
o India
o Australia
o New Zealand
o South Korea
o Rest of Asia Pacific
• South America
o Argentina
o Brazil
o Chile
o Rest of South America
• Middle East & Africa
o Saudi Arabia
o UAE
o Qatar
o South Africa
o Rest of Middle East & Africa
What our report offers:
- Market share assessments for the regional and country-level segments
- Strategic recommendations for the new entrants
- Covers Market data for the years 2021, 2022, 2023, 2026, and 2030
- Market Trends (Drivers, Constraints, Opportunities, Threats, Challenges, Investment Opportunities, and recommendations)
- Strategic recommendations in key business segments based on the market estimations
- Competitive landscaping mapping the key common trends
- Company profiling with detailed strategies, financials, and recent developments
- Supply chain trends mapping the latest technological advancements
Free Customization Offerings:
All the customers of this report will be entitled to receive one of the following free customization options:
• Company Profiling
o Comprehensive profiling of additional market players (up to 3)
o SWOT Analysis of key players (up to 3)
• Regional Segmentation
o Market estimations, Forecasts and CAGR of any prominent country as per the client's interest (Note: Depends on feasibility check)
• Competitive Benchmarking
o Benchmarking of key players based on product portfolio, geographical presence, and strategic alliances
Table of Contents
1 Executive Summary
2 Preface
2.1 Abstract
2.2 Stake Holders
2.3 Research Scope
2.4 Research Methodology
2.4.1 Data Mining
2.4.2 Data Analysis
2.4.3 Data Validation
2.4.4 Research Approach
2.5 Research Sources
2.5.1 Primary Research Sources
2.5.2 Secondary Research Sources
2.5.3 Assumptions
3 Market Trend Analysis
3.1 Introduction
3.2 Drivers
3.3 Restraints
3.4 Opportunities
3.5 Threats
3.6 Product Analysis
3.7 Technology Analysis
3.8 Application Analysis
3.9 End User Analysis
3.10 Emerging Markets
3.11 Impact of Covid-19
4 Porters Five Force Analysis
4.1 Bargaining power of suppliers
4.2 Bargaining power of buyers
4.3 Threat of substitutes
4.4 Threat of new entrants
4.5 Competitive rivalry
5 Global Multi-Touch Sensing Market, By Product
5.1 Introduction
5.2 Smartphones
5.3 Tablets
5.4 Personal Computers & Laptops
5.5 Kiosks
5.6 Other Products
6 Global Multi-Touch Sensing Market, By Technology
6.1 Introduction
6.2 Capacitive Touch
6.3 Resistive Touch
6.4 Infrared Touch
6.5 Optical Touch
6.6 Surface Acoustic Wave (SAW) Touch
6.7 Projected Capacitive Touch (PCT)
6.8 Mutual Capacitance
6.9 Self-Capacitance
6.10 Other Technologies
7 Global Multi-Touch Sensing Market, By Application
7.1 Introduction
7.2 Digital Signage
7.3 Gaming Consoles
7.4 Interactive Displays
7.5 Self-Service Terminals
7.6 Medical Devices
7.7 Other Applications
8 Global Multi-Touch Sensing Market, By End User
8.1 Introduction
8.2 Smart Home
8.3 Aerospace
8.4 Retail
8.5 Industrial
8.6 Entertainment
8.7 Other End Users
9 Global Multi-Touch Sensing Market, By Geography
9.1 Introduction
9.2 North America
9.2.1 US
9.2.2 Canada
9.2.3 Mexico
9.3 Europe
9.3.1 Germany
9.3.2 UK
9.3.3 Italy
9.3.4 France
9.3.5 Spain
9.3.6 Rest of Europe
9.4 Asia Pacific
9.4.1 Japan
9.4.2 China
9.4.3 India
9.4.4 Australia
9.4.5 New Zealand
9.4.6 South Korea
9.4.7 Rest of Asia Pacific
9.5 South America
9.5.1 Argentina
9.5.2 Brazil
9.5.3 Chile
9.5.4 Rest of South America
9.6 Middle East & Africa
9.6.1 Saudi Arabia
9.6.2 UAE
9.6.3 Qatar
9.6.4 South Africa
9.6.5 Rest of Middle East & Africa
10 Key Developments
10.1 Agreements, Partnerships, Collaborations and Joint Ventures
10.2 Acquisitions & Mergers
10.3 New Product Launch
10.4 Expansions
10.5 Other Key Strategies
11 Company Profiling
11.1 Synaptics Incorporated
11.2 Cypress Semiconductor Corporation
11.3 NXP Semiconductors
11.4 Texas Instruments Incorporated
11.5 STMicroelectronics
11.6 Atmel Corporation
11.7 Microsoft Corporation
11.8 Apple Inc
11.9 ViewSonic Corporation
11.10 Samsung Electronics Limited
11.11 LG Display Limited
11.12 The 3M Company
11.13 Fujitsu Limited
11.14 Sharp Corporation
11.15 Planar Systems Inc
11.16 TouchNetix Limited
11.17 Zytronic PLC
11.18 Displax Interactive Systems
List of Tables
1 Global Multi-Touch Sensing Market Outlook, By Region (2021-2030) ($MN)
2 Global Multi-Touch Sensing Market Outlook, By Product (2021-2030) ($MN)
3 Global Multi-Touch Sensing Market Outlook, By Smartphones (2021-2030) ($MN)
4 Global Multi-Touch Sensing Market Outlook, By Tablets (2021-2030) ($MN)
5 Global Multi-Touch Sensing Market Outlook, By Personal Computers & Laptops (2021-2030) ($MN)
6 Global Multi-Touch Sensing Market Outlook, By Kiosks (2021-2030) ($MN)
7 Global Multi-Touch Sensing Market Outlook, By Other Products (2021-2030) ($MN)
8 Global Multi-Touch Sensing Market Outlook, By Technology (2021-2030) ($MN)
9 Global Multi-Touch Sensing Market Outlook, By Capacitive Touch (2021-2030) ($MN)
10 Global Multi-Touch Sensing Market Outlook, By Resistive Touch (2021-2030) ($MN)
11 Global Multi-Touch Sensing Market Outlook, By Infrared Touch (2021-2030) ($MN)
12 Global Multi-Touch Sensing Market Outlook, By Optical Touch (2021-2030) ($MN)
13 Global Multi-Touch Sensing Market Outlook, By Surface Acoustic Wave (SAW) Touch (2021-2030) ($MN)
14 Global Multi-Touch Sensing Market Outlook, By Projected Capacitive Touch (PCT) (2021-2030) ($MN)
15 Global Multi-Touch Sensing Market Outlook, By Mutual Capacitance (2021-2030) ($MN)
16 Global Multi-Touch Sensing Market Outlook, By Self-Capacitance (2021-2030) ($MN)
17 Global Multi-Touch Sensing Market Outlook, By Other Technologies (2021-2030) ($MN)
18 Global Multi-Touch Sensing Market Outlook, By Application (2021-2030) ($MN)
19 Global Multi-Touch Sensing Market Outlook, By Digital Signage (2021-2030) ($MN)
20 Global Multi-Touch Sensing Market Outlook, By Gaming Consoles (2021-2030) ($MN)
21 Global Multi-Touch Sensing Market Outlook, By Interactive Displays (2021-2030) ($MN)
22 Global Multi-Touch Sensing Market Outlook, By Self-Service Terminals (2021-2030) ($MN)
23 Global Multi-Touch Sensing Market Outlook, By Medical Devices (2021-2030) ($MN)
24 Global Multi-Touch Sensing Market Outlook, By Other Applications (2021-2030) ($MN)
25 Global Multi-Touch Sensing Market Outlook, By End User (2021-2030) ($MN)
26 Global Multi-Touch Sensing Market Outlook, By Smart Home (2021-2030) ($MN)
27 Global Multi-Touch Sensing Market Outlook, By Aerospace (2021-2030) ($MN)
28 Global Multi-Touch Sensing Market Outlook, By Retail (2021-2030) ($MN)
29 Global Multi-Touch Sensing Market Outlook, By Industrial (2021-2030) ($MN)
30 Global Multi-Touch Sensing Market Outlook, By Entertainment (2021-2030) ($MN)
31 Global Multi-Touch Sensing Market Outlook, By Other End Users (2021-2030) ($MN)
Note: Tables for North America, Europe, APAC, South America, and Middle East & Africa Regions are also represented in the same manner as above.
List of Figures
RESEARCH METHODOLOGY

We at ‘Stratistics’ opt for an extensive research approach which involves data mining, data validation, and data analysis. The various research sources include in-house repository, secondary research, competitor’s sources, social media research, client internal data, and primary research.
Our team of analysts prefers the most reliable and authenticated data sources in order to perform the comprehensive literature search. With access to most of the authenticated data bases our team highly considers the best mix of information through various sources to obtain extensive and accurate analysis.
Each report takes an average time of a month and a team of 4 industry analysts. The time may vary depending on the scope and data availability of the desired market report. The various parameters used in the market assessment are standardized in order to enhance the data accuracy.
Data Mining
The data is collected from several authenticated, reliable, paid and unpaid sources and is filtered depending on the scope & objective of the research. Our reports repository acts as an added advantage in this procedure. Data gathering from the raw material suppliers, distributors and the manufacturers is performed on a regular basis, this helps in the comprehensive understanding of the products value chain. Apart from the above mentioned sources the data is also collected from the industry consultants to ensure the objective of the study is in the right direction.
Market trends such as technological advancements, regulatory affairs, market dynamics (Drivers, Restraints, Opportunities and Challenges) are obtained from scientific journals, market related national & international associations and organizations.
Data Analysis
From the data that is collected depending on the scope & objective of the research the data is subjected for the analysis. The critical steps that we follow for the data analysis include:
- Product Lifecycle Analysis
- Competitor analysis
- Risk analysis
- Porters Analysis
- PESTEL Analysis
- SWOT Analysis
The data engineering is performed by the core industry experts considering both the Marketing Mix Modeling and the Demand Forecasting. The marketing mix modeling makes use of multiple-regression techniques to predict the optimal mix of marketing variables. Regression factor is based on a number of variables and how they relate to an outcome such as sales or profits.
Data Validation
The data validation is performed by the exhaustive primary research from the expert interviews. This includes telephonic interviews, focus groups, face to face interviews, and questionnaires to validate our research from all aspects. The industry experts we approach come from the leading firms, involved in the supply chain ranging from the suppliers, distributors to the manufacturers and consumers so as to ensure an unbiased analysis.
We are in touch with more than 15,000 industry experts with the right mix of consultants, CEO's, presidents, vice presidents, managers, experts from both supply side and demand side, executives and so on.
The data validation involves the primary research from the industry experts belonging to:
- Leading Companies
- Suppliers & Distributors
- Manufacturers
- Consumers
- Industry/Strategic Consultants
Apart from the data validation the primary research also helps in performing the fill gap research, i.e. providing solutions for the unmet needs of the research which helps in enhancing the reports quality.
For more details about research methodology, kindly write to us at info@strategymrc.com
Frequently Asked Questions
In case of any queries regarding this report, you can contact the customer service by filing the “Inquiry Before Buy” form available on the right hand side. You may also contact us through email: info@strategymrc.com or phone: +1-301-202-5929
Yes, the samples are available for all the published reports. You can request them by filling the “Request Sample” option available in this page.
Yes, you can request a sample with your specific requirements. All the customized samples will be provided as per the requirement with the real data masked.
All our reports are available in Digital PDF format. In case if you require them in any other formats, such as PPT, Excel etc you can submit a request through “Inquiry Before Buy” form available on the right hand side. You may also contact us through email: info@strategymrc.com or phone: +1-301-202-5929
We offer a free 15% customization with every purchase. This requirement can be fulfilled for both pre and post sale. You may send your customization requirements through email at info@strategymrc.com or call us on +1-301-202-5929.
We have 3 different licensing options available in electronic format.
- Single User Licence: Allows one person, typically the buyer, to have access to the ordered product. The ordered product cannot be distributed to anyone else.
- 2-5 User Licence: Allows the ordered product to be shared among a maximum of 5 people within your organisation.
- Corporate License: Allows the product to be shared among all employees of your organisation regardless of their geographical location.
All our reports are typically be emailed to you as an attachment.
To order any available report you need to register on our website. The payment can be made either through CCAvenue or PayPal payments gateways which accept all international cards.
We extend our support to 6 months post sale. A post sale customization is also provided to cover your unmet needs in the report.
Request Customization
We offer complimentary customization of up to 15% with every purchase. To share your customization requirements, feel free to email us at info@strategymrc.com or call us on +1-301-202-5929. .
Please Note: Customization within the 15% threshold is entirely free of charge. If your request exceeds this limit, we will conduct a feasibility assessment. Following that, a detailed quote and timeline will be provided.
WHY CHOOSE US ?

Assured Quality
Best in class reports with high standard of research integrity

24X7 Research Support
Continuous support to ensure the best customer experience.

Free Customization
Adding more values to your product of interest.

Safe & Secure Access
Providing a secured environment for all online transactions.

Trusted by 600+ Brands
Serving the most reputed brands across the world.