
Native Collagen Market
Native Collagen Market Forecasts to 2030 - Global Analysis By Type (Type I Collagen, Type II Collagen, Type III Collagen and Other Types), By Source (Bovine, Marine, Porcine, Poultry and Other Sources) Application and By Geography

|
Years Covered |
2021-2030 |
|
Estimated Year Value (2023) |
US $205.07 MN |
|
Projected Year Value (2030) |
US $312.4 MN |
|
CAGR (2023-2030) |
6.2% |
|
Regions Covered |
North America, Europe, Asia Pacific, South America, and Middle East & Africa |
|
Countries Covered |
US, Canada, Mexico, Germany, UK, Italy, France, Spain, Japan, China, India, Australia, New Zealand, South Korea, Rest of Asia Pacific, South America, Argentina, Brazil, Chile, Middle East & Africa, Saudi Arabia, UAE, Qatar, and South Africa |
|
Largest Market |
Asia Pacific |
|
Highest Growing Market |
Europe |
According to Stratistics MRC, the Global Native Collagen Market is accounted for $205.07 million in 2023 and is expected to reach $312.4 million by 2030 growing at a CAGR of 6.2% during the forecast period. Native collagen refers to collagen protein extracted from natural sources such as animal tissues, typically of bovine or marine origin, in its unaltered and unhydrolyzed form. It retains its original molecular structure and bioactive properties, making it highly compatible with the human body. Native collagen is widely used in skincare, wound healing, and dietary supplements for its potential to promote collagen synthesis and tissue regeneration.
According to the Centers for Disease Control and Prevention (CDC), National Center for Chronic Disease Prevention and Health Promotion (NCCDPHP), 67 million of the total U.S. population is likely to suffer from arthritis by 2025.
Market Dynamics:
Driver:
Growing anti-aging concerns
With an aging population and increasing awareness about skincare and wellness, there's a heightened demand for collagen-based products to address signs of aging such as wrinkles, fine lines, and sagging skin. Native collagen, known for its natural compatibility with the human body and its ability to improve skin elasticity and hydration, is increasingly sought after in cosmetics and skincare formulations, driving market growth.
Restraint:
High production costs
The extraction and purification processes required to obtain high-quality collagen from natural sources can be intricate and expensive. Additionally, the need for stringent quality control measures further escalates production expenses. These elevated costs impact the final pricing of collagen-based products, making them less competitive compared to synthetic alternatives. Furthermore, the dependency on limited sources of raw materials also contributes to cost fluctuations, posing challenges for manufacturers in the market.
Opportunity:
Increasing investment in research and development for novel collagen extraction methods
By leveraging advancements in technology and biotechnology, researchers can explore more efficient and cost-effective ways to extract collagen from natural sources. These innovations could lead to improved yields, higher purity levels, and reduced production costs, thereby enhancing the overall competitiveness of collagen-based products. Moreover, R&D efforts may uncover novel applications and functionalities of collagen, expanding its potential market reach and driving further growth in the industry.
Threat:
Competition from alternative biomaterials and synthetic substitutes
Synthetic materials offer advantages such as consistent quality, lower production costs, and reduced reliance on natural resources. Additionally, advancements in biotechnology have led to the development of biomimetic materials that mimic the properties of native collagen. These substitutes often provide similar functionalities at a lower price point, posing a challenge for native collagen products to maintain market share and pricing competitiveness, especially in industries like cosmetics, pharmaceuticals, and medical devices.
Covid-19 Impact:
The COVID-19 pandemic has had a mixed impact on the native collagen market. While there has been increased demand for collagen-based products in the healthcare sector, particularly for wound care and tissue regeneration applications, disruptions in the supply chain, reduced consumer spending, and shifting priorities have adversely affected market growth. However, the market is expected to rebound as economies recover and demand for collagen products resumes.
The food & beverages segment is expected to be the largest during the forecast period
The food and beverages segment is anticipated to emerge as the largest during the forecast period in the native collagen market. This growth is attributed to the rising demand for collagen-infused products, including functional beverages, snacks, and supplements, driven by consumers' growing awareness of collagen's health benefits. Additionally, manufacturers' efforts to incorporate collagen into various food and beverage formulations to enhance nutritional value and promote skin health contribute to the segment's dominance in the market landscape.
The type I collagen segment is expected to have the highest CAGR during the forecast period
The type I collagen segment is anticipated to exhibit the highest growth rate during the forecast period in the native collagen market. This growth is attributed to the widespread applications of type I collagen in various industries, including pharmaceuticals, cosmetics, and regenerative medicine. Type I collagen is abundant in nature and possesses excellent biocompatibility and bioactivity, making it highly sought after for wound healing, tissue engineering, and cosmetic formulations, thus driving its market growth trajectory.
Region with largest share:
Asia Pacific is poised to maintain its dominance in the native collagen market owing to the region's large consumer base and increasing disposable incomes, driving demand for collagen-based products in the cosmetics, healthcare, and food industries. Moreover, growing awareness of the benefits of native collagen and the presence of key market players investing in research and development further contribute to Asia Pacific's market leadership. Additionally, favorable government initiatives and expanding distribution networks bolster market growth in the region.
Region with highest CAGR:
Europe is positioned for rapid growth in the native collagen market. The region boasts a robust healthcare infrastructure and a growing aging population, driving demand for collagen-based medical products and supplements. Additionally, stringent regulations favoring natural and biocompatible materials contribute to market expansion. Moreover, increasing consumer awareness about the benefits of native collagen in skincare and personal care products further stimulates market growth, making Europe a promising region for investment and market expansion.

Key players in the market
Some of the key players in Native Collagen Market include Bioiberica, Chinapeptide, Collagen Matrix, Inc., Collagen Solutions Plc, Ewald-Gelatine GmbH, GELITA AG, GELNEX, Hangzhou Nutrition Biotechnology Co., Ltd., Italgelatine S.p.A., Jellatech, Juncà Gelatines, S.L., Narmada Gelatines Ltd., Nippi Collagen, Nitta Gelatin Inc., PB Gelatins (PB Leiner), Rousselot, Symatese, Tessenderlo Group, Trobas Gelatine B.V. and Vinh Hoan Corporation.
Key Developments:
In September 2023, On the back of an oversubscribed $3.5 million seed round, cell-cultured collagen startup Jellatech plans to serve the high-value, low-volume biomedical market with its bio-identical human collagen before entering the food and drink space, says its chief scientific officer (CSO), Rob Schutte. The startup recently closed an oversubscribed seed funding round in which it raised $3.5 million, led by Nordic-based byFounders, with additional investment from Milano Investment Partners, Joyful VC, Siddhi Capital, Blustein, and more.
In June 2022, Jellatech reveals a major milestone in its mission to eliminate animals from the food system, starting with collagen and gelatin: after just two years of existence, the North Carolina team announces the successful development of a full-length, triple helical and functional collagen made from its own proprietary cell lines.
Types Covered:
• Type I Collagen
• Type II Collagen
• Type III Collagen
• Other Types
Sources Covered:
• Bovine
• Marine
• Porcine
• Poultry
• Other Sources
Applications Covered:
• Food & Beverages
• Nutraceuticals & Dietary Supplements
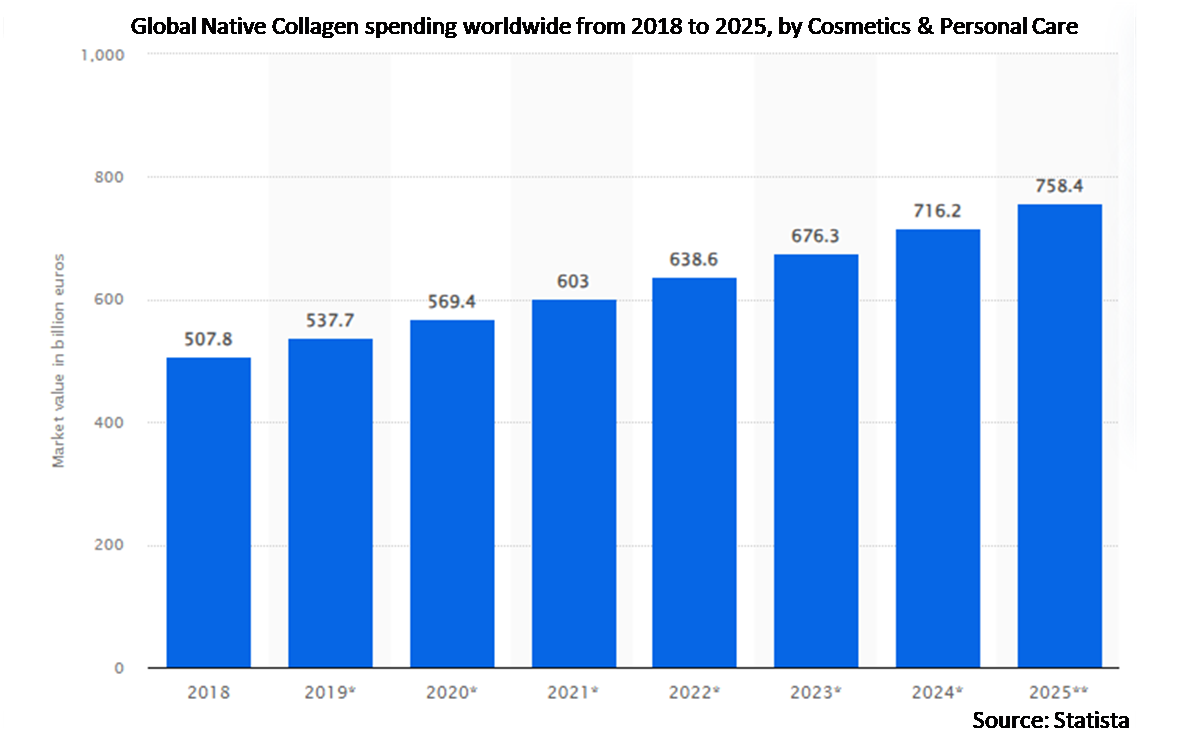
• Cosmetics & Personal Care
• Medical
Regions Covered:
• North America
o US
o Canada
o Mexico
• Europe
o Germany
o UK
o Italy
o France
o Spain
o Rest of Europe
• Asia Pacific
o Japan
o China
o India
o Australia
o New Zealand
o South Korea
o Rest of Asia Pacific
• South America
o Argentina
o Brazil
o Chile
o Rest of South America
• Middle East & Africa
o Saudi Arabia
o UAE
o Qatar
o South Africa
o Rest of Middle East & Africa
What our report offers:
- Market share assessments for the regional and country-level segments
- Strategic recommendations for the new entrants
- Covers Market data for the years 2021, 2022, 2023, 2026, and 2030
- Market Trends (Drivers, Constraints, Opportunities, Threats, Challenges, Investment Opportunities, and recommendations)
- Strategic recommendations in key business segments based on the market estimations
- Competitive landscaping mapping the key common trends
- Company profiling with detailed strategies, financials, and recent developments
- Supply chain trends mapping the latest technological advancements
Free Customization Offerings:
All the customers of this report will be entitled to receive one of the following free customization options:
• Company Profiling
o Comprehensive profiling of additional market players (up to 3)
o SWOT Analysis of key players (up to 3)
• Regional Segmentation
o Market estimations, Forecasts and CAGR of any prominent country as per the client's interest (Note: Depends on feasibility check)
• Competitive Benchmarking
Benchmarking of key players based on product portfolio, geographical presence, and strategic alliances
Table of Contents
1 Executive Summary
2 Preface
2.1 Abstract
2.2 Stake Holders
2.3 Research Scope
2.4 Research Methodology
2.4.1 Data Mining
2.4.2 Data Analysis
2.4.3 Data Validation
2.4.4 Research Approach
2.5 Research Sources
2.5.1 Primary Research Sources
2.5.2 Secondary Research Sources
2.5.3 Assumptions
3 Market Trend Analysis
3.1 Introduction
3.2 Drivers
3.3 Restraints
3.4 Opportunities
3.5 Threats
3.6 Application Analysis
3.7 Emerging Markets
3.8 Impact of Covid-19
4 Porters Five Force Analysis
4.1 Bargaining power of suppliers
4.2 Bargaining power of buyers
4.3 Threat of substitutes
4.4 Threat of new entrants
4.5 Competitive rivalry
5 Global Native Collagen Market, By Type
5.1 Introduction
5.2 Type I Collagen
5.3 Type II Collagen
5.4 Type III Collagen
5.5 Other Types
6 Global Native Collagen Market, By Source
6.1 Introduction
6.2 Bovine
6.3 Marine
6.4 Porcine
6.5 Poultry
6.6 Other Sources
7 Global Native Collagen Market, By Application
7.1 Introduction
7.2 Food & Beverages
7.2.1 Bakery Products
7.2.2 Confectionery
7.2.3 Dairy Products
7.2.4 Functional Food & Beverages
7.2.5 Other Food & Beverage Applications
7.3 Nutraceuticals & Dietary Supplements
7.3.1 Joint Health Supplements
7.3.2 Skin Health Supplements
7.3.3 Sports Nutrition Products
7.3.4 Other Nutraceutical Applications
7.4 Cosmetics & Personal Care
7.4.1 Anti-Aging Products
7.4.2 Hair Care Products
7.4.3 Moisturizers & Serums
7.4.5 Other Cosmetic & Personal Care Applications
7.5 Medical
7.5.1 Bone Regeneration
7.5.2 Tissue Engineering
7.5.3 Wound Dressings & Healing
7.5.4 Other Medical Applications
8 Global Native Collagen Market, By Geography
8.1 Introduction
8.2 North America
8.2.1 US
8.2.2 Canada
8.2.3 Mexico
8.3 Europe
8.3.1 Germany
8.3.2 UK
8.3.3 Italy
8.3.4 France
8.3.5 Spain
8.3.6 Rest of Europe
8.4 Asia Pacific
8.4.1 Japan
8.4.2 China
8.4.3 India
8.4.4 Australia
8.4.5 New Zealand
8.4.6 South Korea
8.4.7 Rest of Asia Pacific
8.5 South America
8.5.1 Argentina
8.5.2 Brazil
8.5.3 Chile
8.5.4 Rest of South America
8.6 Middle East & Africa
8.6.1 Saudi Arabia
8.6.2 UAE
8.6.3 Qatar
8.6.4 South Africa
8.6.5 Rest of Middle East & Africa
9 Key Developments
9.1 Agreements, Partnerships, Collaborations and Joint Ventures
9.2 Acquisitions & Mergers
9.3 New Product Launch
9.4 Expansions
9.5 Other Key Strategies
10 Company Profiling
10.1 Bioiberica
10.2 Chinapeptide
10.3 Collagen Matrix, Inc.
10.4 Collagen Solutions Plc
10.5 Ewald-Gelatine GmbH
10.6 GELITA AG
10.7 GELNEX
10.8 Hangzhou Nutrition Biotechnology Co., Ltd.
10.9 Italgelatine S.p.A.
10.10 Jellatech
10.11 Juncà Gelatines, S.L.
10.12 Narmada Gelatines Ltd.
10.13 Nippi Collagen
10.14 Nitta Gelatin Inc.
10.15 PB Gelatins (PB Leiner)
10.16 Rousselot
10.17 Symatese
10.18 Tessenderlo Group
10.19 Trobas Gelatine B.V.
10.20 Vinh Hoan Corporation
List of Tables
1 Global Native Collagen Market Outlook, By Region (2021-2030) ($MN)
2 Global Native Collagen Market Outlook, By Type (2021-2030) ($MN)
3 Global Native Collagen Market Outlook, By Type I Collagen (2021-2030) ($MN)
4 Global Native Collagen Market Outlook, By Type II Collagen (2021-2030) ($MN)
5 Global Native Collagen Market Outlook, By Type III Collagen (2021-2030) ($MN)
6 Global Native Collagen Market Outlook, By Other Types (2021-2030) ($MN)
7 Global Native Collagen Market Outlook, By Source (2021-2030) ($MN)
8 Global Native Collagen Market Outlook, By Bovine (2021-2030) ($MN)
9 Global Native Collagen Market Outlook, By Marine (2021-2030) ($MN)
10 Global Native Collagen Market Outlook, By Porcine (2021-2030) ($MN)
11 Global Native Collagen Market Outlook, By Poultry (2021-2030) ($MN)
12 Global Native Collagen Market Outlook, By Other Sources (2021-2030) ($MN)
13 Global Native Collagen Market Outlook, By Application (2021-2030) ($MN)
14 Global Native Collagen Market Outlook, By Food & Beverages (2021-2030) ($MN)
15 Global Native Collagen Market Outlook, By Bakery Products (2021-2030) ($MN)
16 Global Native Collagen Market Outlook, By Confectionery (2021-2030) ($MN)
17 Global Native Collagen Market Outlook, By Dairy Products (2021-2030) ($MN)
18 Global Native Collagen Market Outlook, By Functional Food & Beverages (2021-2030) ($MN)
19 Global Native Collagen Market Outlook, By Other Food & Beverage Applications (2021-2030) ($MN)
20 Global Native Collagen Market Outlook, By Nutraceuticals & Dietary Supplements (2021-2030) ($MN)
21 Global Native Collagen Market Outlook, By Joint Health Supplements (2021-2030) ($MN)
22 Global Native Collagen Market Outlook, By Skin Health Supplements (2021-2030) ($MN)
23 Global Native Collagen Market Outlook, By Sports Nutrition Products (2021-2030) ($MN)
24 Global Native Collagen Market Outlook, By Other Nutraceutical Applications (2021-2030) ($MN)
25 Global Native Collagen Market Outlook, By Cosmetics & Personal Care (2021-2030) ($MN)
26 Global Native Collagen Market Outlook, By Anti-Aging Products (2021-2030) ($MN)
27 Global Native Collagen Market Outlook, By Hair Care Products (2021-2030) ($MN)
28 Global Native Collagen Market Outlook, By Moisturizers & Serums (2021-2030) ($MN)
29 Global Native Collagen Market Outlook, By Other Cosmetic & Personal Care Applications (2021-2030) ($MN)
30 Global Native Collagen Market Outlook, By Medical (2021-2030) ($MN)
31 Global Native Collagen Market Outlook, By Bone Regeneration (2021-2030) ($MN)
32 Global Native Collagen Market Outlook, By Tissue Engineering (2021-2030) ($MN)
33 Global Native Collagen Market Outlook, By Wound Dressings & Healing (2021-2030) ($MN)
34 Global Native Collagen Market Outlook, By Other Medical Applications (2021-2030) ($MN)
Note: Tables for North America, Europe, APAC, South America, and Middle East & Africa Regions are also represented in the same manner as above.
List of Figures
RESEARCH METHODOLOGY

We at ‘Stratistics’ opt for an extensive research approach which involves data mining, data validation, and data analysis. The various research sources include in-house repository, secondary research, competitor’s sources, social media research, client internal data, and primary research.
Our team of analysts prefers the most reliable and authenticated data sources in order to perform the comprehensive literature search. With access to most of the authenticated data bases our team highly considers the best mix of information through various sources to obtain extensive and accurate analysis.
Each report takes an average time of a month and a team of 4 industry analysts. The time may vary depending on the scope and data availability of the desired market report. The various parameters used in the market assessment are standardized in order to enhance the data accuracy.
Data Mining
The data is collected from several authenticated, reliable, paid and unpaid sources and is filtered depending on the scope & objective of the research. Our reports repository acts as an added advantage in this procedure. Data gathering from the raw material suppliers, distributors and the manufacturers is performed on a regular basis, this helps in the comprehensive understanding of the products value chain. Apart from the above mentioned sources the data is also collected from the industry consultants to ensure the objective of the study is in the right direction.
Market trends such as technological advancements, regulatory affairs, market dynamics (Drivers, Restraints, Opportunities and Challenges) are obtained from scientific journals, market related national & international associations and organizations.
Data Analysis
From the data that is collected depending on the scope & objective of the research the data is subjected for the analysis. The critical steps that we follow for the data analysis include:
- Product Lifecycle Analysis
- Competitor analysis
- Risk analysis
- Porters Analysis
- PESTEL Analysis
- SWOT Analysis
The data engineering is performed by the core industry experts considering both the Marketing Mix Modeling and the Demand Forecasting. The marketing mix modeling makes use of multiple-regression techniques to predict the optimal mix of marketing variables. Regression factor is based on a number of variables and how they relate to an outcome such as sales or profits.
Data Validation
The data validation is performed by the exhaustive primary research from the expert interviews. This includes telephonic interviews, focus groups, face to face interviews, and questionnaires to validate our research from all aspects. The industry experts we approach come from the leading firms, involved in the supply chain ranging from the suppliers, distributors to the manufacturers and consumers so as to ensure an unbiased analysis.
We are in touch with more than 15,000 industry experts with the right mix of consultants, CEO's, presidents, vice presidents, managers, experts from both supply side and demand side, executives and so on.
The data validation involves the primary research from the industry experts belonging to:
- Leading Companies
- Suppliers & Distributors
- Manufacturers
- Consumers
- Industry/Strategic Consultants
Apart from the data validation the primary research also helps in performing the fill gap research, i.e. providing solutions for the unmet needs of the research which helps in enhancing the reports quality.
For more details about research methodology, kindly write to us at info@strategymrc.com
Frequently Asked Questions
In case of any queries regarding this report, you can contact the customer service by filing the “Inquiry Before Buy” form available on the right hand side. You may also contact us through email: info@strategymrc.com or phone: +1-301-202-5929
Yes, the samples are available for all the published reports. You can request them by filling the “Request Sample” option available in this page.
Yes, you can request a sample with your specific requirements. All the customized samples will be provided as per the requirement with the real data masked.
All our reports are available in Digital PDF format. In case if you require them in any other formats, such as PPT, Excel etc you can submit a request through “Inquiry Before Buy” form available on the right hand side. You may also contact us through email: info@strategymrc.com or phone: +1-301-202-5929
We offer a free 15% customization with every purchase. This requirement can be fulfilled for both pre and post sale. You may send your customization requirements through email at info@strategymrc.com or call us on +1-301-202-5929.
We have 3 different licensing options available in electronic format.
- Single User Licence: Allows one person, typically the buyer, to have access to the ordered product. The ordered product cannot be distributed to anyone else.
- 2-5 User Licence: Allows the ordered product to be shared among a maximum of 5 people within your organisation.
- Corporate License: Allows the product to be shared among all employees of your organisation regardless of their geographical location.
All our reports are typically be emailed to you as an attachment.
To order any available report you need to register on our website. The payment can be made either through CCAvenue or PayPal payments gateways which accept all international cards.
We extend our support to 6 months post sale. A post sale customization is also provided to cover your unmet needs in the report.
Request Customization
We offer complimentary customization of up to 15% with every purchase. To share your customization requirements, feel free to email us at info@strategymrc.com or call us on +1-301-202-5929. .
Please Note: Customization within the 15% threshold is entirely free of charge. If your request exceeds this limit, we will conduct a feasibility assessment. Following that, a detailed quote and timeline will be provided.
WHY CHOOSE US ?

Assured Quality
Best in class reports with high standard of research integrity

24X7 Research Support
Continuous support to ensure the best customer experience.

Free Customization
Adding more values to your product of interest.

Safe & Secure Access
Providing a secured environment for all online transactions.

Trusted by 600+ Brands
Serving the most reputed brands across the world.