
Agricultural Micronutrients Market
Agricultural Micronutrients Market Forecasts to 2028 - Global Analysis By Form (Chelated, Non-Chelated and Other Forms), Type (Boron, Molybdenum, Manganese, Iron, Zinc and Other Types), Application, End User and By Geography

|
Years Covered |
2020-2028 |
|
Estimated Year Value (2022) |
US $4.3 BN |
|
Projected Year Value (2028) |
US $7.8 BN |
|
CAGR (2022 - 2028) |
10.4% |
|
Regions Covered |
North America, Europe, Asia Pacific, South America, and Middle East & Africa |
|
Countries Covered |
US, Canada, Mexico, Germany, UK, Italy, France, Spain, Japan, China, India, Australia, New Zealand, South Korea, Rest of Asia Pacific, South America, Argentina, Brazil, Chile, Middle East & Africa, Saudi Arabia, UAE, Qatar, and South Africa |
|
Largest Market |
Asia Pacific |
|
Highest Growing Market |
Asia Pacific |
According to Stratistics MRC, the Global Agricultural Micronutrients Market is accounted for $4.3 billion in 2022 and is expected to reach $7.8 billion by 2028 growing at a CAGR of 10.4% during the forecast period. Agricultural Micronutrients are the essential nutrients derived from the soil. These micronutrients are essential for plant growth. They are boron (B), chloride (Cl), copper (Cu), iron (Fe), manganese (Mn), molybdenum (Mo), nickel (Ni) and zinc (Zn). They help to achieve the production goals and are essential to the growth and development of the plant. Plants require a proper balance of all the essential nutrients. Without these nutrients, plant nutrition would be compromised leading to potential declines in plant productivity.
According to The National Informatics Centre (NIC), India ranks second in agricultural production in the world and is a leading producer of various agricultural commodities, further boosting growth of the agricultural micronutrients market in the country.
Market Dynamics:
Driver:
Increase in micronutrient deficiency in soil
The low portions of micronutrients in plants can lead to diseases in crops. Soils all over the globe are suffering imbalances and deficiencies of micronutrients due to humidity, temperature and soil PH. Even humans are facing malnutrition due to decreasing content of micronutrients. All these factors increased the usage of the micronutrients and therefore propelling the growth of the market.
Restraint:
Lack of application knowledge
Farmers in developing countries lack awareness regarding the dosage and proper application of micronutrients. Farmers are not trained and often do not have access to technology and knowledge regarding farming techniques. Applications such as fertigation, seed treatment and hydroponics are fairly new to some farmers. So, they face issues regarding the application of micronutrients which is hindering the market growth.
Opportunity:
Rising consumption of biofuel
Biofuel is produced in various ways through different types of agricultural plants. These crops include corn, wheat, oilseeds, sugarcane, and many more. Farmers have boosted their biofuel crop output and have turned them to fertilisers to enhance the crop quality. The increased demand for biofuels is driving up the production of bio-crops like sugarcane and increasing worldwide need for agricultural micronutrients and fuelling the market growth.
Threat:
High price rates
Several farmers have reduced the use of micronutrients in their fertilizer program due to high associated prices and their lower income levels. This has caused a reduction and deficiency of micronutrients levels in soil. They need to add these nutrients to prevent the deficiencies. Prices of most micronutrients such as molybdenum, manganese, boron and zinc are higher. This acts as a constraint to market growth.
Covid-19 Impact
The global crisis caused by the COVID-19 pandemic has significantly impacted most industries. Fertilizers and agricultural micronutrients have registered a strong slowdown in sales in the first quarter due to the disturbance in logistics and transportation in many countries. Restrictions on export & import of agriculture micronutrients and raw materials affected the supply chain which strongly impacted the production, sales and operations.
The zinc segment is expected to be the largest during the forecast period
The zinc segment is estimated to have a lucrative growth, due to its wide range of functions in plant growth. Government is raising initiatives towards increasing zinc concentrate in the soil to enhance quantitative and qualitative crop yields. Rising need to meet food security challenges and growing demand for zinc nutritious food due to its health benefits are expected to propel the demand for zinc agriculture micronutrients.
The soil segment is expected to have the highest CAGR during the forecast period
The soil segment is anticipated to witness the fastest CAGR growth during the forecast period, due to its easy and cost-effective application. It gives better results of micronutrients over the other application methods. Most of the farmers from developing economies prefer this method as it takes very limited resources. The lower adoption of the advanced fertilizer applications methods drives the market demand.
Region with largest share:
Asia Pacific is projected to hold the largest market share during the forecast period owing to the huge crop cultivation and growing population. Rising interest in high quality food among consumers has increased awareness of the agriculture micronutrients. This region consumes 90% of the global rice produced. Growing food demand and high usage of fertilizer consumption in this region are driving the market demand.
Region with highest CAGR:
Asia Pacific is projected to have the highest CAGR over the forecast period, owing to the high government subsidies. This region has huge depletion of arable land and vast area of infertile soil. So, government provides subsidies for fertilization and nutrition of crops, sometimes up to 100% for marginal farmers which is fuelling the growth of the market at a rapid pace.

Key players in the market
Some of the key players profiled in the Agricultural Micronutrients Market include BASF SE, Coromandel International Ltd, AkzoNobel, Baicor LC, Balchem, ATP Nutrition, Corteva Inc, Compass Minerals International, BMS Micronutrient NV, Haifa Group, Helena Chemical Company, Sapec SA, Stoller Enterprises Inc, Nutrien Ltd, Bayer AG, Nufarm, The Mosaic Company, Yara International ASA, AgroLiquid, Aries Agro Limited
Key Developments:
In May 2022, Bayer AG has launched Routine Start 280FS, a new seed treatment product to protect early-season rice seeds from rice blast fungi, improving crop productivity and resource efficiency for rice farmers.
In April 2022, BASF launched Exponus® insecticide to deliver powerful, quick & versatile control of toughest insect pests like Caterpillars & Thrips. Exponus® is registered for use on various largely cultivated crops under Oil seeds, Pulses & Vegetables segment to control critical insect pests
Forms Covered:
• Chelated
• Non-Chelated
• Other Forms
Types Covered:
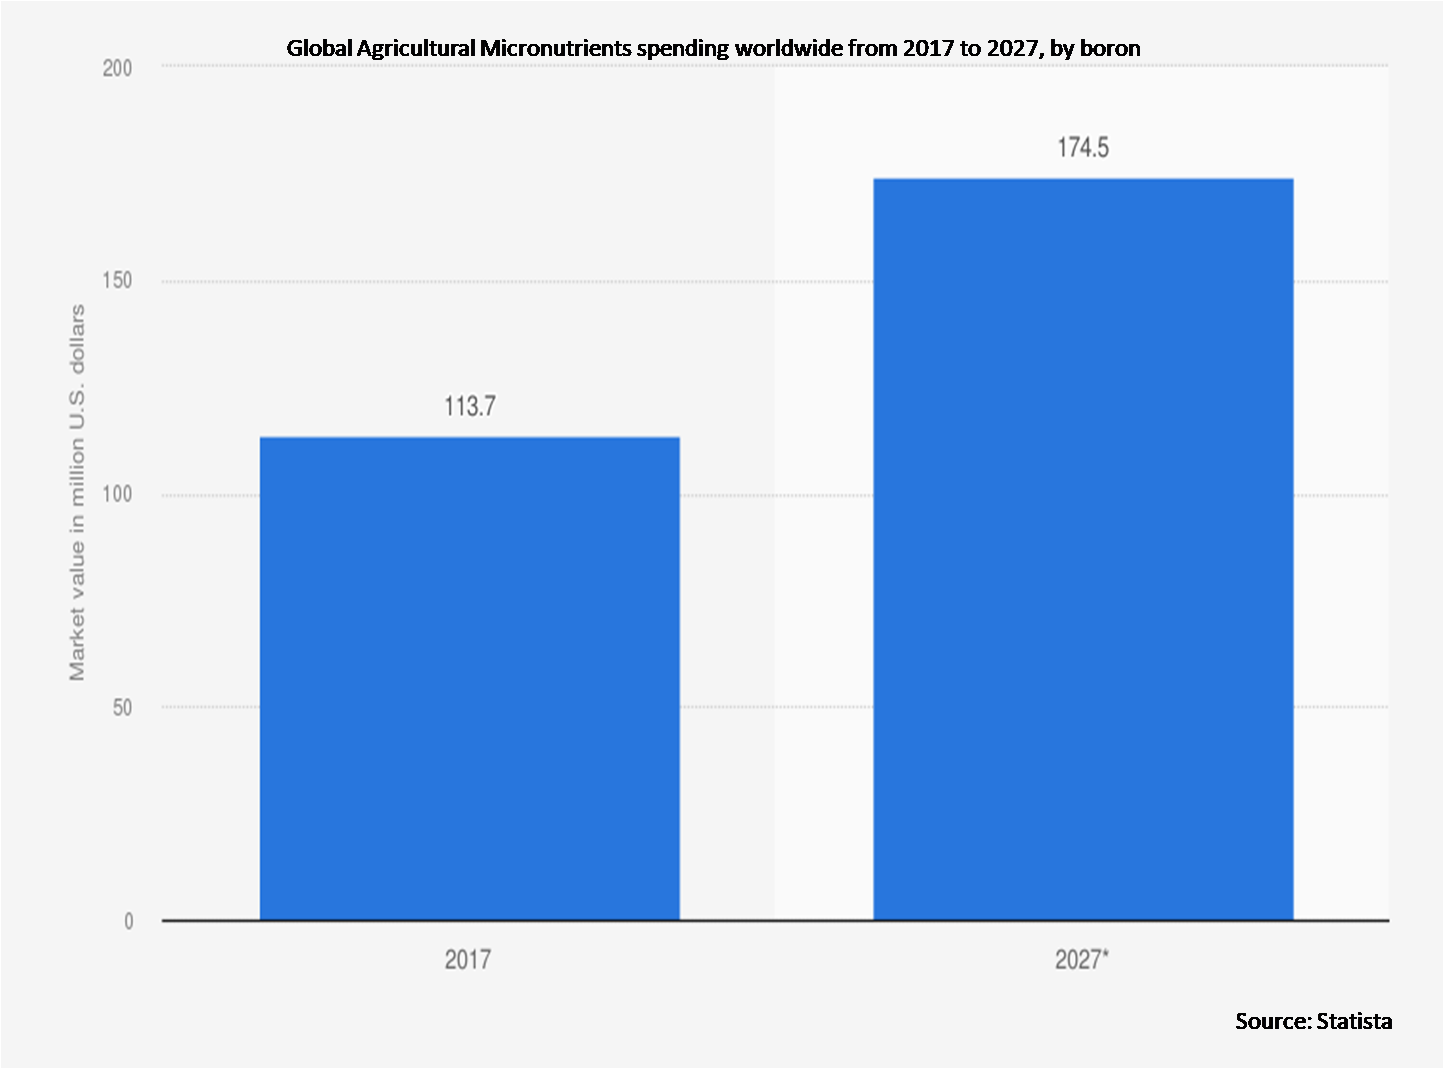
• Boron
• Molybdenum
• Manganese
• Iron
• Zinc
• Other Types
Applications Covered:
• Fertigation
• Foliar
• Soil
• Other Applications
End Users Covered:
• Fruits & Vegetables
• Oilseeds & Pulses
• Non-Agricultural Cereals & Grains
• Other End Users
Regions Covered:
• North America
o US
o Canada
o Mexico
• Europe
o Germany
o UK
o Italy
o France
o Spain
o Rest of Europe
• Asia Pacific
o Japan
o China
o India
o Australia
o New Zealand
o South Korea
o Rest of Asia Pacific
• South America
o Argentina
o Brazil
o Chile
o Rest of South America
• Middle East & Africa
o Saudi Arabia
o UAE
o Qatar
o South Africa
o Rest of Middle East & Africa
What our report offers:
- Market share assessments for the regional and country-level segments
- Strategic recommendations for the new entrants
- Covers Market data for the years 2020, 2021, 2022, 2025, and 2028
- Market Trends (Drivers, Constraints, Opportunities, Threats, Challenges, Investment Opportunities, and recommendations)
- Strategic recommendations in key business segments based on the market estimations
- Competitive landscaping mapping the key common trends
- Company profiling with detailed strategies, financials, and recent developments
- Supply chain trends mapping the latest technological advancements
Free Customization Offerings:
All the customers of this report will be entitled to receive one of the following free customization options:
• Company Profiling
o Comprehensive profiling of additional market players (up to 3)
o SWOT Analysis of key players (up to 3)
• Regional Segmentation
o Market estimations, Forecasts and CAGR of any prominent country as per the client's interest (Note: Depends on feasibility check)
• Competitive Benchmarking
o Benchmarking of key players based on product portfolio, geographical presence, and strategic alliances
Table of Contents
1 Executive Summary
2 Preface
2.1 Abstract
2.2 Stake Holders
2.3 Research Scope
2.4 Research Methodology
2.4.1 Data Mining
2.4.2 Data Analysis
2.4.3 Data Validation
2.4.4 Research Approach
2.5 Research Sources
2.5.1 Primary Research Sources
2.5.2 Secondary Research Sources
2.5.3 Assumptions
3 Market Trend Analysis
3.1 Introduction
3.2 Drivers
3.3 Restraints
3.4 Opportunities
3.5 Threats
3.6 Application Analysis
3.7 End User Analysis
3.8 Emerging Markets
3.9 Impact of Covid-19
4 Porters Five Force Analysis
4.1 Bargaining power of suppliers
4.2 Bargaining power of buyers
4.3 Threat of substitutes
4.4 Threat of new entrants
4.5 Competitive rivalry
5 Global Agricultural Micronutrients Market, By Form
5.1 Introduction
5.2 Chelated
5.3 Non-Chelated
5.4 Other Forms
6 Global Agricultural Micronutrients Market, By Type
6.1 Introduction
6.2 Boron
6.3 Molybdenum
6.4 Manganese
6.5 Iron
6.6 Zinc
6.7 Other Types
7 Global Agricultural Micronutrients Market, By Application
7.1 Introduction
7.2 Fertigation
7.3 Foliar
7.4 Soil
7.5 Other Applications
8 Global Agricultural Micronutrients Market, By End User
8.1 Introduction
8.2 Fruits & Vegetables
8.3 Oilseeds & Pulses
8.4 Non-Agricultural Cereals & Grains
8.5 Other End Users
9 Global Agricultural Micronutrients Market, By Geography
9.1 Introduction
9.2 North America
9.2.1 US
9.2.2 Canada
9.2.3 Mexico
9.3 Europe
9.3.1 Germany
9.3.2 UK
9.3.3 Italy
9.3.4 France
9.3.5 Spain
9.3.6 Rest of Europe
9.4 Asia Pacific
9.4.1 Japan
9.4.2 China
9.4.3 India
9.4.4 Australia
9.4.5 New Zealand
9.4.6 South Korea
9.4.7 Rest of Asia Pacific
9.5 South America
9.5.1 Argentina
9.5.2 Brazil
9.5.3 Chile
9.5.4 Rest of South America
9.6 Middle East & Africa
9.6.1 Saudi Arabia
9.6.2 UAE
9.6.3 Qatar
9.6.4 South Africa
9.6.5 Rest of Middle East & Africa
10 Key Developments
10.1 Agreements, Partnerships, Collaborations and Joint Ventures
10.2 Acquisitions & Mergers
10.3 New Product Launch
10.4 Expansions
10.5 Other Key Strategies
11 Company Profiling
11.1 BASF SE
11.2 Coromandel International Ltd
11.3 AkzoNobel
11.4 Baicor LC
11.5 Balchem
11.6 ATP Nutrition
11.7 Corteva Inc
11.8 Compass Minerals International
11.9 BMS Micronutrient NV
11.10 Haifa Group
11.11 Helena Chemical Company
11.12 Sapec SA
11.13 Stoller Enterprises Inc
11.14 Nutrien Ltd
11.15 Bayer AG
11.16 Nufarm
11.17 The Mosaic Company
11.18 Yara International ASA
11.19 AgroLiquid
11.20 Aries Agro Limited
List of Tables
1 Global Agricultural Micronutrients Market Outlook, By Region (2020-2028) ($MN)
2 Global Agricultural Micronutrients Market Outlook, By Form (2020-2028) ($MN)
3 Global Agricultural Micronutrients Market Outlook, By Chelated (2020-2028) ($MN)
4 Global Agricultural Micronutrients Market Outlook, By Non-Chelated (2020-2028) ($MN)
5 Global Agricultural Micronutrients Market Outlook, By Other Forms (2020-2028) ($MN)
6 Global Agricultural Micronutrients Market Outlook, By Type (2020-2028) ($MN)
7 Global Agricultural Micronutrients Market Outlook, By Boron (2020-2028) ($MN)
8 Global Agricultural Micronutrients Market Outlook, By Molybdenum (2020-2028) ($MN)
9 Global Agricultural Micronutrients Market Outlook, By Manganese (2020-2028) ($MN)
10 Global Agricultural Micronutrients Market Outlook, By Iron (2020-2028) ($MN)
11 Global Agricultural Micronutrients Market Outlook, By Zinc (2020-2028) ($MN)
12 Global Agricultural Micronutrients Market Outlook, By Other Types (2020-2028) ($MN)
13 Global Agricultural Micronutrients Market Outlook, By Application (2020-2028) ($MN)
14 Global Agricultural Micronutrients Market Outlook, By Fertigation (2020-2028) ($MN)
15 Global Agricultural Micronutrients Market Outlook, By Foliar (2020-2028) ($MN)
16 Global Agricultural Micronutrients Market Outlook, By Soil (2020-2028) ($MN)
17 Global Agricultural Micronutrients Market Outlook, By Other Applications (2020-2028) ($MN)
18 Global Agricultural Micronutrients Market Outlook, By End User (2020-2028) ($MN)
19 Global Agricultural Micronutrients Market Outlook, By Fruits & Vegetables (2020-2028) ($MN)
20 Global Agricultural Micronutrients Market Outlook, By Oilseeds & Pulses (2020-2028) ($MN)
21 Global Agricultural Micronutrients Market Outlook, By Non-Agricultural Cereals & Grains (2020-2028) ($MN)
22 Global Agricultural Micronutrients Market Outlook, By Other End Users (2020-2028) ($MN)
23 North America Agricultural Micronutrients Market Outlook, By Country (2020-2028) ($MN)
24 North America Agricultural Micronutrients Market Outlook, By Form (2020-2028) ($MN)
25 North America Agricultural Micronutrients Market Outlook, By Chelated (2020-2028) ($MN)
26 North America Agricultural Micronutrients Market Outlook, By Non-Chelated (2020-2028) ($MN)
27 North America Agricultural Micronutrients Market Outlook, By Other Forms (2020-2028) ($MN)
28 North America Agricultural Micronutrients Market Outlook, By Type (2020-2028) ($MN)
29 North America Agricultural Micronutrients Market Outlook, By Boron (2020-2028) ($MN)
30 North America Agricultural Micronutrients Market Outlook, By Molybdenum (2020-2028) ($MN)
31 North America Agricultural Micronutrients Market Outlook, By Manganese (2020-2028) ($MN)
32 North America Agricultural Micronutrients Market Outlook, By Iron (2020-2028) ($MN)
33 North America Agricultural Micronutrients Market Outlook, By Zinc (2020-2028) ($MN)
34 North America Agricultural Micronutrients Market Outlook, By Other Types (2020-2028) ($MN)
35 North America Agricultural Micronutrients Market Outlook, By Application (2020-2028) ($MN)
36 North America Agricultural Micronutrients Market Outlook, By Fertigation (2020-2028) ($MN)
37 North America Agricultural Micronutrients Market Outlook, By Foliar (2020-2028) ($MN)
38 North America Agricultural Micronutrients Market Outlook, By Soil (2020-2028) ($MN)
39 North America Agricultural Micronutrients Market Outlook, By Other Applications (2020-2028) ($MN)
40 North America Agricultural Micronutrients Market Outlook, By End User (2020-2028) ($MN)
41 North America Agricultural Micronutrients Market Outlook, By Fruits & Vegetables (2020-2028) ($MN)
42 North America Agricultural Micronutrients Market Outlook, By Oilseeds & Pulses (2020-2028) ($MN)
43 North America Agricultural Micronutrients Market Outlook, By Non-Agricultural Cereals & Grains (2020-2028) ($MN)
44 North America Agricultural Micronutrients Market Outlook, By Other End Users (2020-2028) ($MN)
45 Europe Agricultural Micronutrients Market Outlook, By Country (2020-2028) ($MN)
46 Europe Agricultural Micronutrients Market Outlook, By Form (2020-2028) ($MN)
47 Europe Agricultural Micronutrients Market Outlook, By Chelated (2020-2028) ($MN)
48 Europe Agricultural Micronutrients Market Outlook, By Non-Chelated (2020-2028) ($MN)
49 Europe Agricultural Micronutrients Market Outlook, By Other Forms (2020-2028) ($MN)
50 Europe Agricultural Micronutrients Market Outlook, By Type (2020-2028) ($MN)
51 Europe Agricultural Micronutrients Market Outlook, By Boron (2020-2028) ($MN)
52 Europe Agricultural Micronutrients Market Outlook, By Molybdenum (2020-2028) ($MN)
53 Europe Agricultural Micronutrients Market Outlook, By Manganese (2020-2028) ($MN)
54 Europe Agricultural Micronutrients Market Outlook, By Iron (2020-2028) ($MN)
55 Europe Agricultural Micronutrients Market Outlook, By Zinc (2020-2028) ($MN)
56 Europe Agricultural Micronutrients Market Outlook, By Other Types (2020-2028) ($MN)
57 Europe Agricultural Micronutrients Market Outlook, By Application (2020-2028) ($MN)
58 Europe Agricultural Micronutrients Market Outlook, By Fertigation (2020-2028) ($MN)
59 Europe Agricultural Micronutrients Market Outlook, By Foliar (2020-2028) ($MN)
60 Europe Agricultural Micronutrients Market Outlook, By Soil (2020-2028) ($MN)
61 Europe Agricultural Micronutrients Market Outlook, By Other Applications (2020-2028) ($MN)
62 Europe Agricultural Micronutrients Market Outlook, By End User (2020-2028) ($MN)
63 Europe Agricultural Micronutrients Market Outlook, By Fruits & Vegetables (2020-2028) ($MN)
64 Europe Agricultural Micronutrients Market Outlook, By Oilseeds & Pulses (2020-2028) ($MN)
65 Europe Agricultural Micronutrients Market Outlook, By Non-Agricultural Cereals & Grains (2020-2028) ($MN)
66 Europe Agricultural Micronutrients Market Outlook, By Other End Users (2020-2028) ($MN)
67 Asia Pacific Agricultural Micronutrients Market Outlook, By Country (2020-2028) ($MN)
68 Asia Pacific Agricultural Micronutrients Market Outlook, By Form (2020-2028) ($MN)
69 Asia Pacific Agricultural Micronutrients Market Outlook, By Chelated (2020-2028) ($MN)
70 Asia Pacific Agricultural Micronutrients Market Outlook, By Non-Chelated (2020-2028) ($MN)
71 Asia Pacific Agricultural Micronutrients Market Outlook, By Other Forms (2020-2028) ($MN)
72 Asia Pacific Agricultural Micronutrients Market Outlook, By Type (2020-2028) ($MN)
73 Asia Pacific Agricultural Micronutrients Market Outlook, By Boron (2020-2028) ($MN)
74 Asia Pacific Agricultural Micronutrients Market Outlook, By Molybdenum (2020-2028) ($MN)
75 Asia Pacific Agricultural Micronutrients Market Outlook, By Manganese (2020-2028) ($MN)
76 Asia Pacific Agricultural Micronutrients Market Outlook, By Iron (2020-2028) ($MN)
77 Asia Pacific Agricultural Micronutrients Market Outlook, By Zinc (2020-2028) ($MN)
78 Asia Pacific Agricultural Micronutrients Market Outlook, By Other Types (2020-2028) ($MN)
79 Asia Pacific Agricultural Micronutrients Market Outlook, By Application (2020-2028) ($MN)
80 Asia Pacific Agricultural Micronutrients Market Outlook, By Fertigation (2020-2028) ($MN)
81 Asia Pacific Agricultural Micronutrients Market Outlook, By Foliar (2020-2028) ($MN)
82 Asia Pacific Agricultural Micronutrients Market Outlook, By Soil (2020-2028) ($MN)
83 Asia Pacific Agricultural Micronutrients Market Outlook, By Other Applications (2020-2028) ($MN)
84 Asia Pacific Agricultural Micronutrients Market Outlook, By End User (2020-2028) ($MN)
85 Asia Pacific Agricultural Micronutrients Market Outlook, By Fruits & Vegetables (2020-2028) ($MN)
86 Asia Pacific Agricultural Micronutrients Market Outlook, By Oilseeds & Pulses (2020-2028) ($MN)
87 Asia Pacific Agricultural Micronutrients Market Outlook, By Non-Agricultural Cereals & Grains (2020-2028) ($MN)
88 Asia Pacific Agricultural Micronutrients Market Outlook, By Other End Users (2020-2028) ($MN)
89 South America Agricultural Micronutrients Market Outlook, By Country (2020-2028) ($MN)
90 South America Agricultural Micronutrients Market Outlook, By Form (2020-2028) ($MN)
91 South America Agricultural Micronutrients Market Outlook, By Chelated (2020-2028) ($MN)
92 South America Agricultural Micronutrients Market Outlook, By Non-Chelated (2020-2028) ($MN)
93 South America Agricultural Micronutrients Market Outlook, By Other Forms (2020-2028) ($MN)
94 South America Agricultural Micronutrients Market Outlook, By Type (2020-2028) ($MN)
95 South America Agricultural Micronutrients Market Outlook, By Boron (2020-2028) ($MN)
96 South America Agricultural Micronutrients Market Outlook, By Molybdenum (2020-2028) ($MN)
97 South America Agricultural Micronutrients Market Outlook, By Manganese (2020-2028) ($MN)
98 South America Agricultural Micronutrients Market Outlook, By Iron (2020-2028) ($MN)
99 South America Agricultural Micronutrients Market Outlook, By Zinc (2020-2028) ($MN)
100 South America Agricultural Micronutrients Market Outlook, By Other Types (2020-2028) ($MN)
101 South America Agricultural Micronutrients Market Outlook, By Application (2020-2028) ($MN)
102 South America Agricultural Micronutrients Market Outlook, By Fertigation (2020-2028) ($MN)
103 South America Agricultural Micronutrients Market Outlook, By Foliar (2020-2028) ($MN)
104 South America Agricultural Micronutrients Market Outlook, By Soil (2020-2028) ($MN)
105 South America Agricultural Micronutrients Market Outlook, By Other Applications (2020-2028) ($MN)
106 South America Agricultural Micronutrients Market Outlook, By End User (2020-2028) ($MN)
107 South America Agricultural Micronutrients Market Outlook, By Fruits & Vegetables (2020-2028) ($MN)
108 South America Agricultural Micronutrients Market Outlook, By Oilseeds & Pulses (2020-2028) ($MN)
109 South America Agricultural Micronutrients Market Outlook, By Non-Agricultural Cereals & Grains (2020-2028) ($MN)
110 South America Agricultural Micronutrients Market Outlook, By Other End Users (2020-2028) ($MN)
111 Middle East & Africa Agricultural Micronutrients Market Outlook, By Country (2020-2028) ($MN)
112 Middle East & Africa Agricultural Micronutrients Market Outlook, By Form (2020-2028) ($MN)
113 Middle East & Africa Agricultural Micronutrients Market Outlook, By Chelated (2020-2028) ($MN)
114 Middle East & Africa Agricultural Micronutrients Market Outlook, By Non-Chelated (2020-2028) ($MN)
115 Middle East & Africa Agricultural Micronutrients Market Outlook, By Other Forms (2020-2028) ($MN)
116 Middle East & Africa Agricultural Micronutrients Market Outlook, By Type (2020-2028) ($MN)
117 Middle East & Africa Agricultural Micronutrients Market Outlook, By Boron (2020-2028) ($MN)
118 Middle East & Africa Agricultural Micronutrients Market Outlook, By Molybdenum (2020-2028) ($MN)
119 Middle East & Africa Agricultural Micronutrients Market Outlook, By Manganese (2020-2028) ($MN)
120 Middle East & Africa Agricultural Micronutrients Market Outlook, By Iron (2020-2028) ($MN)
121 Middle East & Africa Agricultural Micronutrients Market Outlook, By Zinc (2020-2028) ($MN)
122 Middle East & Africa Agricultural Micronutrients Market Outlook, By Other Types (2020-2028) ($MN)
123 Middle East & Africa Agricultural Micronutrients Market Outlook, By Application (2020-2028) ($MN)
124 Middle East & Africa Agricultural Micronutrients Market Outlook, By Fertigation (2020-2028) ($MN)
125 Middle East & Africa Agricultural Micronutrients Market Outlook, By Foliar (2020-2028) ($MN)
126 Middle East & Africa Agricultural Micronutrients Market Outlook, By Soil (2020-2028) ($MN)
127 Middle East & Africa Agricultural Micronutrients Market Outlook, By Other Applications (2020-2028) ($MN)
128 Middle East & Africa Agricultural Micronutrients Market Outlook, By End User (2020-2028) ($MN)
129 Middle East & Africa Agricultural Micronutrients Market Outlook, By Fruits & Vegetables (2020-2028) ($MN)
130 Middle East & Africa Agricultural Micronutrients Market Outlook, By Oilseeds & Pulses (2020-2028) ($MN)
131 Middle East & Africa Agricultural Micronutrients Market Outlook, By Non-Agricultural Cereals & Grains (2020-2028) ($MN)
132 Middle East & Africa Agricultural Micronutrients Market Outlook, By Other End Users (2020-2028) ($MN)
List of Figures
RESEARCH METHODOLOGY

We at ‘Stratistics’ opt for an extensive research approach which involves data mining, data validation, and data analysis. The various research sources include in-house repository, secondary research, competitor’s sources, social media research, client internal data, and primary research.
Our team of analysts prefers the most reliable and authenticated data sources in order to perform the comprehensive literature search. With access to most of the authenticated data bases our team highly considers the best mix of information through various sources to obtain extensive and accurate analysis.
Each report takes an average time of a month and a team of 4 industry analysts. The time may vary depending on the scope and data availability of the desired market report. The various parameters used in the market assessment are standardized in order to enhance the data accuracy.
Data Mining
The data is collected from several authenticated, reliable, paid and unpaid sources and is filtered depending on the scope & objective of the research. Our reports repository acts as an added advantage in this procedure. Data gathering from the raw material suppliers, distributors and the manufacturers is performed on a regular basis, this helps in the comprehensive understanding of the products value chain. Apart from the above mentioned sources the data is also collected from the industry consultants to ensure the objective of the study is in the right direction.
Market trends such as technological advancements, regulatory affairs, market dynamics (Drivers, Restraints, Opportunities and Challenges) are obtained from scientific journals, market related national & international associations and organizations.
Data Analysis
From the data that is collected depending on the scope & objective of the research the data is subjected for the analysis. The critical steps that we follow for the data analysis include:
- Product Lifecycle Analysis
- Competitor analysis
- Risk analysis
- Porters Analysis
- PESTEL Analysis
- SWOT Analysis
The data engineering is performed by the core industry experts considering both the Marketing Mix Modeling and the Demand Forecasting. The marketing mix modeling makes use of multiple-regression techniques to predict the optimal mix of marketing variables. Regression factor is based on a number of variables and how they relate to an outcome such as sales or profits.
Data Validation
The data validation is performed by the exhaustive primary research from the expert interviews. This includes telephonic interviews, focus groups, face to face interviews, and questionnaires to validate our research from all aspects. The industry experts we approach come from the leading firms, involved in the supply chain ranging from the suppliers, distributors to the manufacturers and consumers so as to ensure an unbiased analysis.
We are in touch with more than 15,000 industry experts with the right mix of consultants, CEO's, presidents, vice presidents, managers, experts from both supply side and demand side, executives and so on.
The data validation involves the primary research from the industry experts belonging to:
- Leading Companies
- Suppliers & Distributors
- Manufacturers
- Consumers
- Industry/Strategic Consultants
Apart from the data validation the primary research also helps in performing the fill gap research, i.e. providing solutions for the unmet needs of the research which helps in enhancing the reports quality.
For more details about research methodology, kindly write to us at info@strategymrc.com
Frequently Asked Questions
In case of any queries regarding this report, you can contact the customer service by filing the “Inquiry Before Buy” form available on the right hand side. You may also contact us through email: info@strategymrc.com or phone: +1-301-202-5929
Yes, the samples are available for all the published reports. You can request them by filling the “Request Sample” option available in this page.
Yes, you can request a sample with your specific requirements. All the customized samples will be provided as per the requirement with the real data masked.
All our reports are available in Digital PDF format. In case if you require them in any other formats, such as PPT, Excel etc you can submit a request through “Inquiry Before Buy” form available on the right hand side. You may also contact us through email: info@strategymrc.com or phone: +1-301-202-5929
We offer a free 15% customization with every purchase. This requirement can be fulfilled for both pre and post sale. You may send your customization requirements through email at info@strategymrc.com or call us on +1-301-202-5929.
We have 3 different licensing options available in electronic format.
- Single User Licence: Allows one person, typically the buyer, to have access to the ordered product. The ordered product cannot be distributed to anyone else.
- 2-5 User Licence: Allows the ordered product to be shared among a maximum of 5 people within your organisation.
- Corporate License: Allows the product to be shared among all employees of your organisation regardless of their geographical location.
All our reports are typically be emailed to you as an attachment.
To order any available report you need to register on our website. The payment can be made either through CCAvenue or PayPal payments gateways which accept all international cards.
We extend our support to 6 months post sale. A post sale customization is also provided to cover your unmet needs in the report.
Request Customization
We offer complimentary customization of up to 15% with every purchase. To share your customization requirements, feel free to email us at info@strategymrc.com or call us on +1-301-202-5929. .
Please Note: Customization within the 15% threshold is entirely free of charge. If your request exceeds this limit, we will conduct a feasibility assessment. Following that, a detailed quote and timeline will be provided.
WHY CHOOSE US ?

Assured Quality
Best in class reports with high standard of research integrity

24X7 Research Support
Continuous support to ensure the best customer experience.

Free Customization
Adding more values to your product of interest.

Safe & Secure Access
Providing a secured environment for all online transactions.

Trusted by 600+ Brands
Serving the most reputed brands across the world.