
Anti Static Oil Market
Anti-Static Oil Market Forecasts to 2028 - Global Analysis By Type (90% Purity, 95% Purity and 99% Purity), Application (Textile Industry, Automotive Industry and Other Applications) and By Geography

|
Years Covered |
2020-2028 |
|
Estimated Year Value (2022) |
US $475.96 MN |
|
Projected Year Value (2028) |
US $648.84 MN |
|
CAGR (2022 - 2028) |
5.2% |
|
Regions Covered |
North America, Europe, Asia Pacific, South America, and Middle East & Africa |
|
Countries Covered |
US, Canada, Mexico, Germany, UK, Italy, France, Spain, Japan, China, India, Australia, New Zealand, South Korea, Rest of Asia Pacific, South America, Argentina, Brazil, Chile, Middle East & Africa, Saudi Arabia, UAE, Qatar, and South Africa |
|
Largest Market |
Asia Pacific |
|
Highest Growing Market |
Europe |
According to Stratistics MRC, the Global Anti-Static Oil Market is accounted for $475.96 million in 2022 and is expected to reach $648.84 million by 2028 growing at a CAGR of 5.2% during the forecast period. Anti-static oil is be made by adding additives to emulsifiable oils, such as synthetic, vegetable and mineral oils that have been added to make them emulsifiable and give them anti-static qualities. It serves to keep electronic equipment from becoming overcharged with static electricity. It offers advantages such as superior wetting qualities, decreased volatility, great water dispensability, and finished yarns and fabrics that are stain-free. Fabrics, adhesives, paints & coatings, printing inks, electrical equipment and lubricants are a few examples of products that employ anti-static oil.
According to the reports by Powerloom Industry and Exports of India, there are about 3.9 million handlooms and 1.8 million power looms in India and employing nearly 51 million people.
Market Dynamics:
Driver:
Growing adoption of bio-based and synthetic lubricants
Bio-based lubricants help alleviate worries about environmental degradation. They biodegrade quickly and effectively. It is substantially less harmful. During the texturing stage, anti-static textile oil is applied to synthetic yarn. The process of texturing turns the POY supply yarn into DTY, creating a beautiful and distinctive final product. The yarn gains a pleasing handle and gains greater flexibility and heat retention which is accelerating the market growth.
Restraint:
Strict regulations
Anti-static oil is very combustible to use. OSHA and other regulatory authorities impose strict rules surrounding the health and safety of employees. It is important to regularly examine the static pressure drop at the exhaust ducts that go from the equipment. The regulatory organization’s instructions should be followed by all applicants who use antistatic oil. The rigid regulations and procedures are impeding the market expansion.
Opportunity:
Increasing demand from weaving
Weaving is the method for producing cloth on a machine with a power loom. The main loom motions are often repeated throughout weaving. In power-operated looms, anti-static oil is utilized. When making textiles, anti-static oil is applied to yarn on looms to lubricate and smooth out the hairiness of the yarn and get rid of static electricity. Its aspects, comprising decreased friction, improved loom efficiency and rising weaving demand during the projected period are boosting the market demand.
Threat:
Fluctuating price rates
Huge price swings for crude oil have been recognized as a major issue for the anti-static oil market. Some of the main factors influencing oil price volatility are demand and supply, natural disasters, production costs, and political unrest. Both the textile and automobile industries use anti-static oil extensively. These pricing fluctuations have a significant impact on both the market and the end customers.
Covid-19 Impact
The price and trade of antistatic oil have been drastically altered by COVID-19. The enactment of lockdown had an impact on production and delayed all industries. The textile sector makes the largest use of antistatic oil. The pandemic restrictions halted the flow of raw materials and decreased export and import orders. The market was greatly affected by all of these factors.
The 95% purity segment is expected to be the largest during the forecast period
The 95% purity segment is estimated to have a lucrative growth. It is a high concentration of purified mineral oil. 95% of all contaminants were eliminated throughout the manufacturing process. It is used to create anti-static oils for cooling systems, air purifiers, and other electrical equipment which require oil with minimal friction and no ionization or charge. Additionally, it acts as a lubricant for plastic parts that are susceptible to damage from friction caused by dust and other particles when used at high temperatures.
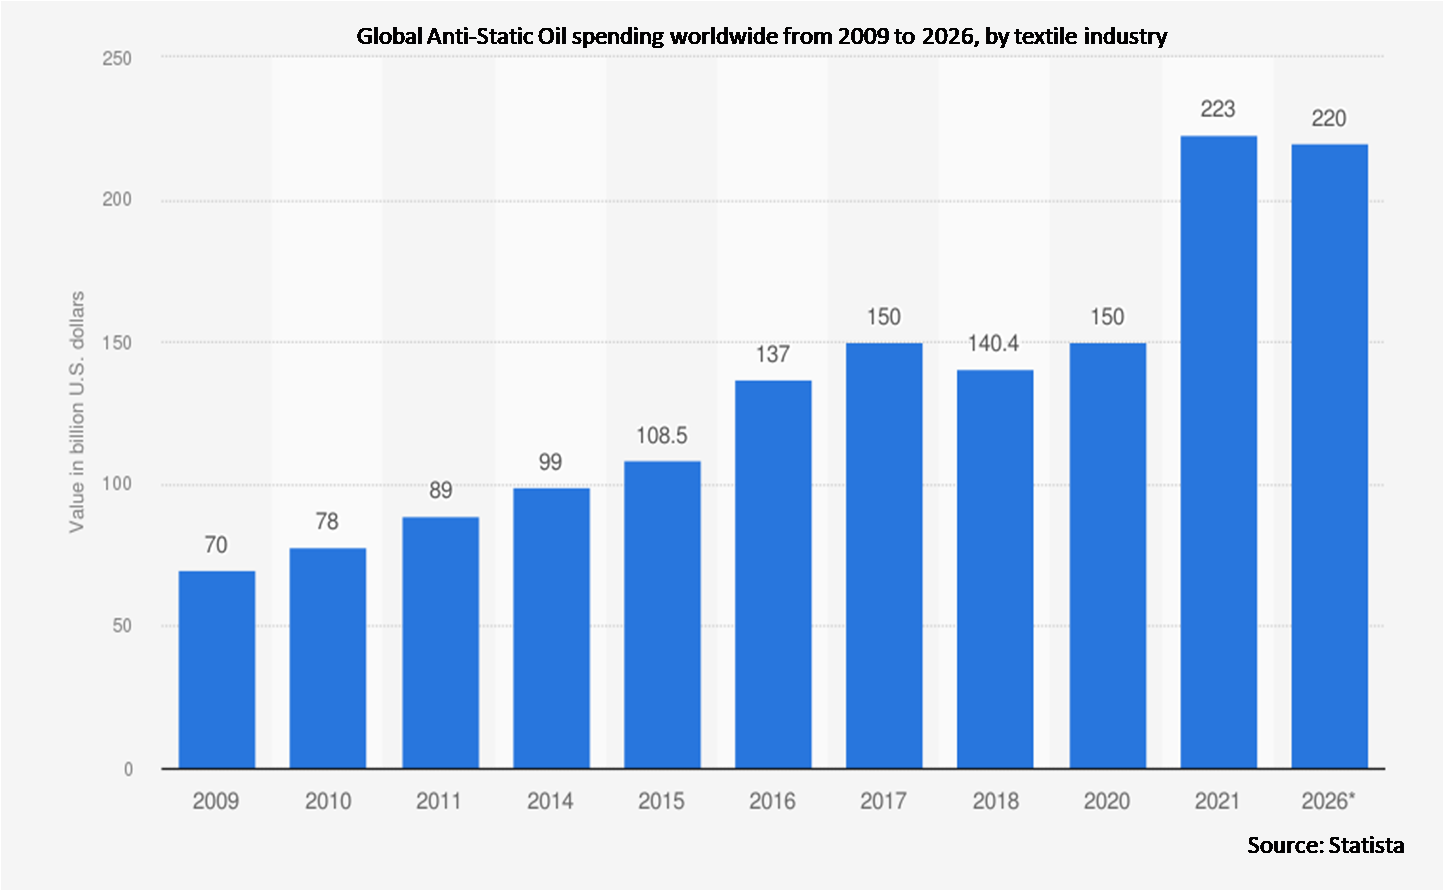
The textile industry segment is expected to have the highest CAGR during the forecast period
The textile industry segment is anticipated to witness the fastest CAGR growth during the forecast period attributed to the increased production and consumption of synthetic and artificial fibers. The most extensive anti static oil application was in the textile sector. When making yarn, they reduce friction between metal and yarn and give the desired lubricity and antistatic protection to different types of fibers. It offers stain-free yarns and fabric which is helping the market flourish.
Region with largest share:
Asia Pacific is projected to hold the largest market share during the forecast period. The region is anticipated to have substantial growth as a result of rising product demand from the textile, automotive, and other sectors. Additionally, it is predicted that increased worker awareness of health and safety issues and strict OSHA and other regulatory bodies’ regulations might boost demand for the product.
Region with highest CAGR:
Europe is projected to have the highest CAGR over the forecast period. The market is fiercely competitive, with several major businesses controlling it. These businesses are making significant research and development investments in order to create cutting-edge anti-static oils that can adapt to the changing demands of the market. A number of measures launched by the European Commission to lessen workplace static charge exposure for employees are anticipated to boost market expansion.

Key players in the market
Some of the key players profiled in the Anti-Static Oil Market include Hindustan Petroleum Corporation Limited, Indian Oil Corporation Limited, Witmans Group, Hansen & Rosenthal Group, Ricci SpA, Unicon Fibro Chemicals Pvt Ltd, Panama Petrochem Ltd, ExxonMobil, Total SA, Fuchs Group, Transfar Chemicals, Takemoto Oil & Fat Co. Ltd and Shell PLC.
Key Developments:
In March 2023, Hindustan Petroleum Corporation Ltd (HPCL) has signed a pact with Bharat Petroleum Corporation Ltd (BPCL) for synergy in purchase and sale of hydrogen between the refineries the two firms operate in Mumbai. The strategic partnership between two oil marketing companies is part of synergy for "mutual aid during emergencies and towards environmental impact by minimizing valuable hydrogen flaring.
In September 2022, Hansen & Rosenthal Group inaugurated the new Power-to-Liquid (PtL) demonstration plant at the production site of Ölwerke Schindler GmbH. The process facilities will be used to produce synthesis-based alternatives to fossil raw materials. The demonstration project is one of the world's first PtL concepts on a technical scale, supplying so-called eFuels as well as synthetic raw waxes.
In July 2022, Indian Oil Corporation Limited Announced Its Partnership With Novac Technology Solutions to offer its employees a robust learning ecosystem through Novac’s digital learning vertical ‘Novac Learning’.
Types Covered:
• 90% Purity
• 95% Purity
• 99% Purity
Applications Covered:
• Textile Industry
• Automotive Industry
• Other Applications
Regions Covered:
• North America
o US
o Canada
o Mexico
• Europe
o Germany
o UK
o Italy
o France
o Spain
o Rest of Europe
• Asia Pacific
o Japan
o China
o India
o Australia
o New Zealand
o South Korea
o Rest of Asia Pacific
• South America
o Argentina
o Brazil
o Chile
o Rest of South America
• Middle East & Africa
o Saudi Arabia
o UAE
o Qatar
o South Africa
o Rest of Middle East & Africa
What our report offers:
- Market share assessments for the regional and country-level segments
- Strategic recommendations for the new entrants
- Covers Market data for the years 2020, 2021, 2022, 2025, and 2028
- Market Trends (Drivers, Constraints, Opportunities, Threats, Challenges, Investment Opportunities, and recommendations)
- Strategic recommendations in key business segments based on the market estimations
- Competitive landscaping mapping the key common trends
- Company profiling with detailed strategies, financials, and recent developments
- Supply chain trends mapping the latest technological advancements
Free Customization Offerings:
All the customers of this report will be entitled to receive one of the following free customization options:
• Company Profiling
o Comprehensive profiling of additional market players (up to 3)
o SWOT Analysis of key players (up to 3)
• Regional Segmentation
o Market estimations, Forecasts and CAGR of any prominent country as per the client's interest (Note: Depends on feasibility check)
• Competitive Benchmarking
o Benchmarking of key players based on product portfolio, geographical presence, and strategic alliances
Table of Contents
1 Executive Summary
2 Preface
2.1 Abstract
2.2 Stake Holders
2.3 Research Scope
2.4 Research Methodology
2.4.1 Data Mining
2.4.2 Data Analysis
2.4.3 Data Validation
2.4.4 Research Approach
2.5 Research Sources
2.5.1 Primary Research Sources
2.5.2 Secondary Research Sources
2.5.3 Assumptions
3 Market Trend Analysis
3.1 Introduction
3.2 Drivers
3.3 Restraints
3.4 Opportunities
3.5 Threats
3.6 Application Analysis
3.7 Emerging Markets
3.8 Impact of Covid-19
4 Porters Five Force Analysis
4.1 Bargaining power of suppliers
4.2 Bargaining power of buyers
4.3 Threat of substitutes
4.4 Threat of new entrants
4.5 Competitive rivalry
5 Global Anti-Static Oil Market, By Type
5.1 Introduction
5.2 90% Purity
5.3 95% Purity
5.4 99% Purity
6 Global Anti-Static Oil Market, By Application
6.1 Introduction
6.2 Textile Industry
6.3 Automotive Industry
6.4 Other Applications
7 Global Anti-Static Oil Market, By Geography
7.1 Introduction
7.2 North America
7.2.1 US
7.2.2 Canada
7.2.3 Mexico
7.3 Europe
7.3.1 Germany
7.3.2 UK
7.3.3 Italy
7.3.4 France
7.3.5 Spain
7.3.6 Rest of Europe
7.4 Asia Pacific
7.4.1 Japan
7.4.2 China
7.4.3 India
7.4.4 Australia
7.4.5 New Zealand
7.4.6 South Korea
7.4.7 Rest of Asia Pacific
7.5 South America
7.5.1 Argentina
7.5.2 Brazil
7.5.3 Chile
7.5.4 Rest of South America
7.6 Middle East & Africa
7.6.1 Saudi Arabia
7.6.2 UAE
7.6.3 Qatar
7.6.4 South Africa
7.6.5 Rest of Middle East & Africa
8 Key Developments
8.1 Agreements, Partnerships, Collaborations and Joint Ventures
8.2 Acquisitions & Mergers
8.3 New Product Launch
8.4 Expansions
8.5 Other Key Strategies
9 Company Profiling
9.1 Hindustan Petroleum Corporation Limited
9.2 Indian Oil Corporation Limited
9.3 Witmans Group
9.4 Hansen & Rosenthal Group
9.5 Ricci SpA
9.6 Unicon Fibro Chemicals Pvt Ltd
9.7 Panama Petrochem Ltd
9.8 ExxonMobil
9.9 Total SA
9.10 Fuchs Group
9.11 Transfar Chemicals
9.12 Takemoto Oil & Fat Co. Ltd
9.13 Shell PLC
List of Tables
1 Global Anti-Static Oil Market Outlook, By Region (2020-2028) ($MN)
2 Global Anti-Static Oil Market Outlook, By Type (2020-2028) ($MN)
3 Global Anti-Static Oil Market Outlook, By 90% Purity (2020-2028) ($MN)
4 Global Anti-Static Oil Market Outlook, By 95% Purity (2020-2028) ($MN)
5 Global Anti-Static Oil Market Outlook, By 99% Purity (2020-2028) ($MN)
6 Global Anti-Static Oil Market Outlook, By Application (2020-2028) ($MN)
7 Global Anti-Static Oil Market Outlook, By Textile Industry (2020-2028) ($MN)
8 Global Anti-Static Oil Market Outlook, By Automotive Industry (2020-2028) ($MN)
9 Global Anti-Static Oil Market Outlook, By Other Applications (2020-2028) ($MN)
10 North America Anti-Static Oil Market Outlook, By Country (2020-2028) ($MN)
11 North America Anti-Static Oil Market Outlook, By Type (2020-2028) ($MN)
12 North America Anti-Static Oil Market Outlook, By 90% Purity (2020-2028) ($MN)
13 North America Anti-Static Oil Market Outlook, By 95% Purity (2020-2028) ($MN)
14 North America Anti-Static Oil Market Outlook, By 99% Purity (2020-2028) ($MN)
15 North America Anti-Static Oil Market Outlook, By Application (2020-2028) ($MN)
16 North America Anti-Static Oil Market Outlook, By Textile Industry (2020-2028) ($MN)
17 North America Anti-Static Oil Market Outlook, By Automotive Industry (2020-2028) ($MN)
18 North America Anti-Static Oil Market Outlook, By Other Applications (2020-2028) ($MN)
19 Europe Anti-Static Oil Market Outlook, By Country (2020-2028) ($MN)
20 Europe Anti-Static Oil Market Outlook, By Type (2020-2028) ($MN)
21 Europe Anti-Static Oil Market Outlook, By 90% Purity (2020-2028) ($MN)
22 Europe Anti-Static Oil Market Outlook, By 95% Purity (2020-2028) ($MN)
23 Europe Anti-Static Oil Market Outlook, By 99% Purity (2020-2028) ($MN)
24 Europe Anti-Static Oil Market Outlook, By Application (2020-2028) ($MN)
25 Europe Anti-Static Oil Market Outlook, By Textile Industry (2020-2028) ($MN)
26 Europe Anti-Static Oil Market Outlook, By Automotive Industry (2020-2028) ($MN)
27 Europe Anti-Static Oil Market Outlook, By Other Applications (2020-2028) ($MN)
28 Asia Pacific Anti-Static Oil Market Outlook, By Country (2020-2028) ($MN)
29 Asia Pacific Anti-Static Oil Market Outlook, By Type (2020-2028) ($MN)
30 Asia Pacific Anti-Static Oil Market Outlook, By 90% Purity (2020-2028) ($MN)
31 Asia Pacific Anti-Static Oil Market Outlook, By 95% Purity (2020-2028) ($MN)
32 Asia Pacific Anti-Static Oil Market Outlook, By 99% Purity (2020-2028) ($MN)
33 Asia Pacific Anti-Static Oil Market Outlook, By Application (2020-2028) ($MN)
34 Asia Pacific Anti-Static Oil Market Outlook, By Textile Industry (2020-2028) ($MN)
35 Asia Pacific Anti-Static Oil Market Outlook, By Automotive Industry (2020-2028) ($MN)
36 Asia Pacific Anti-Static Oil Market Outlook, By Other Applications (2020-2028) ($MN)
37 South America Anti-Static Oil Market Outlook, By Country (2020-2028) ($MN)
38 South America Anti-Static Oil Market Outlook, By Type (2020-2028) ($MN)
39 South America Anti-Static Oil Market Outlook, By 90% Purity (2020-2028) ($MN)
40 South America Anti-Static Oil Market Outlook, By 95% Purity (2020-2028) ($MN)
41 South America Anti-Static Oil Market Outlook, By 99% Purity (2020-2028) ($MN)
42 South America Anti-Static Oil Market Outlook, By Application (2020-2028) ($MN)
43 South America Anti-Static Oil Market Outlook, By Textile Industry (2020-2028) ($MN)
44 South America Anti-Static Oil Market Outlook, By Automotive Industry (2020-2028) ($MN)
45 South America Anti-Static Oil Market Outlook, By Other Applications (2020-2028) ($MN)
46 Middle East & Africa Anti-Static Oil Market Outlook, By Country (2020-2028) ($MN)
47 Middle East & Africa Anti-Static Oil Market Outlook, By Type (2020-2028) ($MN)
48 Middle East & Africa Anti-Static Oil Market Outlook, By 90% Purity (2020-2028) ($MN)
49 Middle East & Africa Anti-Static Oil Market Outlook, By 95% Purity (2020-2028) ($MN)
50 Middle East & Africa Anti-Static Oil Market Outlook, By 99% Purity (2020-2028) ($MN)
51 Middle East & Africa Anti-Static Oil Market Outlook, By Application (2020-2028) ($MN)
52 Middle East & Africa Anti-Static Oil Market Outlook, By Textile Industry (2020-2028) ($MN)
53 Middle East & Africa Anti-Static Oil Market Outlook, By Automotive Industry (2020-2028) ($MN)
54 Middle East & Africa Anti-Static Oil Market Outlook, By Other Applications (2020-2028) ($MN)
List of Figures
RESEARCH METHODOLOGY

We at ‘Stratistics’ opt for an extensive research approach which involves data mining, data validation, and data analysis. The various research sources include in-house repository, secondary research, competitor’s sources, social media research, client internal data, and primary research.
Our team of analysts prefers the most reliable and authenticated data sources in order to perform the comprehensive literature search. With access to most of the authenticated data bases our team highly considers the best mix of information through various sources to obtain extensive and accurate analysis.
Each report takes an average time of a month and a team of 4 industry analysts. The time may vary depending on the scope and data availability of the desired market report. The various parameters used in the market assessment are standardized in order to enhance the data accuracy.
Data Mining
The data is collected from several authenticated, reliable, paid and unpaid sources and is filtered depending on the scope & objective of the research. Our reports repository acts as an added advantage in this procedure. Data gathering from the raw material suppliers, distributors and the manufacturers is performed on a regular basis, this helps in the comprehensive understanding of the products value chain. Apart from the above mentioned sources the data is also collected from the industry consultants to ensure the objective of the study is in the right direction.
Market trends such as technological advancements, regulatory affairs, market dynamics (Drivers, Restraints, Opportunities and Challenges) are obtained from scientific journals, market related national & international associations and organizations.
Data Analysis
From the data that is collected depending on the scope & objective of the research the data is subjected for the analysis. The critical steps that we follow for the data analysis include:
- Product Lifecycle Analysis
- Competitor analysis
- Risk analysis
- Porters Analysis
- PESTEL Analysis
- SWOT Analysis
The data engineering is performed by the core industry experts considering both the Marketing Mix Modeling and the Demand Forecasting. The marketing mix modeling makes use of multiple-regression techniques to predict the optimal mix of marketing variables. Regression factor is based on a number of variables and how they relate to an outcome such as sales or profits.
Data Validation
The data validation is performed by the exhaustive primary research from the expert interviews. This includes telephonic interviews, focus groups, face to face interviews, and questionnaires to validate our research from all aspects. The industry experts we approach come from the leading firms, involved in the supply chain ranging from the suppliers, distributors to the manufacturers and consumers so as to ensure an unbiased analysis.
We are in touch with more than 15,000 industry experts with the right mix of consultants, CEO's, presidents, vice presidents, managers, experts from both supply side and demand side, executives and so on.
The data validation involves the primary research from the industry experts belonging to:
- Leading Companies
- Suppliers & Distributors
- Manufacturers
- Consumers
- Industry/Strategic Consultants
Apart from the data validation the primary research also helps in performing the fill gap research, i.e. providing solutions for the unmet needs of the research which helps in enhancing the reports quality.
For more details about research methodology, kindly write to us at info@strategymrc.com
Frequently Asked Questions
In case of any queries regarding this report, you can contact the customer service by filing the “Inquiry Before Buy” form available on the right hand side. You may also contact us through email: info@strategymrc.com or phone: +1-301-202-5929
Yes, the samples are available for all the published reports. You can request them by filling the “Request Sample” option available in this page.
Yes, you can request a sample with your specific requirements. All the customized samples will be provided as per the requirement with the real data masked.
All our reports are available in Digital PDF format. In case if you require them in any other formats, such as PPT, Excel etc you can submit a request through “Inquiry Before Buy” form available on the right hand side. You may also contact us through email: info@strategymrc.com or phone: +1-301-202-5929
We offer a free 15% customization with every purchase. This requirement can be fulfilled for both pre and post sale. You may send your customization requirements through email at info@strategymrc.com or call us on +1-301-202-5929.
We have 3 different licensing options available in electronic format.
- Single User Licence: Allows one person, typically the buyer, to have access to the ordered product. The ordered product cannot be distributed to anyone else.
- 2-5 User Licence: Allows the ordered product to be shared among a maximum of 5 people within your organisation.
- Corporate License: Allows the product to be shared among all employees of your organisation regardless of their geographical location.
All our reports are typically be emailed to you as an attachment.
To order any available report you need to register on our website. The payment can be made either through CCAvenue or PayPal payments gateways which accept all international cards.
We extend our support to 6 months post sale. A post sale customization is also provided to cover your unmet needs in the report.
Request Customization
We offer complimentary customization of up to 15% with every purchase. To share your customization requirements, feel free to email us at info@strategymrc.com or call us on +1-301-202-5929. .
Please Note: Customization within the 15% threshold is entirely free of charge. If your request exceeds this limit, we will conduct a feasibility assessment. Following that, a detailed quote and timeline will be provided.
WHY CHOOSE US ?

Assured Quality
Best in class reports with high standard of research integrity

24X7 Research Support
Continuous support to ensure the best customer experience.

Free Customization
Adding more values to your product of interest.

Safe & Secure Access
Providing a secured environment for all online transactions.

Trusted by 600+ Brands
Serving the most reputed brands across the world.