
Application Observability Market
Application Observability Market Forecasts to 2034 – Global Analysis By Component (Solutions and Services), Deployment Mode, Organization Size, Application, End User and By Geography

Market Dynamics:
Driver:
Cloud-Native Complexity Expansion
The accelerating adoption of cloud-native architectures and microservices-based application design has fundamentally increased the volume and variety of telemetry generated by modern software systems, as organizations decompose applications into hundreds of independently deployable services spanning multiple clusters and regions. Application observability platforms have become essential infrastructure for managing this complexity, since they provide the correlation and context required to trace requests across distributed service boundaries and identify performance bottlenecks. Enterprises across financial services, retail, and technology sectors are investing in observability solutions in order to reduce mean time to resolution for production incidents, which in turn improves service reliability and protects revenue-generating digital experiences.
Restraint:
Telemetry Cost Escalation
The exponential growth in telemetry volume generated by cloud-native applications has created significant cost management challenges for organizations, as observability platforms typically price on data ingestion and retention, leading to unpredictable and rapidly escalating expenses. Many enterprises report that observability spending is growing faster than overall cloud infrastructure costs, forcing platform teams to implement sampling strategies, data filtering, and retention policies that may compromise visibility into critical systems. This cost dynamic restrains adoption among budget-constrained organizations and creates pressure on vendors to offer more predictable pricing models, thereby slowing market expansion in price-sensitive segments.
Opportunity:
AI-Native Observability
The emergence of AI-powered applications and agentic systems presents substantial opportunities for observability vendors, as these workloads introduce non-deterministic behavior, complex agent trajectories, and novel failure modes that traditional monitoring approaches cannot adequately address. By extending observability capabilities to AI model evaluation, prompt tracing, and agent behavior analysis, platforms can address a growing need for visibility into AI system performance and correctness. Vendors that successfully position their offerings as control planes for both traditional applications and AI workloads can capture demand from enterprises seeking to deploy generative AI with confidence, while differentiating themselves through capabilities that general-purpose monitoring tools cannot replicate.
Threat:
Platform Consolidation by Cloud Providers
Major cloud providers are continuously expanding their native observability capabilities, bundling monitoring, logging, and tracing services directly into their platforms at competitive price points. Organizations already invested in comprehensive cloud infrastructure may opt to utilize built-in observability features rather than procuring dedicated third-party solutions, particularly for simpler workloads and teams with limited operational maturity. This consolidation dynamic exerts pricing pressure on specialized observability vendors and forces them to demonstrate differentiated value through cross-cloud correlation, advanced analytics, and AI-driven automation that native cloud tools cannot easily replicate.
Covid-19 Impact:
The pandemic initially disrupted enterprise IT budgets and delayed observability platform deployments as organizations prioritized remote work enablement and business continuity over tooling investments. Mid-pandemic, accelerated digital transformation and the shift to distributed engineering teams drove rapid adoption of cloud-based observability solutions, as organizations required centralized visibility into application performance across increasingly fragmented infrastructure. Post-pandemic, the crisis permanently elevated the strategic importance of digital experience reliability, leading to sustained investment as enterprises recognized that observability platforms are essential for maintaining service quality and customer satisfaction in hybrid work environments.
The solutions segment is expected to be the largest during the forecast period
The solutions segment is expected to account for the largest market share during the forecast period, due to its role as the foundational layer that delivers application performance monitoring, log analytics, distributed tracing, and metrics capabilities across the software delivery lifecycle. Organizations invest primarily in software solutions before considering professional or managed services, while the recurring subscription model generates consistent revenue streams. As enterprises expand their cloud-native footprints and telemetry volumes, solution demand grows proportionally, thereby reinforcing this segment's dominant position throughout the forecast period.
The cloud-based segment is expected to have the highest CAGR during the forecast period
Over the forecast period, the cloud-based segment is predicted to witness the highest growth rate, driven by the scalability and accessibility advantages that SaaS delivery provides for distributed engineering teams managing dynamic cloud-native environments. Organizations increasingly favor cloud-based observability platforms because they eliminate infrastructure maintenance burdens, support elastic scaling during traffic fluctuations, and enable centralized visibility across multi-cloud deployments. As security frameworks mature and data residency concerns are addressed through regional offerings, adoption barriers continue to recede, which in turn accelerates migration from on-premises deployments and solidifies cloud-based delivery as the primary growth engine.
Region with largest share:
During the forecast period, the North America region is expected to hold the largest market share, due to the concentration of leading observability vendors and the region's advanced cloud-native adoption rates across enterprise software organizations. The United States dominates regional demand, supported by major technology companies and financial institutions that maintain mature DevOps practices and allocate substantial budgets to observability and AIOps initiatives. Strong venture capital investment in observability startups and favorable regulatory environments for cloud adoption further sustain North America's leadership position throughout the forecast period.
Region with highest CAGR:
Over the forecast period, the Asia Pacific region is anticipated to exhibit the highest CAGR, due to the rapid digital transformation initiatives and cloud-native adoption sweeping across China, India, and Southeast Asian economies. Government programs promoting cloud infrastructure investment and domestic technology development create favorable conditions for observability adoption, while the expanding e-commerce and fintech sectors generate substantial demand for application performance visibility. As local enterprises modernize their application architectures and seek to compete globally, the region's growth trajectory outpaces more mature markets.
Key players in the market
Some of the key players in Application Observability Market include Dynatrace, Inc., Datadog, Inc., New Relic, Inc., Cisco Systems, Inc., Splunk Inc., IBM Corporation, Elastic N.V., Grafana Labs, Honeycomb.io, Chronosphere, Inc., Sumo Logic, Inc., SolarWinds Corporation, LogicMonitor, Inc., Broadcom Inc., ServiceNow, Inc., Amazon Web Services, Inc., and Microsoft Corporation.
Key Developments:
In September 2026, Datadog launched Journey Monitoring and Bits Testing for its Digital Experience Monitoring suite, with Journey Monitoring consolidating conversion, traffic, and availability data for critical user flows while Bits Testing generates goal-based tests from plain-language prompts that adapt to interface changes.
In August 2026, Dynatrace signed a definitive agreement to acquire AI observability provider Arize, combining Arize's AI-native tracing, evaluation, and experimentation capabilities with Dynatrace's platform to create a foundation for full-lifecycle AI observability.
In July 2026, Honeycomb expanded its MCP integration to allow AI agents to create and update SLO Burn Alerts and reset SLO budgets, enabling automated observability-driven monitoring and alerting loops directly through agent workflows.
In June 2026, New Relic continued enhancing its intelligent observability platform with AI-powered investigation capabilities, building on its Autopilot automation for incident response and root cause analysis across distributed application environments.
Components Covered:
• Solutions
• Services
Deployment Modes Covered:
• Cloud-Based
• On-Premises
Organization Sizes Covered:
• Small and Medium Enterprises (SMEs)
• Large Enterprises
Applications Covered:
• Application Performance Optimization
• Root Cause Analysis and Troubleshooting
• Incident Detection and Management
• Cloud-Native Application Monitoring
• Microservices and Container Monitoring
• Digital Experience Monitoring
• Other Applications
End Users Covered:
• Banking, Financial Services and Insurance (BFSI)
• IT and Telecommunications
• Healthcare and Life Sciences
• Retail and E-commerce
• Manufacturing
• Government and Public Sector
• Media and Entertainment
• Other End Users
Regions Covered:
• North America
o United States
o Canada
o Mexico
• Europe
o United Kingdom
o Germany
o France
o Italy
o Spain
o Netherlands
o Belgium
o Sweden
o Switzerland
o Poland
o Rest of Europe
• Asia Pacific
o China
o Japan
o India
o South Korea
o Australia
o Indonesia
o Thailand
o Malaysia
o Singapore
o Vietnam
o Rest of Asia Pacific
• South America
o Brazil
o Argentina
o Colombia
o Chile
o Peru
o Rest of South America
• Rest of the World (RoW)
o Middle East
§ Saudi Arabia
§ United Arab Emirates
§ Qatar
§ Israel
§ Rest of Middle East
o Africa
§ South Africa
§ Egypt
§ Morocco
§ Rest of Africa
What our report offers:
- Market share assessments for the regional and country-level segments
- Strategic recommendations for the new entrants
- Covers Market data for the years 2023, 2024, 2025, 2026, 2027, 2028, 2030, 2032 and 2034
- Market Trends (Drivers, Constraints, Opportunities, Threats, Challenges, Investment Opportunities, and recommendations)
- Strategic recommendations in key business segments based on the market estimations
- Competitive landscaping mapping the key common trends
- Company profiling with detailed strategies, financials, and recent developments
- Supply chain trends mapping the latest technological advancements
Free Customization Offerings:
All the customers of this report will be entitled to receive one of the following free customization options:
• Company Profiling
o Comprehensive profiling of additional market players (up to 3)
o SWOT Analysis of key players (up to 3)
• Regional Segmentation
o Market estimations, Forecasts and CAGR of any prominent country as per the client's interest (Note: Depends on feasibility check)
• Competitive Benchmarking
o Benchmarking of key players based on product portfolio, geographical presence, and strategic alliances
Table of Contents
1 Executive Summary1.1 Market Snapshot and Key Highlights
1.2 Growth Drivers, Challenges, and Opportunities
1.3 Competitive Landscape Overview
1.4 Strategic Insights and Recommendations
2 Research Framework
2.1 Study Objectives and Scope
2.2 Stakeholder Analysis
2.3 Research Assumptions and Limitations
2.4 Research Methodology
2.4.1 Data Collection (Primary and Secondary)
2.4.2 Data Modeling and Estimation Techniques
2.4.3 Data Validation and Triangulation
2.4.4 Analytical and Forecasting Approach
3 Market Dynamics and Trend Analysis
3.1 Market Definition and Structure
3.2 Key Market Drivers
3.3 Market Restraints and Challenges
3.4 Growth Opportunities and Investment Hotspots
3.5 Industry Threats and Risk Assessment
3.6 Technology and Innovation Landscape
3.7 Emerging and High-Growth Markets
3.8 Regulatory and Policy Environment
3.9 Impact of COVID-19 and Recovery Outlook
4 Competitive and Strategic Assessment
4.1 Porter's Five Forces Analysis
4.1.1 Supplier Bargaining Power
4.1.2 Buyer Bargaining Power
4.1.3 Threat of Substitutes
4.1.4 Threat of New Entrants
4.1.5 Competitive Rivalry
4.2 Market Share Analysis of Key Players
4.3 Product Benchmarking and Performance Comparison
5 Global Application Observability Market, By Component
5.1 Solutions
5.1.1 Application Performance Monitoring (APM)
5.1.2 Log Management and Analytics
5.1.3 Distributed Tracing
5.1.4 Metrics Monitoring and Analytics
5.2 Services
5.2.1 Professional Services
5.2.2 Managed Services
6 Global Application Observability Market, By Deployment Mode
6.1 Cloud-Based
6.2 On-Premises
7 Global Application Observability Market, By Organization Size
7.1 Small and Medium Enterprises (SMEs)
7.2 Large Enterprises
8 Global Application Observability Market, By Application
8.1 Application Performance Optimization
8.2 Root Cause Analysis and Troubleshooting
8.3 Incident Detection and Management
8.4 Cloud-Native Application Monitoring
8.5 Microservices and Container Monitoring
8.6 Digital Experience Monitoring
8.7 Other Applications
9 Global Application Observability Market, By End User
9.1 Banking, Financial Services and Insurance (BFSI)
9.2 IT and Telecommunications
9.3 Healthcare and Life Sciences
9.4 Retail and E-commerce
9.5 Manufacturing
9.6 Government and Public Sector
9.7 Media and Entertainment
9.8 Other End Users
10 Global Application Observability Market, By Geography
10.1 North America
10.1.1 United States
10.1.2 Canada
10.1.3 Mexico
10.2 Europe
10.2.1 United Kingdom
10.2.2 Germany
10.2.3 France
10.2.4 Italy
10.2.5 Spain
10.2.6 Netherlands
10.2.7 Belgium
10.2.8 Sweden
10.2.9 Switzerland
10.2.10 Poland
10.2.11 Rest of Europe
10.3 Asia Pacific
10.3.1 China
10.3.2 Japan
10.3.3 India
10.3.4 South Korea
10.3.5 Australia
10.3.6 Indonesia
10.3.7 Thailand
10.3.8 Malaysia
10.3.9 Singapore
10.3.10 Vietnam
10.3.11 Rest of Asia Pacific
10.4 South America
10.4.1 Brazil
10.4.2 Argentina
10.4.3 Colombia
10.4.4 Chile
10.4.5 Peru
10.4.6 Rest of South America
10.5 Rest of the World (RoW)
10.5.1 Middle East
10.5.1.1 Saudi Arabia
10.5.1.2 United Arab Emirates
10.5.1.3 Qatar
10.5.1.4 Israel
10.5.1.5 Rest of Middle East
10.5.2 Africa
10.5.2.1 South Africa
10.5.2.2 Egypt
10.5.2.3 Morocco
10.5.2.4 Rest of Africa
11 Strategic Market Intelligence
11.1 Industry Value Network and Supply Chain Assessment
11.2 White-Space and Opportunity Mapping
11.3 Product Evolution and Market Life Cycle Analysis
11.4 Channel, Distributor, and Go-to-Market Assessment
12 Industry Developments and Strategic Initiatives
12.1 Mergers and Acquisitions
12.2 Partnerships, Alliances, and Joint Ventures
12.3 New Product Launches and Certifications
12.4 Capacity Expansion and Investments
12.5 Other Strategic Initiatives
13 Company Profiles
13.1 Dynatrace, Inc.
13.2 Datadog, Inc.
13.3 New Relic, Inc.
13.4 Cisco Systems, Inc.
13.5 Splunk Inc.
13.6 IBM Corporation
13.7 Elastic N.V.
13.8 Grafana Labs
13.9 Honeycomb.io
13.10 Chronosphere, Inc.
13.11 Sumo Logic, Inc.
13.12 SolarWinds Corporation
13.13 LogicMonitor, Inc.
13.13 Broadcom Inc.
13.15 ServiceNow, Inc.
13.16 Amazon Web Services, Inc.
13.17 Microsoft Corporation
List of Tables
1 Global Application Observability Market Outlook, By Region (2023-2034) ($MN)
2 Global Application Observability Market Outlook, By Component (2023-2034) ($MN)
3 Global Application Observability Market Outlook, By Solutions (2023-2034) ($MN)
4 Global Application Observability Market Outlook, By Application Performance Monitoring (APM) (2023-2034) ($MN)
5 Global Application Observability Market Outlook, By Log Management and Analytics (2023-2034) ($MN)
6 Global Application Observability Market Outlook, By Distributed Tracing (2023-2034) ($MN)
7 Global Application Observability Market Outlook, By Metrics Monitoring and Analytics (2023-2034) ($MN)
8 Global Application Observability Market Outlook, By Services (2023-2034) ($MN)
9 Global Application Observability Market Outlook, By Professional Services (2023-2034) ($MN)
10 Global Application Observability Market Outlook, By Managed Services (2023-2034) ($MN)
11 Global Application Observability Market Outlook, By Deployment Mode (2023-2034) ($MN)
12 Global Application Observability Market Outlook, By Cloud-Based (2023-2034) ($MN)
13 Global Application Observability Market Outlook, By On-Premises (2023-2034) ($MN)
14 Global Application Observability Market Outlook, By Organization Size (2023-2034) ($MN)
15 Global Application Observability Market Outlook, By Small and Medium Enterprises (SMEs) (2023-2034) ($MN)
16 Global Application Observability Market Outlook, By Large Enterprises (2023-2034) ($MN)
17 Global Application Observability Market Outlook, By Application (2023-2034) ($MN)
18 Global Application Observability Market Outlook, By Application Performance Optimization (2023-2034) ($MN)
19 Global Application Observability Market Outlook, By Root Cause Analysis and Troubleshooting (2023-2034) ($MN)
20 Global Application Observability Market Outlook, By Incident Detection and Management (2023-2034) ($MN)
21 Global Application Observability Market Outlook, By Cloud-Native Application Monitoring (2023-2034) ($MN)
22 Global Application Observability Market Outlook, By Microservices and Container Monitoring (2023-2034) ($MN)
23 Global Application Observability Market Outlook, By Digital Experience Monitoring (2023-2034) ($MN)
24 Global Application Observability Market Outlook, By Other Applications (2023-2034) ($MN)
25 Global Application Observability Market Outlook, By End User (2023-2034) ($MN)
26 Global Application Observability Market Outlook, By Banking, Financial Services and Insurance (BFSI) (2023-2034) ($MN)
27 Global Application Observability Market Outlook, By IT and Telecommunications (2023-2034) ($MN)
28 Global Application Observability Market Outlook, By Healthcare and Life Sciences (2023-2034) ($MN)
29 Global Application Observability Market Outlook, By Retail and E-commerce (2023-2034) ($MN)
30 Global Application Observability Market Outlook, By Manufacturing (2023-2034) ($MN)
31 Global Application Observability Market Outlook, By Government and Public Sector (2023-2034) ($MN)
32 Global Application Observability Market Outlook, By Media and Entertainment (2023-2034) ($MN)
33 Global Application Observability Market Outlook, By Other End Users (2023-2034) ($MN)
Note: Tables for North America, Europe, APAC, South America, and Rest of the World (RoW) Regions are also represented in the same manner as above.
List of Figures
RESEARCH METHODOLOGY
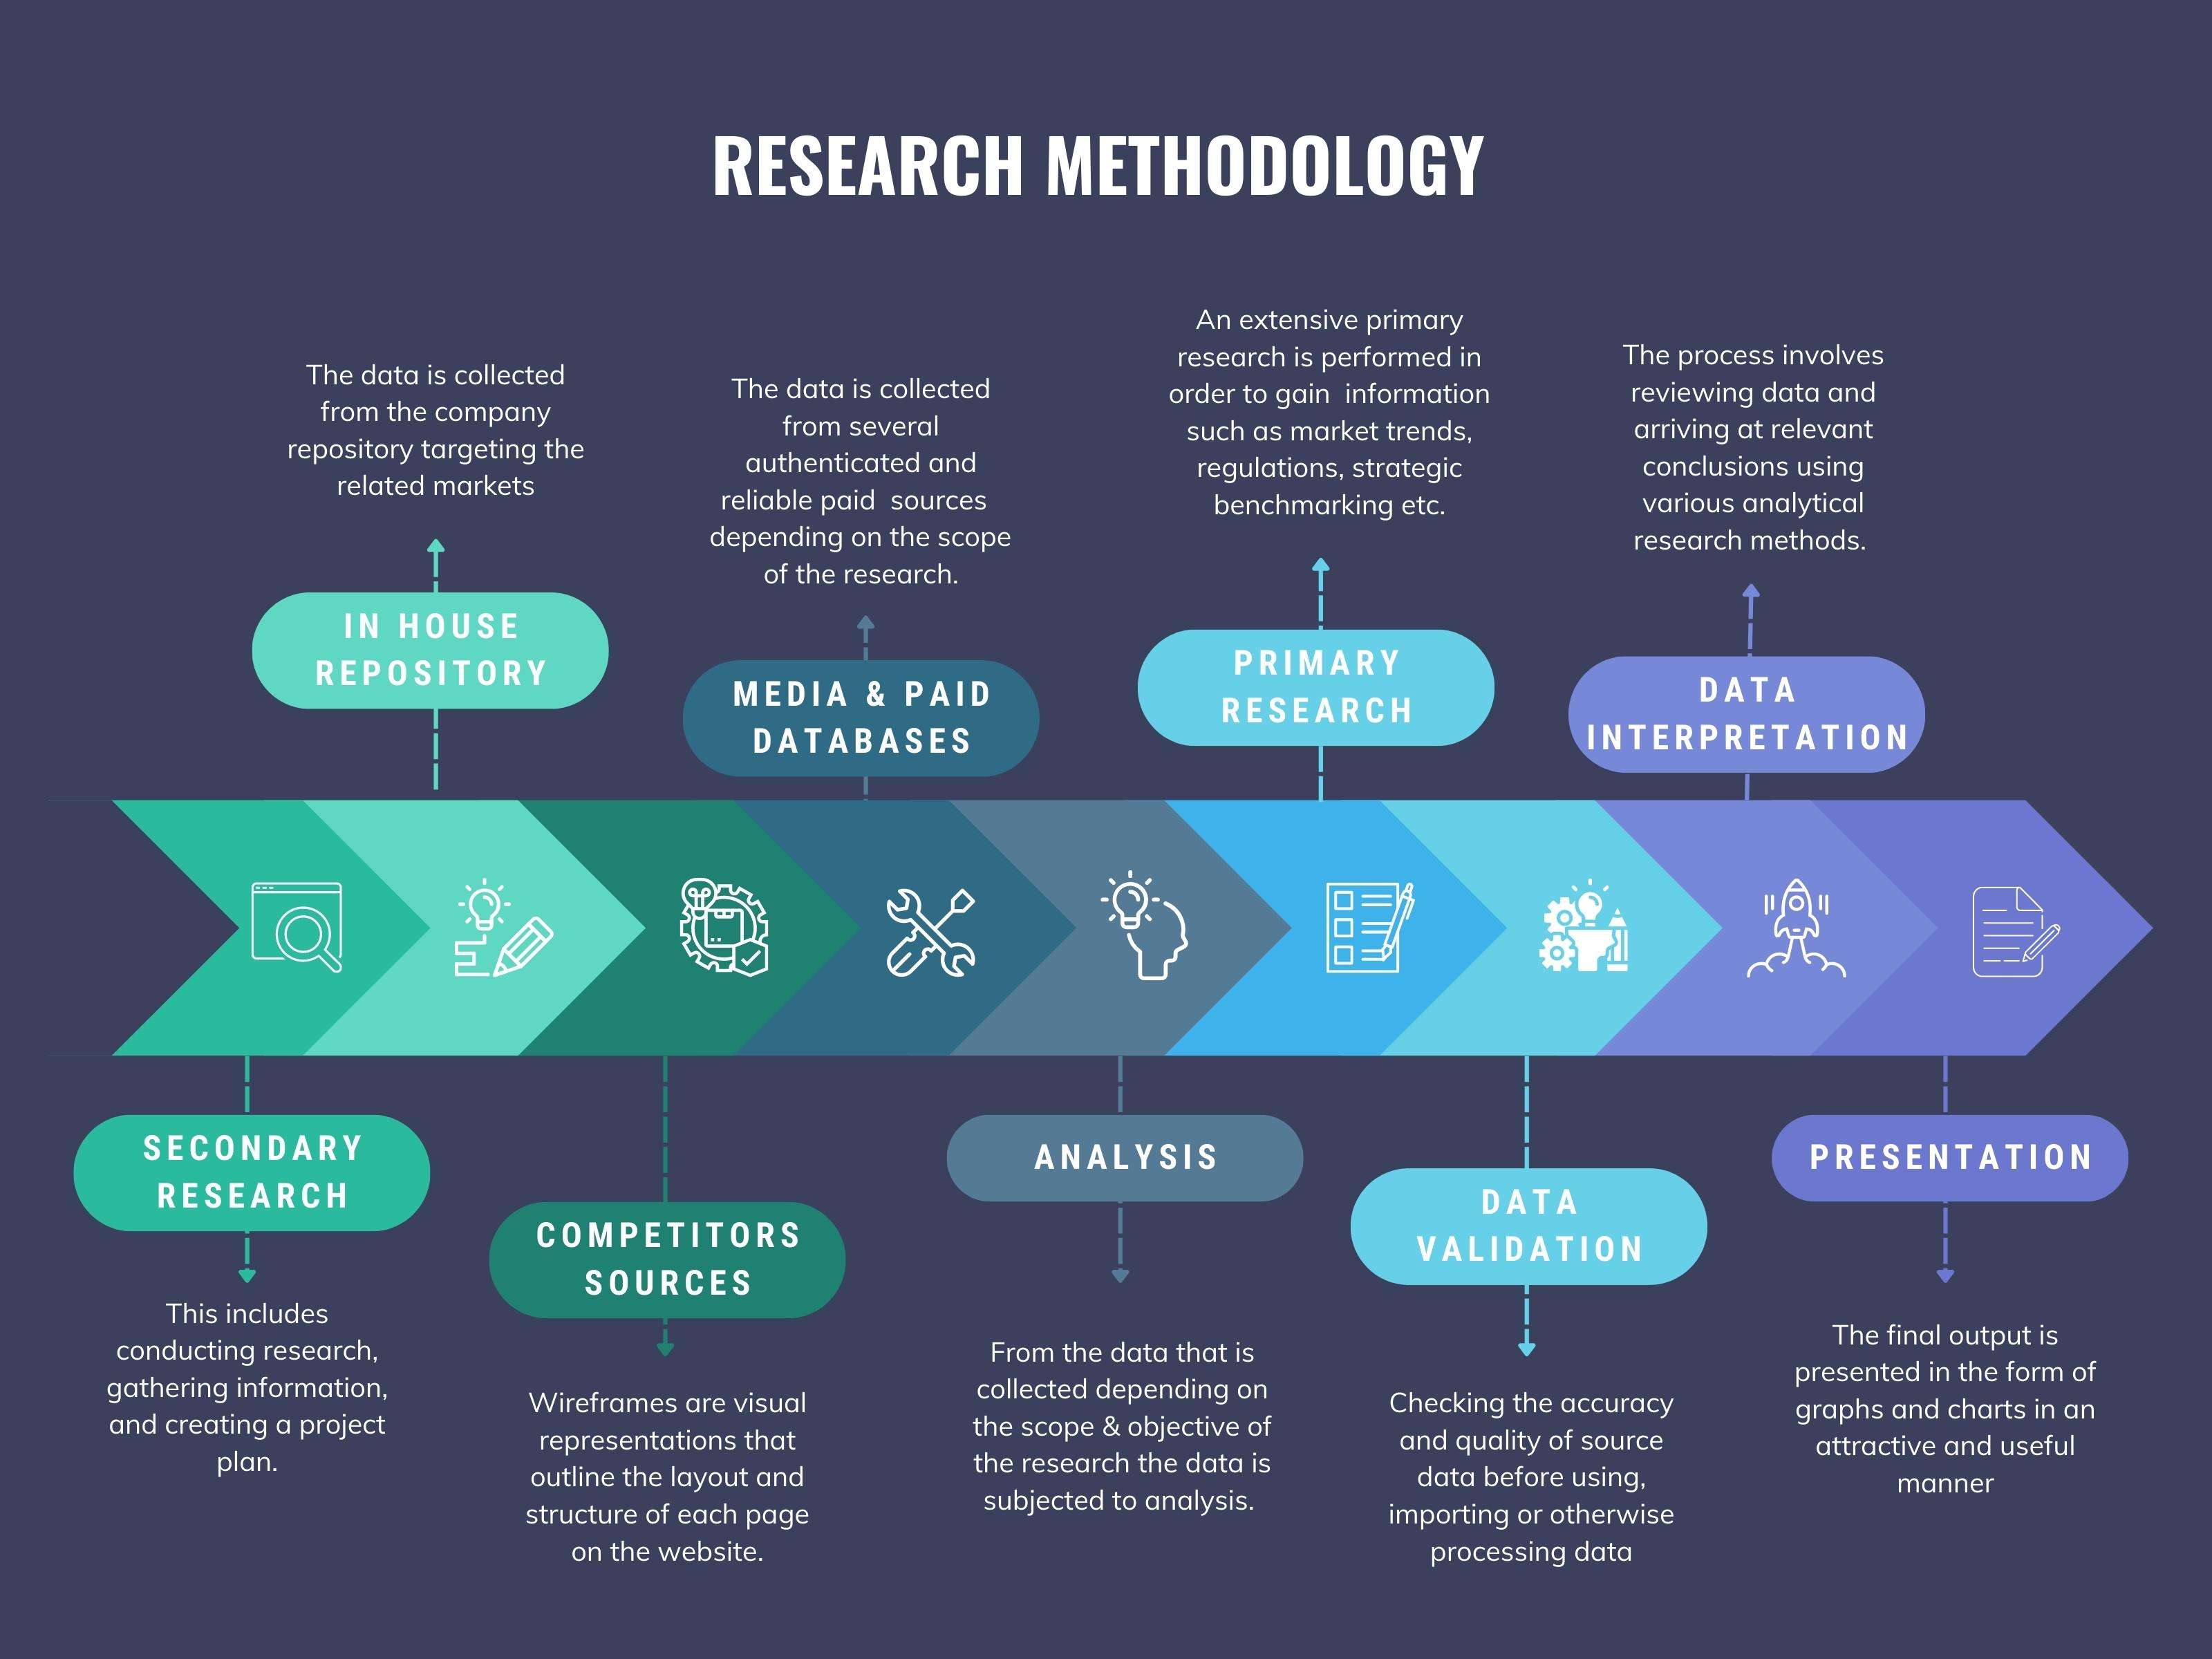
We at ‘Stratistics’ opt for an extensive research approach which involves data mining, data validation, and data analysis. The various research sources include in-house repository, secondary research, competitor’s sources, social media research, client internal data, and primary research.
Our team of analysts prefers the most reliable and authenticated data sources in order to perform the comprehensive literature search. With access to most of the authenticated data bases our team highly considers the best mix of information through various sources to obtain extensive and accurate analysis.
Each report takes an average time of a month and a team of 4 industry analysts. The time may vary depending on the scope and data availability of the desired market report. The various parameters used in the market assessment are standardized in order to enhance the data accuracy.
Data Mining
The data is collected from several authenticated, reliable, paid and unpaid sources and is filtered depending on the scope & objective of the research. Our reports repository acts as an added advantage in this procedure. Data gathering from the raw material suppliers, distributors and the manufacturers is performed on a regular basis, this helps in the comprehensive understanding of the products value chain. Apart from the above mentioned sources the data is also collected from the industry consultants to ensure the objective of the study is in the right direction.
Market trends such as technological advancements, regulatory affairs, market dynamics (Drivers, Restraints, Opportunities and Challenges) are obtained from scientific journals, market related national & international associations and organizations.
Data Analysis
From the data that is collected depending on the scope & objective of the research the data is subjected for the analysis. The critical steps that we follow for the data analysis include:
- Product Lifecycle Analysis
- Competitor analysis
- Risk analysis
- Porters Analysis
- PESTEL Analysis
- SWOT Analysis
The data engineering is performed by the core industry experts considering both the Marketing Mix Modeling and the Demand Forecasting. The marketing mix modeling makes use of multiple-regression techniques to predict the optimal mix of marketing variables. Regression factor is based on a number of variables and how they relate to an outcome such as sales or profits.
Data Validation
The data validation is performed by the exhaustive primary research from the expert interviews. This includes telephonic interviews, focus groups, face to face interviews, and questionnaires to validate our research from all aspects. The industry experts we approach come from the leading firms, involved in the supply chain ranging from the suppliers, distributors to the manufacturers and consumers so as to ensure an unbiased analysis.
We are in touch with more than 15,000 industry experts with the right mix of consultants, CEO's, presidents, vice presidents, managers, experts from both supply side and demand side, executives and so on.
The data validation involves the primary research from the industry experts belonging to:
- Leading Companies
- Suppliers & Distributors
- Manufacturers
- Consumers
- Industry/Strategic Consultants
Apart from the data validation the primary research also helps in performing the fill gap research, i.e. providing solutions for the unmet needs of the research which helps in enhancing the reports quality.
For more details about research methodology, kindly write to us at info@strategymrc.com
Frequently Asked Questions
In case of any queries regarding this report, you can contact the customer service by filing the “Inquiry Before Buy” form available on the right hand side. You may also contact us through email: info@strategymrc.com or phone: +1-301-202-5929
Yes, the samples are available for all the published reports. You can request them by filling the “Request Sample” option available in this page.
Yes, you can request a sample with your specific requirements. All the customized samples will be provided as per the requirement with the real data masked.
All our reports are available in Digital PDF format. In case if you require them in any other formats, such as PPT, Excel etc you can submit a request through “Inquiry Before Buy” form available on the right hand side. You may also contact us through email: info@strategymrc.com or phone: +1-301-202-5929
We offer a free 15% customization with every purchase. This requirement can be fulfilled for both pre and post sale. You may send your customization requirements through email at info@strategymrc.com or call us on +1-301-202-5929.
We have 3 different licensing options available in electronic format.
- Single User Licence: Allows one person, typically the buyer, to have access to the ordered product. The ordered product cannot be distributed to anyone else.
- 2-5 User Licence: Allows the ordered product to be shared among a maximum of 5 people within your organisation.
- Corporate License: Allows the product to be shared among all employees of your organisation regardless of their geographical location.
All our reports are typically be emailed to you as an attachment.
To order any available report you need to register on our website. The payment can be made either through CCAvenue or PayPal payments gateways which accept all international cards.
We extend our support to 6 months post sale. A post sale customization is also provided to cover your unmet needs in the report.
Request Customization
We offer complimentary customization of up to 15% with every purchase. To share your customization requirements, feel free to email us at info@strategymrc.com or call us on +1-301-202-5929. .
Please Note: Customization within the 15% threshold is entirely free of charge. If your request exceeds this limit, we will conduct a feasibility assessment. Following that, a detailed quote and timeline will be provided.
WHY CHOOSE US ?

Assured Quality
Best in class reports with high standard of research integrity

24X7 Research Support
Continuous support to ensure the best customer experience.

Free Customization
Adding more values to your product of interest.

Safe & Secure Access
Providing a secured environment for all online transactions.

Trusted by 600+ Brands
Serving the most reputed brands across the world.