
Application Security Market
Application Security Market Forecasts to 2028 – Global Analysis By Component (Services, Solution), Type (Mobile, Web), End User (Education,Healthcare), and By Geography

|
Years Covered |
2020-2028 |
|
Estimated Year Value (2021) |
US $7.21 BN |
|
Projected Year Value (2028) |
US $23.11 BN |
|
CAGR (2021 - 2028) |
18.1% |
|
Regions Covered |
North America, Europe, Asia Pacific, South America, and Middle East & Africa |
|
Countries Covered |
US, Canada, Mexico, Germany, UK, Italy, France, Spain, Japan, China, India, Australia, New Zealand, South Korea, Rest of Asia Pacific, South America, Argentina, Brazil, Chile, Middle East & Africa, Saudi Arabia, UAE, Qatar, and South Africa |
|
Largest Market |
Asia Pacific |
|
Fastest Growing Market |
North America |
According to Stratistics MRC, the Global Application Security Market is accounted for $7.21 billion in 2021 and is expected to reach $23.11 billion by 2028 growing at a CAGR of 18.1% during the forecast period. Application security is the method of securing applications by finding, fixing, and improving the security of apps. Various techniques are utilized to surface such security vulnerabilities at different stages of an application's lifecycle. Prevention, fixing, and detecting vulnerabilities are some of the tasks of application security.
Market Dynamics:
Driver:
Increasing security breaches
Security breaches keep on being a threat to consumers and enterprises. The foundation of digital infrastructure depends on communication between business-critical applications and data, which are shared across stages, devices, and users. Business applications hold basic organizational information and are the objective of cybercriminals. Common vulnerabilities and exposures database has more vulnerabilities in commonly utilized applications and the applications have no patches available. Even if patches are available then consumers and enterprises do not apply them, making cybercriminals more productive in breaking application codes. Attributable to the rise in this kind of security breach targeting business applications, organizations across the world are deploying application security solutions to safeguard web and mobile applications.
Restraint:
Budget constraints
Unused business-basic applications are harmful as they are not updated regularly. Many small and medium-sized enterprises accept that spending money on this kind of applications will cost the organization. The reason of which unused applications makes long-term security threats as it is not difficult to crack unused applications and get into the IT infrastructure regardless whether the application was business-critical or rarely used web application. Budget constraint and return on investment for small and medium-sized enterprises is restraining the growth of the application security market.
Opportunity:
Increasing adoption of technologies in web- and mobile-based security process
Application security covers web and mobile applications that pass through different phases of the security development life cycle; for instance, security design and security coding. Various artificial intelligence specific areas, such as machine learning and expert systems, can be utilized to further develop application security to derive, predict, or apply inferences to forecast security threats, and identify security vulnerabilities and the security coding remediation guidance. Security auditors with the assistance of these innovations can automate attack threat identification and the code review process. Several organizations have adopted artificial intelligence and machine learning for application development programs.
Threat:
Unused web and mobile applications
Unused applications are the biggest challenge. It is often seen that customers and enterprises carry applications, which will be rarely utilized or will remain unused for a long time. This type of applications presents greater threats. The unused apps can still start a connection, scan files and photos, and upload sensitive information to their mother ship unknowingly. Hence, it is important to eliminate those applications and use applications security solutions to limit threats.
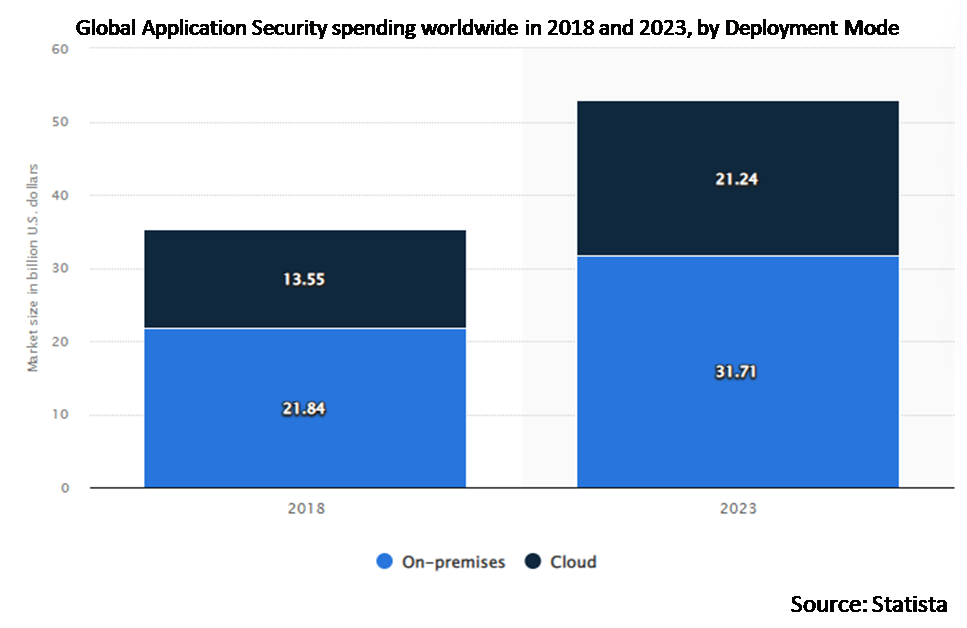
The cloud segment is expected to be the largest during the forecast period
The cloud segment is estimated to have a lucrative growth owing to the adoption of cloud computing among small and medium-scale enterprises. Several organizations are steadily moving towards cloud infrastructure, and this trend is likely to grow in the coming years. The high growth rate of this segment is attributed to its ease of adoption, minimal requirement of in-house infrastructure, scalability, and easy installation of security solutions.
The banking, financial services and insurance (BFSI) segment is expected to have the highest CAGR during the forecast period
The banking, financial services and insurance (BFSI) segment is anticipated to witness the fastest CAGR growth during the forecast period as banks and financial institutions store and handle large amounts of sensitive customer financial data, such as payment information, money transaction details, credit card/debit card details, account numbers, and trading transactions.
Region with highest share:
Asia Pacific is projected to hold the largest market share during the forecast period due to increasing adoption of technologies, such as AI and IoT. Additionally, the increasing significance of web security & privacy concerns, developing web & mobile infrastructure, and the growing threat of cyberattacks are likely to boost the market growth in the region. Because of the low budget for cybersecurity organizations in this region make more utilize of open source applications for security testing purposes, which have high potential infringement issues, operational risks, and malpractices.
Region with highest CAGR:
North America is projected to have the highest CAGR over the forecast period owing to the proliferation of mobile devices and rise in cloud based networking along with the presence of major key players. The government authorities in the region are also working to decrease cybercrimes in the region. The government influence also encourages the use of application security solutions.

Key players in the market
Some of the key players profiled in the High Voltage Cables Market include Sumitomo Electric Industries, Ltd., TELE-FONIKA Kable S.A. , NKT Cables, Southwire Company, LLC, HITACHI, LTD., Siemens AG , Prysmian group, Nexans, Dubai Cable Company Pvt. Ltd. and TBEA Co. Ltd.
Key Developments:
In Feb 2021, Qualys introduced Qualys SaaS Detection and Response (SaaSDR) to further its offerings in the application security platform for SaaS applications. Qualys SaaSDR helps ImagineX with our Microsoft Office 365 and Google Workspace deployments' security and compliance.
In September 2020, MicroFocus launched Hybrid Cloud Management X, designed to simplify the delivery of multi-cloud services. The offering is a cloud-native, multi-tenant management platform that can run in the public cloud or on-premises.
Deployment Modes Covered:
• On-Premise
• Cloud
Components Covered:
• Services
• Solution
• Software Tools
Organization Sizes Covered:
• Large Enterprises
• Small and Medium-Sized Enterprises
Types Covered:
• Mobile Application Security
• Web Application Security
End Users Covered:
• Transportation & Logistics
• Retail & E-commerce
• Media & Entertainment
• Education
• IT & Telecom
• Healthcare
• Government and Public Sector
• Energy & Utilities
• Defense
• Banking, Financial Services and Insurance (BFSI)
• Agriculture
• Manufacturing
Regions Covered:
• North America
o US
o Canada
o Mexico
• Europe
o Germany
o UK
o Italy
o France
o Spain
o Rest of Europe
• Asia Pacific
o Japan
o China
o India
o Australia
o New Zealand
o South Korea
o Rest of Asia Pacific
• South America
o Argentina
o Brazil
o Chile
o Rest of South America
• Middle East & Africa
o Saudi Arabia
o UAE
o Qatar
o South Africa
o Rest of Middle East & Africa
What our report offers:
- Market share assessments for the regional and country-level segments
- Strategic recommendations for the new entrants
- Covers Market data for the years 2020, 2021, 2022, 2025, and 2028
- Market Trends (Drivers, Constraints, Opportunities, Threats, Challenges, Investment Opportunities, and recommendations)
- Strategic recommendations in key business segments based on the market estimations
- Competitive landscaping mapping the key common trends
- Company profiling with detailed strategies, financials, and recent developments
- Supply chain trends mapping the latest technological advancements
Free Customization Offerings:
All the customers of this report will be entitled to receive one of the following free customization options:
• Company Profiling
o Comprehensive profiling of additional market players (up to 3)
o SWOT Analysis of key players (up to 3)
• Regional Segmentation
o Market estimations, Forecasts and CAGR of any prominent country as per the client's interest (Note: Depends on feasibility check)
• Competitive Benchmarking
o Benchmarking of key players based on product portfolio, geographical presence, and strategic alliances
Table of Contents
1 Executive Summary
2 Preface
2.1 Abstract
2.2 Stake Holders
2.3 Research Scope
2.4 Research Methodology
2.4.1 Data Mining
2.4.2 Data Analysis
2.4.3 Data Validation
2.4.4 Research Approach
2.5 Research Sources
2.5.1 Primary Research Sources
2.5.2 Secondary Research Sources
2.5.3 Assumptions
3 Market Trend Analysis
3.1 Introduction
3.2 Drivers
3.3 Restraints
3.4 Opportunities
3.5 Threats
3.6 End User Analysis
3.7 Emerging Markets
3.8 Impact of Covid-19
4 Porters Five Force Analysis
4.1 Bargaining power of suppliers
4.2 Bargaining power of buyers
4.3 Threat of substitutes
4.4 Threat of new entrants
4.5 Competitive rivalry
5 Global Application Security Market, By Deployment Mode
5.1 Introduction
5.2 On-Premise
5.3 Cloud
6 Global Application Security Market, By Component
6.1 Introduction
6.2 Services
6.2.1 Managed Services
6.2.2 Professional Services
6.2.2.1 Training and education
6.2.2.2 Integration and maintenance
6.2.2.3 Consulting services
6.3 Solution
6.4 Software Tools
6.4.1 Static Application Security Testing (SAST)
6.4.2 Dynamic Application Security Testing (DAST)
6.4.3 Serverless Protection
6.4.4 Runtime Application Self-Protection (RASP)
6.4.5 Interactive Application Security Testing (IAST)
6.4.6 Software Composition Analysis (SCA)
7 Global Application Security Market, By Organization Size
7.1 Introduction
7.2 Large Enterprises
7.3 Small and Medium-Sized Enterprises
8 Global Application Security Market, By Type
8.1 Introduction
8.2 Mobile Application Security
8.3 Web Application Security
9 Global Application Security Market, By End User
9.1 Introduction
9.2 Transportation & Logistics
9.3 Retail & E-commerce
9.4 Media & Entertainment
9.5 Education
9.6 IT & Telecom
9.7 Healthcare
9.8 Government and Public Sector
9.9 Energy & Utilities
9.10 Defense
9.11 Banking, Financial Services and Insurance (BFSI)
9.12 Agriculture
9.13 Manufacturing
10 Global Application Security Market, By Geography
10.1 Introduction
10.2 North America
10.2.1 US
10.2.2 Canada
10.2.3 Mexico
10.3 Europe
10.3.1 Germany
10.3.2 UK
10.3.3 Italy
10.3.4 France
10.3.5 Spain
10.3.6 Rest of Europe
10.4 Asia Pacific
10.4.1 Japan
10.4.2 China
10.4.3 India
10.4.4 Australia
10.4.5 New Zealand
10.4.6 South Korea
10.4.7 Rest of Asia Pacific
10.5 South America
10.5.1 Argentina
10.5.2 Brazil
10.5.3 Chile
10.5.4 Rest of South America
10.6 Middle East & Africa
10.6.1 Saudi Arabia
10.6.2 UAE
10.6.3 Qatar
10.6.4 South Africa
10.6.5 Rest of Middle East & Africa
11 Key Developments
11.1 Agreements, Partnerships, Collaborations and Joint Ventures
11.2 Acquisitions & Mergers
11.3 New Product Launch
11.4 Expansions
11.5 Other Key Strategies
12 Company Profiling
12.1 Contrast Security
12.2 WhiteHat Security
12.3 CAST Software
12.4 Veracode
12.5 Synopsys
12.6 Qualys
12.7 Onapsis
12.8 IBM Corporation
12.9 HCL Software
12.10 GitLab
12.11 Cisco Systems
12.12 MicroFocus
12.13 Checkmarx
12.14 Rapid7
12.15 Capgemini
12.16 VMware
List of Tables
1 Global Application Security Market Outlook, By Region (2020-2028) ($MN)
2 Global Application Security Market Outlook, By Deployment Mode (2020-2028) ($MN)
3 Global Application Security Market Outlook, By On-Premise (2020-2028) ($MN)
4 Global Application Security Market Outlook, By Cloud (2020-2028) ($MN)
5 Global Application Security Market Outlook, By Component (2020-2028) ($MN)
6 Global Application Security Market Outlook, By Services (2020-2028) ($MN)
7 Global Application Security Market Outlook, By Managed Services (2020-2028) ($MN)
8 Global Application Security Market Outlook, By Professional Services (2020-2028) ($MN)
9 Global Application Security Market Outlook, By Solution (2020-2028) ($MN)
10 Global Application Security Market Outlook, By Software Tools (2020-2028) ($MN)
11 Global Application Security Market Outlook, By Static Application Security Testing (SAST) (2020-2028) ($MN)
12 Global Application Security Market Outlook, By Dynamic Application Security Testing (DAST) (2020-2028) ($MN)
13 Global Application Security Market Outlook, By Serverless Protection (2020-2028) ($MN)
14 Global Application Security Market Outlook, By Runtime Application Self-Protection (RASP) (2020-2028) ($MN)
15 Global Application Security Market Outlook, By Interactive Application Security Testing (IAST) (2020-2028) ($MN)
16 Global Application Security Market Outlook, By Software Composition Analysis (SCA) (2020-2028) ($MN)
17 Global Application Security Market Outlook, By Organization Size (2020-2028) ($MN)
18 Global Application Security Market Outlook, By Large Enterprises (2020-2028) ($MN)
19 Global Application Security Market Outlook, By Small and Medium-Sized Enterprises (2020-2028) ($MN)
20 Global Application Security Market Outlook, By Type (2020-2028) ($MN)
21 Global Application Security Market Outlook, By Mobile Application Security (2020-2028) ($MN)
22 Global Application Security Market Outlook, By Web Application Security (2020-2028) ($MN)
23 Global Application Security Market Outlook, By End User (2020-2028) ($MN)
24 Global Application Security Market Outlook, By Transportation & Logistics (2020-2028) ($MN)
25 Global Application Security Market Outlook, By Retail & E-commerce (2020-2028) ($MN)
26 Global Application Security Market Outlook, By Media & Entertainment (2020-2028) ($MN)
27 Global Application Security Market Outlook, By Education (2020-2028) ($MN)
28 Global Application Security Market Outlook, By IT & Telecom (2020-2028) ($MN)
29 Global Application Security Market Outlook, By Healthcare (2020-2028) ($MN)
30 Global Application Security Market Outlook, By Government and Public Sector (2020-2028) ($MN)
31 Global Application Security Market Outlook, By Energy & Utilities (2020-2028) ($MN)
32 Global Application Security Market Outlook, By Defense (2020-2028) ($MN)
33 Global Application Security Market Outlook, By Banking, Financial Services and Insurance (BFSI) (2020-2028) ($MN)
34 Global Application Security Market Outlook, By Agriculture (2020-2028) ($MN)
35 Global Application Security Market Outlook, By Manufacturing (2020-2028) ($MN)
Note: Tables for North America, Europe, APAC, South America, and Middle East & Africa Regions are also represented in the same manner as above.
List of Figures
RESEARCH METHODOLOGY

We at ‘Stratistics’ opt for an extensive research approach which involves data mining, data validation, and data analysis. The various research sources include in-house repository, secondary research, competitor’s sources, social media research, client internal data, and primary research.
Our team of analysts prefers the most reliable and authenticated data sources in order to perform the comprehensive literature search. With access to most of the authenticated data bases our team highly considers the best mix of information through various sources to obtain extensive and accurate analysis.
Each report takes an average time of a month and a team of 4 industry analysts. The time may vary depending on the scope and data availability of the desired market report. The various parameters used in the market assessment are standardized in order to enhance the data accuracy.
Data Mining
The data is collected from several authenticated, reliable, paid and unpaid sources and is filtered depending on the scope & objective of the research. Our reports repository acts as an added advantage in this procedure. Data gathering from the raw material suppliers, distributors and the manufacturers is performed on a regular basis, this helps in the comprehensive understanding of the products value chain. Apart from the above mentioned sources the data is also collected from the industry consultants to ensure the objective of the study is in the right direction.
Market trends such as technological advancements, regulatory affairs, market dynamics (Drivers, Restraints, Opportunities and Challenges) are obtained from scientific journals, market related national & international associations and organizations.
Data Analysis
From the data that is collected depending on the scope & objective of the research the data is subjected for the analysis. The critical steps that we follow for the data analysis include:
- Product Lifecycle Analysis
- Competitor analysis
- Risk analysis
- Porters Analysis
- PESTEL Analysis
- SWOT Analysis
The data engineering is performed by the core industry experts considering both the Marketing Mix Modeling and the Demand Forecasting. The marketing mix modeling makes use of multiple-regression techniques to predict the optimal mix of marketing variables. Regression factor is based on a number of variables and how they relate to an outcome such as sales or profits.
Data Validation
The data validation is performed by the exhaustive primary research from the expert interviews. This includes telephonic interviews, focus groups, face to face interviews, and questionnaires to validate our research from all aspects. The industry experts we approach come from the leading firms, involved in the supply chain ranging from the suppliers, distributors to the manufacturers and consumers so as to ensure an unbiased analysis.
We are in touch with more than 15,000 industry experts with the right mix of consultants, CEO's, presidents, vice presidents, managers, experts from both supply side and demand side, executives and so on.
The data validation involves the primary research from the industry experts belonging to:
- Leading Companies
- Suppliers & Distributors
- Manufacturers
- Consumers
- Industry/Strategic Consultants
Apart from the data validation the primary research also helps in performing the fill gap research, i.e. providing solutions for the unmet needs of the research which helps in enhancing the reports quality.
For more details about research methodology, kindly write to us at info@strategymrc.com
Frequently Asked Questions
In case of any queries regarding this report, you can contact the customer service by filing the “Inquiry Before Buy” form available on the right hand side. You may also contact us through email: info@strategymrc.com or phone: +1-301-202-5929
Yes, the samples are available for all the published reports. You can request them by filling the “Request Sample” option available in this page.
Yes, you can request a sample with your specific requirements. All the customized samples will be provided as per the requirement with the real data masked.
All our reports are available in Digital PDF format. In case if you require them in any other formats, such as PPT, Excel etc you can submit a request through “Inquiry Before Buy” form available on the right hand side. You may also contact us through email: info@strategymrc.com or phone: +1-301-202-5929
We offer a free 15% customization with every purchase. This requirement can be fulfilled for both pre and post sale. You may send your customization requirements through email at info@strategymrc.com or call us on +1-301-202-5929.
We have 3 different licensing options available in electronic format.
- Single User Licence: Allows one person, typically the buyer, to have access to the ordered product. The ordered product cannot be distributed to anyone else.
- 2-5 User Licence: Allows the ordered product to be shared among a maximum of 5 people within your organisation.
- Corporate License: Allows the product to be shared among all employees of your organisation regardless of their geographical location.
All our reports are typically be emailed to you as an attachment.
To order any available report you need to register on our website. The payment can be made either through CCAvenue or PayPal payments gateways which accept all international cards.
We extend our support to 6 months post sale. A post sale customization is also provided to cover your unmet needs in the report.
Request Customization
We offer complimentary customization of up to 15% with every purchase. To share your customization requirements, feel free to email us at info@strategymrc.com or call us on +1-301-202-5929. .
Please Note: Customization within the 15% threshold is entirely free of charge. If your request exceeds this limit, we will conduct a feasibility assessment. Following that, a detailed quote and timeline will be provided.
WHY CHOOSE US ?

Assured Quality
Best in class reports with high standard of research integrity

24X7 Research Support
Continuous support to ensure the best customer experience.

Free Customization
Adding more values to your product of interest.

Safe & Secure Access
Providing a secured environment for all online transactions.

Trusted by 600+ Brands
Serving the most reputed brands across the world.