
Auto Personalization And Ux Platforms Market
Auto Personalization & UX Platforms Market Forecasts to 2034 - Global Analysis By Component (Software, Services and Hardware Integrations), Vehicle Type, Application and By Geography

|
Years Covered |
2023-2034 |
|
Estimated Year Value (2026) |
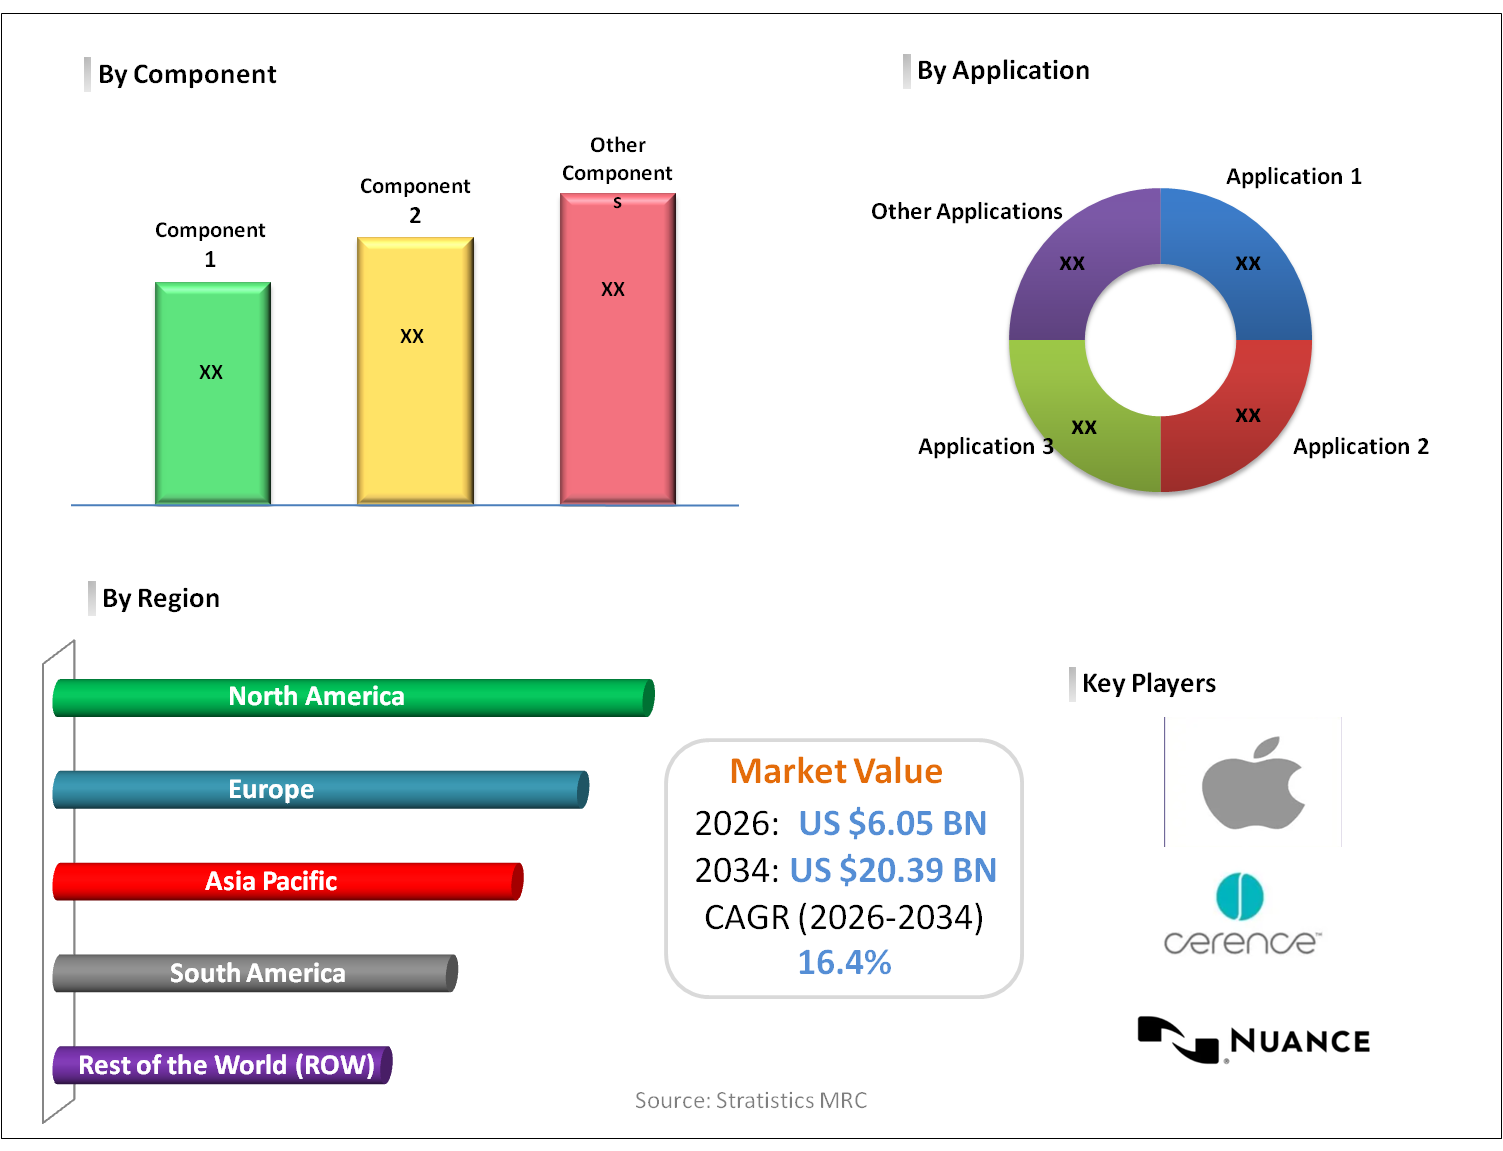
US $6.05 BN |
|
Projected Year Value (2034) |
US $20.39 BN |
|
CAGR (2026-2034) |
16.4% |
|
Regions Covered |
North America, Europe, Asia Pacific, South America, and Rest of the World (RoW) |
|
Countries Covered |
United States, Canada, Mexico, United Kingdom, Germany, France, Italy, Spain, Netherlands, Belgium, Sweden, Switzerland, Poland, Rest of Europe, China, Japan, India, South Korea, Australia, Indonesia, Thailand, Malaysia, Singapore, Vietnam, Rest of Asia Pacific, Brazil, Argentina, Colombia, Chile, Peru, Rest of South America, Saudi Arabia, United Arab Emirates, Qatar, Israel, Rest of Middle East, South Africa, Egypt, Morocco, and Rest of Africa. |
|
Largest Market |
North America |
|
Highest Growing Market |
Asia Pacific |
According to Stratistics MRC, the Global Auto Personalization & UX Platforms Market is accounted for $6.05 billion in 2026 and is expected to reach $20.39 billion by 2034 growing at a CAGR of 16.4% during the forecast period. Auto Personalization & UX Platforms empower organizations to create individualized digital interactions through the use of AI-driven insights and behavioral data analysis. They monitor user activity across multiple channels, including web and mobile platforms, to adjust content, product suggestions, and interface designs based on unique user needs. By streamlining navigation and enhancing engagement, these solutions boost conversions, strengthen customer relationships, and elevate satisfaction levels. Capabilities like predictive analytics, experimentation tools, and adaptive content delivery support ongoing optimization. In an increasingly competitive digital landscape, such platforms are essential for improving usability, fostering loyalty, and maximizing long-term customer value.
According to PwC’s Consumer Intelligence Series, 59% of global consumers feel companies have lost touch with the human element of customer experience, which drives the need for AI-driven UX personalization to restore relevance and trust.
Market Dynamics:
Driver:
Rising demand for personalized customer experiences
The growing expectation among customers for individualized online experiences is accelerating the expansion of the Auto Personalization & UX Platforms market. Today’s users favor companies that can anticipate their needs by analyzing behavior, preferences, and past transactions to provide timely, relevant content. Enterprises are adopting sophisticated personalization tools to boost engagement, elevate satisfaction, and build stronger brand connections. Tailored digital journeys enhance conversion performance while lowering abandonment and attrition rates. With digital markets becoming more competitive, businesses view personalized engagement as a key differentiator that supports retention strategies and sustainable revenue development, encouraging broader implementation of advanced UX solutions.
Restraint:
High implementation and maintenance costs
Elevated financial commitments and resource demands impede growth in the Auto Personalization & UX Platforms market. Implementing these solutions involves expenses for sophisticated software, integration frameworks, cloud services, and specialized talent. Continuous costs for updates, cybersecurity measures, and performance optimization add to the economic pressure. Smaller organizations, in particular, may struggle to justify such investments due to limited budgets. Concerns about achieving measurable returns often result in cautious adoption decisions. The considerable capital and operational resources required for effective deployment therefore act as a limiting factor for broader market penetration and long-term scalability.
Opportunity:
Increasing focus on customer experience differentiation
The growing strategic importance of user-focused engagement provides strong growth opportunities within the personalization platform market. Enterprises increasingly view exceptional digital experiences as a core factor influencing customer retention and revenue expansion. Advanced UX solutions empower organizations to craft intuitive interfaces and emotionally resonant interactions. Data-driven refinement of touchpoints strengthens relationships and enhances brand loyalty. In competitive environments, delivering distinctive and seamless experiences becomes a critical advantage. As more businesses adopt customer-centric transformation strategies, investment in sophisticated personalization technologies is expected to rise, supporting sustained market development and innovation.
Threat:
Intensifying market competition and platform saturation
Increasing rivalry and market crowding threaten growth prospects within the Auto Personalization & UX Platforms sector. A surge in vendors delivering comparable personalization technologies has intensified pricing competition and margin constraints. Emerging companies frequently launch feature-rich solutions at competitive rates, compelling established firms to accelerate innovation spending. In mature markets, limited differentiation and high provider density make it harder to secure new clients. The heightened contest for market share may drive mergers and aggressive sales tactics, reducing profitability and stability. Such sustained competitive pressure can restrict expansion opportunities and challenge long-term strategic positioning for technology providers.
Covid-19 Impact:
The outbreak of COVID-19 reshaped the Auto Personalization & UX Platforms market by intensifying reliance on digital engagement strategies. As physical interactions declined, organizations prioritized online platforms to sustain operations and customer relationships. This shift increased investment in advanced personalization technologies to accommodate evolving user preferences and surging digital transactions. While financial pressures initially limited spending for some businesses, the overall need for adaptive and data-driven experiences grew substantially. The crisis highlighted the value of agile digital infrastructure, reinforcing long-term commitment to personalization solutions that enhance customer satisfaction, strengthen loyalty, and support business continuity in uncertain environments.
The software segment is expected to be the largest during the forecast period
The software segment is expected to account for the largest market share during the forecast period due to increasing reliance on intelligent personalization applications and analytics-driven systems. Businesses favor robust software solutions that facilitate dynamic content delivery, user behaviour analysis, and customized digital interactions. Cloud-native architectures enhance scalability and simplify integration with existing enterprise systems, making software solutions highly attractive. As companies focus on improving customer journeys and strengthening online engagement, investments in advanced personalization software remain strong. Ongoing enhancements in automation, machine learning, and data intelligence further solidify software’s leading role in the overall market structure.
The autonomous vehicles segment is expected to have the highest CAGR during the forecast period
Over the forecast period, the autonomous vehicles segment is predicted to witness the highest growth rate, driven by expanding integration of intelligent mobility solutions and digital cockpit innovations. Self-driving vehicles depend on sophisticated data processing and AI-based systems to deliver adaptive, user-centric experiences. Personalized infotainment, predictive assistance, and responsive interface technologies are becoming essential components of next-generation vehicles. Rising investments in connected transportation and advanced driver-assistance features continue to accelerate adoption. As automotive manufacturers emphasize enhanced passenger comfort and customized digital environments, autonomous vehicles emerge as the most rapidly expanding segment in this market.
Region with largest share:
During the forecast period, the North America region is expected to hold the largest market share due to its advanced digital ecosystem and strong focus on innovation. Businesses in the region rapidly adopt AI-driven personalization tools and cloud-enabled experience platforms to strengthen customer engagement. The presence of established technology companies and high levels of digital readiness contribute significantly to market leadership. Expanding online services and sophisticated data analytics capabilities further drive widespread implementation. With organizations emphasizing enhanced user journeys and competitive differentiation, North America maintains its leading role in shaping global trends within the personalization and UX platform industry.
Region with highest CAGR:
Over the forecast period, the Asia Pacific region is anticipated to exhibit the highest CAGR due to accelerating technological modernization and widespread digital adoption. Expanding mobile connectivity, cloud infrastructure development, and increased use of data-driven marketing tools are encouraging organizations to implement advanced personalization solutions. The surge in online commerce and smart mobility ecosystems further amplifies demand for customized digital experiences. Growing awareness of customer-centric strategies and strong governmental support for innovation enhance regional momentum. These factors collectively establish Asia-Pacific as the most rapidly expanding region in the global personalization and user experience platform landscape.

Key players in the market
Some of the key players in Auto Personalization & UX Platforms Market include Cerence, Nuance, Smart Eye, Apple, Google, Harman, Visteon, Bosch, Continental, Aptiv, SoundHound AI, Valeo, Magna, Elektrobit, Qualcomm, Forvia, Hyundai Mobis and Panasonic Automotive.
Key Developments:
In December 2025, Harman International has agreed to acquire the ADAS business of ZF Group for €1.5 billion. The move strengthens HARMAN’s position in software-defined vehicles by bringing safety, assisted driving and in-cabin experiences onto a single, centralised vehicle computing platform.
In November 2025, Aptiv PLC announced that it inked a strategic cooperation deal with Robust.AI to co-develop AI-powered collaborative robots. The partnership combines Aptiv's (APTV) industry-leading portfolio, including Wind River platforms and tools, with Robust.AI's robotics expertise and human-centered design to accelerate innovation in warehouse and industrial automation.
In October 2025, Continental AG has reached a deal with former managers that will see their insurance pay damages between 40 million and 50 million euros ($46.7 million-$58.3 million) in connection with the diesel scandal. The deal with insurers, subject to shareholder approval, covers only some of the total damages of 300 million euros.
Components Covered:
• Software
• Services
• Hardware Integrations
Vehicle Types Covered:
• Passenger Cars
• Commercial Vehicles
• Autonomous Vehicles
Applications Covered:
• Infotainment Personalization
• Driver Assistance UX
• In-car Commerce & Retail UX
• Safety & Security UX
• Comfort & Wellness UX
Regions Covered:
• North America
o United States
o Canada
o Mexico
• Europe
o United Kingdom
o Germany
o France
o Italy
o Spain
o Netherlands
o Belgium
o Sweden
o Switzerland
o Poland
o Rest of Europe
• Asia Pacific
o China
o Japan
o India
o South Korea
o Australia
o Indonesia
o Thailand
o Malaysia
o Singapore
o Vietnam
o Rest of Asia Pacific
• South America
o Brazil
o Argentina
o Colombia
o Chile
o Peru
o Rest of South America
• Rest of the World (RoW)
o Middle East
§ Saudi Arabia
§ United Arab Emirates
§ Qatar
§ Israel
§ Rest of Middle East
o Africa
§ South Africa
§ Egypt
§ Morocco
§ Rest of Africa
What our report offers:
- Market share assessments for the regional and country-level segments
- Strategic recommendations for the new entrants
- Covers Market data for the years 2023, 2024, 2025, 2026, 2027, 2028, 2030, 2032 and 2034
- Market Trends (Drivers, Constraints, Opportunities, Threats, Challenges, Investment Opportunities, and recommendations)
- Strategic recommendations in key business segments based on the market estimations
- Competitive landscaping mapping the key common trends
- Company profiling with detailed strategies, financials, and recent developments
- Supply chain trends mapping the latest technological advancements
Free Customization Offerings:
All the customers of this report will be entitled to receive one of the following free customization options:
• Company Profiling
o Comprehensive profiling of additional market players (up to 3)
o SWOT Analysis of key players (up to 3)
• Regional Segmentation
o Market estimations, Forecasts and CAGR of any prominent country as per the client's interest (Note: Depends on feasibility check)
• Competitive Benchmarking
o Benchmarking of key players based on product portfolio, geographical presence, and strategic alliances
Table of Contents
1 Executive Summary
1.1 Market Snapshot and Key Highlights
1.2 Growth Drivers, Challenges, and Opportunities
1.3 Competitive Landscape Overview
1.4 Strategic Insights and Recommendations
2 Research Framework
2.1 Study Objectives and Scope
2.2 Stakeholder Analysis
2.3 Research Assumptions and Limitations
2.4 Research Methodology
2.4.1 Data Collection (Primary and Secondary)
2.4.2 Data Modeling and Estimation Techniques
2.4.3 Data Validation and Triangulation
2.4.4 Analytical and Forecasting Approach
3 Market Dynamics and Trend Analysis
3.1 Market Definition and Structure
3.2 Key Market Drivers
3.3 Market Restraints and Challenges
3.4 Growth Opportunities and Investment Hotspots
3.5 Industry Threats and Risk Assessment
3.6 Technology and Innovation Landscape
3.7 Emerging and High-Growth Markets
3.8 Regulatory and Policy Environment
3.9 Impact of COVID-19 and Recovery Outlook
4 Competitive and Strategic Assessment
4.1 Porter's Five Forces Analysis
4.1.1 Supplier Bargaining Power
4.1.2 Buyer Bargaining Power
4.1.3 Threat of Substitutes
4.1.4 Threat of New Entrants
4.1.5 Competitive Rivalry
4.2 Market Share Analysis of Key Players
4.3 Product Benchmarking and Performance Comparison
5 Global Auto Personalization & UX Platforms Market, By Component
5.1 Software
5.2 Services
5.3 Hardware Integrations
6 Global Auto Personalization & UX Platforms Market, By Vehicle Type
6.1 Passenger Cars
6.2 Commercial Vehicles
6.3 Autonomous Vehicles
7 Global Auto Personalization & UX Platforms Market, By Application
7.1 Infotainment Personalization
7.2 Driver Assistance UX
7.3 In-car Commerce & Retail UX
7.4 Safety & Security UX
7.5 Comfort & Wellness UX
8 Global Auto Personalization & UX Platforms Market, By Geography
8.1 North America
8.1.1 United States
8.1.2 Canada
8.1.3 Mexico
8.2 Europe
8.2.1 United Kingdom
8.2.2 Germany
8.2.3 France
8.2.4 Italy
8.2.5 Spain
8.2.6 Netherlands
8.2.7 Belgium
8.2.8 Sweden
8.2.9 Switzerland
8.2.10 Poland
8.2.11 Rest of Europe
8.3 Asia Pacific
8.3.1 China
8.3.2 Japan
8.3.3 India
8.3.4 South Korea
8.3.5 Australia
8.3.6 Indonesia
8.3.7 Thailand
8.3.8 Malaysia
8.3.9 Singapore
8.3.10 Vietnam
8.3.11 Rest of Asia Pacific
8.4 South America
8.4.1 Brazil
8.4.2 Argentina
8.4.3 Colombia
8.4.4 Chile
8.4.5 Peru
8.4.6 Rest of South America
8.5 Rest of the World (RoW)
8.5.1 Middle East
8.5.1.1 Saudi Arabia
8.5.1.2 United Arab Emirates
8.5.1.3 Qatar
8.5.1.4 Israel
8.5.1.5 Rest of Middle East
8.5.2 Africa
8.5.2.1 South Africa
8.5.2.2 Egypt
8.5.2.3 Morocco
8.5.2.4 Rest of Africa
9 Strategic Market Intelligence
9.1 Industry Value Network and Supply Chain Assessment
9.2 White-Space and Opportunity Mapping
9.3 Product Evolution and Market Life Cycle Analysis
9.4 Channel, Distributor, and Go-to-Market Assessment
10 Industry Developments and Strategic Initiatives
10.1 Mergers and Acquisitions
10.2 Partnerships, Alliances, and Joint Ventures
10.3 New Product Launches and Certifications
10.4 Capacity Expansion and Investments
10.5 Other Strategic Initiatives
11 Company Profiles
11.1 Cerence
11.2 Nuance
11.3 Smart Eye
11.4 Apple
11.5 Google
11.6 Harman
11.7 Visteon
11.8 Bosch
11.9 Continental
11.10 Aptiv
11.11 SoundHound AI
11.12 Valeo
11.13 Magna
11.14 Elektrobit
11.15 Qualcomm
11.16 Forvia
11.17 Hyundai Mobis
11.18 Panasonic Automotive
List of Tables
1 Global Auto Personalization & UX Platforms Market Outlook, By Region (2023-2034) ($MN)
2 Global Auto Personalization & UX Platforms Market Outlook, By Component (2023-2034) ($MN)
3 Global Auto Personalization & UX Platforms Market Outlook, By Software (2023-2034) ($MN)
4 Global Auto Personalization & UX Platforms Market Outlook, By Services (2023-2034) ($MN)
5 Global Auto Personalization & UX Platforms Market Outlook, By Hardware Integrations (2023-2034) ($MN)
6 Global Auto Personalization & UX Platforms Market Outlook, By Vehicle Type (2023-2034) ($MN)
7 Global Auto Personalization & UX Platforms Market Outlook, By Passenger Cars (2023-2034) ($MN)
8 Global Auto Personalization & UX Platforms Market Outlook, By Commercial Vehicles (2023-2034) ($MN)
9 Global Auto Personalization & UX Platforms Market Outlook, By Autonomous Vehicles (2023-2034) ($MN)
10 Global Auto Personalization & UX Platforms Market Outlook, By Application (2023-2034) ($MN)
11 Global Auto Personalization & UX Platforms Market Outlook, By Infotainment Personalization (2023-2034) ($MN)
12 Global Auto Personalization & UX Platforms Market Outlook, By Driver Assistance UX (2023-2034) ($MN)
13 Global Auto Personalization & UX Platforms Market Outlook, By In-car Commerce & Retail UX (2023-2034) ($MN)
14 Global Auto Personalization & UX Platforms Market Outlook, By Safety & Security UX (2023-2034) ($MN)
15 Global Auto Personalization & UX Platforms Market Outlook, By Comfort & Wellness UX (2023-2034) ($MN)
Note: Tables for North America, Europe, APAC, South America, and Rest of the World (RoW) Regions are also represented in the same manner as above.
List of Figures
RESEARCH METHODOLOGY

We at ‘Stratistics’ opt for an extensive research approach which involves data mining, data validation, and data analysis. The various research sources include in-house repository, secondary research, competitor’s sources, social media research, client internal data, and primary research.
Our team of analysts prefers the most reliable and authenticated data sources in order to perform the comprehensive literature search. With access to most of the authenticated data bases our team highly considers the best mix of information through various sources to obtain extensive and accurate analysis.
Each report takes an average time of a month and a team of 4 industry analysts. The time may vary depending on the scope and data availability of the desired market report. The various parameters used in the market assessment are standardized in order to enhance the data accuracy.
Data Mining
The data is collected from several authenticated, reliable, paid and unpaid sources and is filtered depending on the scope & objective of the research. Our reports repository acts as an added advantage in this procedure. Data gathering from the raw material suppliers, distributors and the manufacturers is performed on a regular basis, this helps in the comprehensive understanding of the products value chain. Apart from the above mentioned sources the data is also collected from the industry consultants to ensure the objective of the study is in the right direction.
Market trends such as technological advancements, regulatory affairs, market dynamics (Drivers, Restraints, Opportunities and Challenges) are obtained from scientific journals, market related national & international associations and organizations.
Data Analysis
From the data that is collected depending on the scope & objective of the research the data is subjected for the analysis. The critical steps that we follow for the data analysis include:
- Product Lifecycle Analysis
- Competitor analysis
- Risk analysis
- Porters Analysis
- PESTEL Analysis
- SWOT Analysis
The data engineering is performed by the core industry experts considering both the Marketing Mix Modeling and the Demand Forecasting. The marketing mix modeling makes use of multiple-regression techniques to predict the optimal mix of marketing variables. Regression factor is based on a number of variables and how they relate to an outcome such as sales or profits.
Data Validation
The data validation is performed by the exhaustive primary research from the expert interviews. This includes telephonic interviews, focus groups, face to face interviews, and questionnaires to validate our research from all aspects. The industry experts we approach come from the leading firms, involved in the supply chain ranging from the suppliers, distributors to the manufacturers and consumers so as to ensure an unbiased analysis.
We are in touch with more than 15,000 industry experts with the right mix of consultants, CEO's, presidents, vice presidents, managers, experts from both supply side and demand side, executives and so on.
The data validation involves the primary research from the industry experts belonging to:
- Leading Companies
- Suppliers & Distributors
- Manufacturers
- Consumers
- Industry/Strategic Consultants
Apart from the data validation the primary research also helps in performing the fill gap research, i.e. providing solutions for the unmet needs of the research which helps in enhancing the reports quality.
For more details about research methodology, kindly write to us at info@strategymrc.com
Frequently Asked Questions
In case of any queries regarding this report, you can contact the customer service by filing the “Inquiry Before Buy” form available on the right hand side. You may also contact us through email: info@strategymrc.com or phone: +1-301-202-5929
Yes, the samples are available for all the published reports. You can request them by filling the “Request Sample” option available in this page.
Yes, you can request a sample with your specific requirements. All the customized samples will be provided as per the requirement with the real data masked.
All our reports are available in Digital PDF format. In case if you require them in any other formats, such as PPT, Excel etc you can submit a request through “Inquiry Before Buy” form available on the right hand side. You may also contact us through email: info@strategymrc.com or phone: +1-301-202-5929
We offer a free 15% customization with every purchase. This requirement can be fulfilled for both pre and post sale. You may send your customization requirements through email at info@strategymrc.com or call us on +1-301-202-5929.
We have 3 different licensing options available in electronic format.
- Single User Licence: Allows one person, typically the buyer, to have access to the ordered product. The ordered product cannot be distributed to anyone else.
- 2-5 User Licence: Allows the ordered product to be shared among a maximum of 5 people within your organisation.
- Corporate License: Allows the product to be shared among all employees of your organisation regardless of their geographical location.
All our reports are typically be emailed to you as an attachment.
To order any available report you need to register on our website. The payment can be made either through CCAvenue or PayPal payments gateways which accept all international cards.
We extend our support to 6 months post sale. A post sale customization is also provided to cover your unmet needs in the report.
Request Customization
We offer complimentary customization of up to 15% with every purchase. To share your customization requirements, feel free to email us at info@strategymrc.com or call us on +1-301-202-5929. .
Please Note: Customization within the 15% threshold is entirely free of charge. If your request exceeds this limit, we will conduct a feasibility assessment. Following that, a detailed quote and timeline will be provided.
WHY CHOOSE US ?

Assured Quality
Best in class reports with high standard of research integrity

24X7 Research Support
Continuous support to ensure the best customer experience.

Free Customization
Adding more values to your product of interest.

Safe & Secure Access
Providing a secured environment for all online transactions.

Trusted by 600+ Brands
Serving the most reputed brands across the world.