
Automotive 800v Traction Inverter Market
Automotive 800V Traction Inverter Market Forecasts to 2034 – Global Analysis By Semiconductor Technology (Silicon Carbide (SiC) MOSFET Inverters, Silicon IGBT Inverters, and Hybrid SiC-Silicon Inverter Modules), Inverter Integration, Power Rating, Vehicle Type, Sales Channel, and By Geography

Market Dynamics:
Driver:
Higher-voltage vehicle platforms increase demand for efficient motor control
Automakers adopting higher-voltage battery systems need traction electronics that can use the architecture effectively. At a given power level, higher voltage allows lower current, which can ease conductor and thermal requirements elsewhere in the vehicle. The inverter remains critical because its switching and conduction losses affect the value realized from the complete powertrain. Customers seek designs that sustain efficiency across everyday driving as well as peak output. This encourages investment in silicon carbide modules, cooling arrangements, and controls tailored to 800V platforms, particularly where range, charging capability, and performance are important product differentiators.
Restraint:
Power-module cost and validation effort remain substantial
An 800V inverter must combine reliable high-voltage switching with demanding thermal, insulation, and electromagnetic requirements. Semiconductor quality, packaging, gate-drive behavior, and cooling interfaces all influence lifetime. Silicon carbide can improve efficiency, but its cost and manufacturing consistency still matter to vehicle economics. Changing a power module may require substantial testing and control recalibration rather than a simple component substitution. Suppliers must also satisfy automotive quality and safety processes before production begins. These costs can limit adoption in price-sensitive vehicles and extend the time between a technically promising design and a confirmed series-production program.
Opportunity:
Integrated drive units create room for coordinated hardware and software design
Combining the inverter with a motor or electric axle can reduce interfaces, shorten electrical connections, and simplify vehicle assembly. The opportunity is greatest when suppliers optimize cooling, packaging, and control together rather than placing existing components in a common housing. Scalable architectures can serve several motor ratings or vehicle derivatives while preserving proven software and manufacturing processes. Advanced switching strategies and improved module cooling provide additional differentiation. Suppliers that support the automaker's wider vehicle architecture can capture more engineering value, especially where compact packaging and dependable efficiency matter as much as maximum power.
Threat:
Vehicle-program changes and semiconductor competition pressure returns
Traction inverter investments depend on vehicle launches that may be delayed, reduced, or redesigned as demand and platform strategies change. A supplier can incur extensive engineering and tooling costs before expected volumes materialize. Competition among semiconductor and powertrain companies also makes it difficult to preserve a premium for efficiency improvements that rivals can approach. Automakers may bring more development in-house or request alternative chip sources to reduce dependency. These pressures reward flexible designs and disciplined capacity planning, while exposing narrowly configured products to commercial risk when a major customer changes its electrification timetable.
Covid-19 Impact:
COVID-19 interrupted vehicle development, proving-ground access, and supplier coordination during an important period for higher-voltage electric powertrains. Semiconductor shortages and logistics disruption subsequently complicated production planning and highlighted dependencies beyond the inverter's own factory. At the same time, continued development of electric platforms sustained interest in more efficient traction electronics. Recovery involved rescheduling validation, securing power-device supply, and adapting manufacturing to changing customer programs. The experience reinforced the importance of robust qualification processes and flexible sourcing, since inverter availability can constrain the launch of an otherwise complete electric-vehicle platform.
The Silicon Carbide (SiC) MOSFET Inverters segment is expected to be the largest during the forecast period
Silicon Carbide (SiC) MOSFET Inverters are expected to lead the market because their switching characteristics suit the efficiency and power-density objectives of 800V powertrains. Their value extends across propulsion and regenerative operation, although the benefit depends on device selection, module design, and control. Automakers can weigh the higher semiconductor cost against potential improvements in cooling, packaging, and vehicle energy use. Established qualification programs and growing supplier experience support broader adoption. The segment's strength is therefore linked to complete powertrain optimization, with performance across realistic driving conditions carrying more weight than a single peak-efficiency figure.
The Three-in-One E-Axle Inverter Assemblies segment is expected to have the highest CAGR during the forecast period
Three-in-One E-Axle Inverter Assemblies are projected to achieve the highest CAGR as manufacturers seek compact propulsion packages that simplify installation. Integrating the inverter, motor, and transmission creates opportunities to coordinate cooling and eliminate some external interfaces. It can also support repeated use across vehicle platforms when the architecture is suitably modular. Growth depends on managing the tradeoffs of shared packaging, including serviceability and thermal interaction between components. Suppliers with competence across power electronics, motor control, and mechanical systems are positioned to meet these requirements and participate earlier in vehicle-platform design decisions.
Region with largest share:
Asia Pacific is expected to hold the largest share, with a substantial electric-vehicle manufacturing base and close links among automakers, semiconductor suppliers, and drive-system producers. High-voltage platforms can move through development and production within dense regional supply networks. Competition encourages improvements in inverter cost, integration, and production efficiency, making scalable designs especially valuable. Demand extends beyond premium passenger cars as manufacturers evaluate higher-voltage systems for additional vehicle classes. Regional leadership will depend on delivering reliable volume production while sustaining the engineering work needed for increasingly integrated and software-controlled propulsion systems.
Region with highest CAGR:
Europe is anticipated to register the highest CAGR as automakers renew electric platforms and suppliers develop successive generations of high-voltage power electronics. The region's premium and performance-vehicle engineering provides an established route for demonstrating new inverter designs before they spread into broader programs. Efficiency requirements, packaging constraints, and integration with vehicle software encourage continued development. Growth will depend on the timing and scale of customer launches, so confirmed contracts should be distinguished from realized production. Suppliers that combine qualified silicon carbide modules with flexible architectures can benefit as regional platforms evolve during the forecast period.
Key players in the market
Some of the key players in the Automotive 800V Traction Inverter Market include Valeo SE, BorgWarner Inc., Robert Bosch GmbH, ZF Friedrichshafen AG, DENSO Corporation, Vitesco Technologies GmbH, Marelli Holdings Co., Ltd., Hyundai Mobis Co., Ltd., Nidec Corporation, Mitsubishi Electric Corporation, Infineon Technologies AG, STMicroelectronics N.V., onsemi, Wolfspeed, Inc., and BYD Company Limited.
Key Developments:
In August 2026, BorgWarner secured extensions of high-volume inverter programs with a major European automaker, including 800V battery-electric applications. The updated traction inverter incorporates a new generation of Viper silicon carbide switches and double-sided cooling. Production was planned for 2029, making this a future-program award rather than current-volume delivery.
In October 2025, Valeo announced serial-production contracts for its new dual-inverter platform with two Chinese automakers. In the broader automotive inverter market, the scalable platform supports silicon, silicon carbide, and mixed configurations, including higher-voltage applications. The announced customer programs targeted plug-in hybrids, with production scheduled to begin in 2026.
In April 2025, BorgWarner announced plans to present its next-generation double-sided-cooled 800V silicon carbide power module at the Vienna Motor Symposium. The module used updated Viper switches and targeted high-current-density applications, highlighting continued work on compact inverter designs and the thermal interfaces that support their performance.
Semiconductor Technologies Covered:
• Silicon Carbide (SiC) MOSFET Inverters
• Silicon IGBT Inverters
• Hybrid SiC-Silicon Inverter Modules
Inverter Integration Covered:
• Standalone Traction Inverters
• Integrated Motor-Inverter Units
• Three-in-One E-Axle Inverter Assemblies
Power Ratings Covered:
• Below 150 kW
• 150 to 300 kW
• Above 300 kW
Vehicle Types Covered:
• Battery Electric Passenger Cars
• Plug-In Hybrid Vehicles
• Electric Light Commercial Vehicles
• Electric Buses and Heavy Vehicles
Sales Channels Covered:
• Original Equipment Manufacturer (OEM)
• Replacement and Remanufactured Systems
Regions Covered:
• North America
o United States
o Canada
o Mexico
• Europe
o United Kingdom
o Germany
o France
o Italy
o Spain
o Netherlands
o Belgium
o Sweden
o Switzerland
o Poland
o Rest of Europe
• Asia Pacific
o China
o Japan
o India
o South Korea
o Australia
o Indonesia
o Thailand
o Malaysia
o Singapore
o Vietnam
o Rest of Asia Pacific
• South America
o Brazil
o Argentina
o Colombia
o Chile
o Peru
o Rest of South America
• Rest of the World (RoW)
o Middle East
Saudi Arabia
United Arab Emirates
Qatar
Israel
Rest of Middle East
o Africa
South Africa
Egypt
Morocco
Rest of Africa
What our report offers:
- Market share assessments for the regional and country-level segments
- Strategic recommendations for the new entrants
- Covers Market data for the years 2023, 2024, 2025, 2026, 2027, 2028, 2030, 2032 and 2034
- Market Trends (Drivers, Constraints, Opportunities, Threats, Challenges, Investment Opportunities, and recommendations)
- Strategic recommendations in key business segments based on the market estimations
- Competitive landscaping mapping the key common trends
- Company profiling with detailed strategies, financials, and recent developments
- Supply chain trends mapping the latest technological advancements
Free Customization Offerings:
All the customers of this report will be entitled to receive one of the following free customization options:
• Company Profiling
o Comprehensive profiling of additional market players (up to 3)
o SWOT Analysis of key players (up to 3)
• Regional Segmentation
o Market estimations, Forecasts and CAGR of any prominent country as per the client's interest (Note: Depends on feasibility check)
• Competitive Benchmarking
o Benchmarking of key players based on product portfolio, geographical presence, and strategic alliances
Table of Contents
1 Executive Summary1.1 Market Snapshot and Key Highlights
1.2 Growth Drivers, Challenges, and Opportunities
1.3 Competitive Landscape Overview
1.4 Strategic Insights and Recommendations
2 Research Framework
2.1 Study Objectives and Scope
2.2 Stakeholder Analysis
2.3 Research Assumptions and Limitations
2.4 Research Methodology
2.4.1 Data Collection (Primary and Secondary)
2.4.2 Data Modeling and Estimation Techniques
2.4.3 Data Validation and Triangulation
2.4.4 Analytical and Forecasting Approach
3 Market Dynamics and Trend Analysis
3.1 Market Definition and Structure
3.2 Key Market Drivers
3.3 Market Restraints and Challenges
3.4 Growth Opportunities and Investment Hotspots
3.5 Industry Threats and Risk Assessment
3.6 Technology and Innovation Landscape
3.7 Emerging and High-Growth Markets
3.8 Regulatory and Policy Environment
3.9 Impact of COVID-19 and Recovery Outlook
4 Competitive and Strategic Assessment
4.1 Porter's Five Forces Analysis
4.1.1 Supplier Bargaining Power
4.1.2 Buyer Bargaining Power
4.1.3 Threat of Substitutes
4.1.4 Threat of New Entrants
4.1.5 Competitive Rivalry
4.2 Market Share Analysis of Key Players
4.3 Product Benchmarking and Performance Comparison
5 Global Automotive 800V Traction Inverter Market, By Semiconductor Technology
5.1 Silicon Carbide (SiC) MOSFET Inverters
5.2 Silicon IGBT Inverters
5.3 Hybrid SiC-Silicon Inverter Modules
6 Global Automotive 800V Traction Inverter Market, By Inverter Integration
6.1 Standalone Traction Inverters
6.2 Integrated Motor-Inverter Units
6.3 Three-in-One E-Axle Inverter Assemblies
7 Global Automotive 800V Traction Inverter Market, By Power Rating
7.1 Below 150 kW
7.2 150 to 300 kW
7.3 Above 300 kW
8 Global Automotive 800V Traction Inverter Market, By Vehicle Type
8.1 Battery Electric Passenger Cars
8.2 Plug-In Hybrid Vehicles
8.3 Electric Light Commercial Vehicles
8.4 Electric Buses and Heavy Vehicles
9 Global Automotive 800V Traction Inverter Market, By Sales Channel
9.1 Original Equipment Manufacturer (OEM)
9.2 Replacement and Remanufactured Systems
10 Global Automotive 800V Traction Inverter Market, By Geography
10.1 North America
10.1.1 United States
10.1.2 Canada
10.1.3 Mexico
10.2 Europe
10.2.1 United Kingdom
10.2.2 Germany
10.2.3 France
10.2.4 Italy
10.2.5 Spain
10.2.6 Netherlands
10.2.7 Belgium
10.2.8 Sweden
10.2.9 Switzerland
10.2.10 Poland
10.2.11 Rest of Europe
10.3 Asia Pacific
10.3.1 China
10.3.2 Japan
10.3.3 India
10.3.4 South Korea
10.3.5 Australia
10.3.6 Indonesia
10.3.7 Thailand
10.3.8 Malaysia
10.3.9 Singapore
10.3.10 Vietnam
10.3.11 Rest of Asia Pacific
10.4 South America
10.4.1 Brazil
10.4.2 Argentina
10.4.3 Colombia
10.4.4 Chile
10.4.5 Peru
10.4.6 Rest of South America
10.5 Rest of the World (RoW)
10.5.1 Middle East
10.5.1.1 Saudi Arabia
10.5.1.2 United Arab Emirates
10.5.1.3 Qatar
10.5.1.4 Israel
10.5.1.5 Rest of Middle East
10.5.2 Africa
10.5.2.1 South Africa
10.5.2.2 Egypt
10.5.2.3 Morocco
10.5.2.4 Rest of Africa
11 Strategic Market Intelligence
11.1 Industry Value Network and Supply Chain Assessment
11.2 White-Space and Opportunity Mapping
11.3 Product Evolution and Market Life Cycle Analysis
11.4 Channel, Distributor, and Go-to-Market Assessment
12 Industry Developments and Strategic Initiatives
12.1 Mergers and Acquisitions
12.2 Partnerships, Alliances, and Joint Ventures
12.3 New Product Launches and Certifications
12.4 Capacity Expansion and Investments
12.5 Other Strategic Initiatives
13 Company Profiles
13.1 Valeo SE
13.2 BorgWarner Inc.
13.3 Robert Bosch GmbH
13.4 ZF Friedrichshafen AG
13.5 DENSO Corporation
13.6 Vitesco Technologies GmbH
13.7 Marelli Holdings Co., Ltd.
13.8 Hyundai Mobis Co., Ltd.
13.9 Nidec Corporation
13.10 Mitsubishi Electric Corporation
13.11 Infineon Technologies AG
13.12 STMicroelectronics N.V.
13.13 onsemi
13.14 Wolfspeed, Inc.
13.15 BYD Company Limited
List of Tables
1 Global Automotive 800V Traction Inverter Market Outlook, By Region (2023–2034) ($MN)
2 Global Automotive 800V Traction Inverter Market Outlook, By Semiconductor Technology (2023–2034) ($MN)
3 Global Automotive 800V Traction Inverter Market Outlook, By Silicon Carbide (SiC) MOSFET Inverters (2023–2034) ($MN)
4 Global Automotive 800V Traction Inverter Market Outlook, By Silicon IGBT Inverters (2023–2034) ($MN)
5 Global Automotive 800V Traction Inverter Market Outlook, By Hybrid SiC-Silicon Inverter Modules (2023–2034) ($MN)
6 Global Automotive 800V Traction Inverter Market Outlook, By Inverter Integration (2023–2034) ($MN)
7 Global Automotive 800V Traction Inverter Market Outlook, By Standalone Traction Inverters (2023–2034) ($MN)
8 Global Automotive 800V Traction Inverter Market Outlook, By Integrated Motor-Inverter Units (2023–2034) ($MN)
9 Global Automotive 800V Traction Inverter Market Outlook, By Three-in-One E-Axle Inverter Assemblies (2023–2034) ($MN)
10 Global Automotive 800V Traction Inverter Market Outlook, By Power Rating (2023–2034) ($MN)
11 Global Automotive 800V Traction Inverter Market Outlook, By Below 150 kW (2023–2034) ($MN)
12 Global Automotive 800V Traction Inverter Market Outlook, By 150 to 300 kW (2023–2034) ($MN)
13 Global Automotive 800V Traction Inverter Market Outlook, By Above 300 kW (2023–2034) ($MN)
14 Global Automotive 800V Traction Inverter Market Outlook, By Vehicle Type (2023–2034) ($MN)
15 Global Automotive 800V Traction Inverter Market Outlook, By Battery Electric Passenger Cars (2023–2034) ($MN)
16 Global Automotive 800V Traction Inverter Market Outlook, By Plug-In Hybrid Vehicles (2023–2034) ($MN)
17 Global Automotive 800V Traction Inverter Market Outlook, By Electric Light Commercial Vehicles (2023–2034) ($MN)
18 Global Automotive 800V Traction Inverter Market Outlook, By Electric Buses and Heavy Vehicles (2023–2034) ($MN)
19 Global Automotive 800V Traction Inverter Market Outlook, By Sales Channel (2023–2034) ($MN)
20 Global Automotive 800V Traction Inverter Market Outlook, By Original Equipment Manufacturer (OEM) (2023–2034) ($MN)
21 Global Automotive 800V Traction Inverter Market Outlook, By Replacement and Remanufactured Systems (2023–2034) ($MN)
Note: Tables for North America, Europe, APAC, South America, and Rest of the World (RoW) Regions are also represented in the same manner as above.
List of Figures
RESEARCH METHODOLOGY
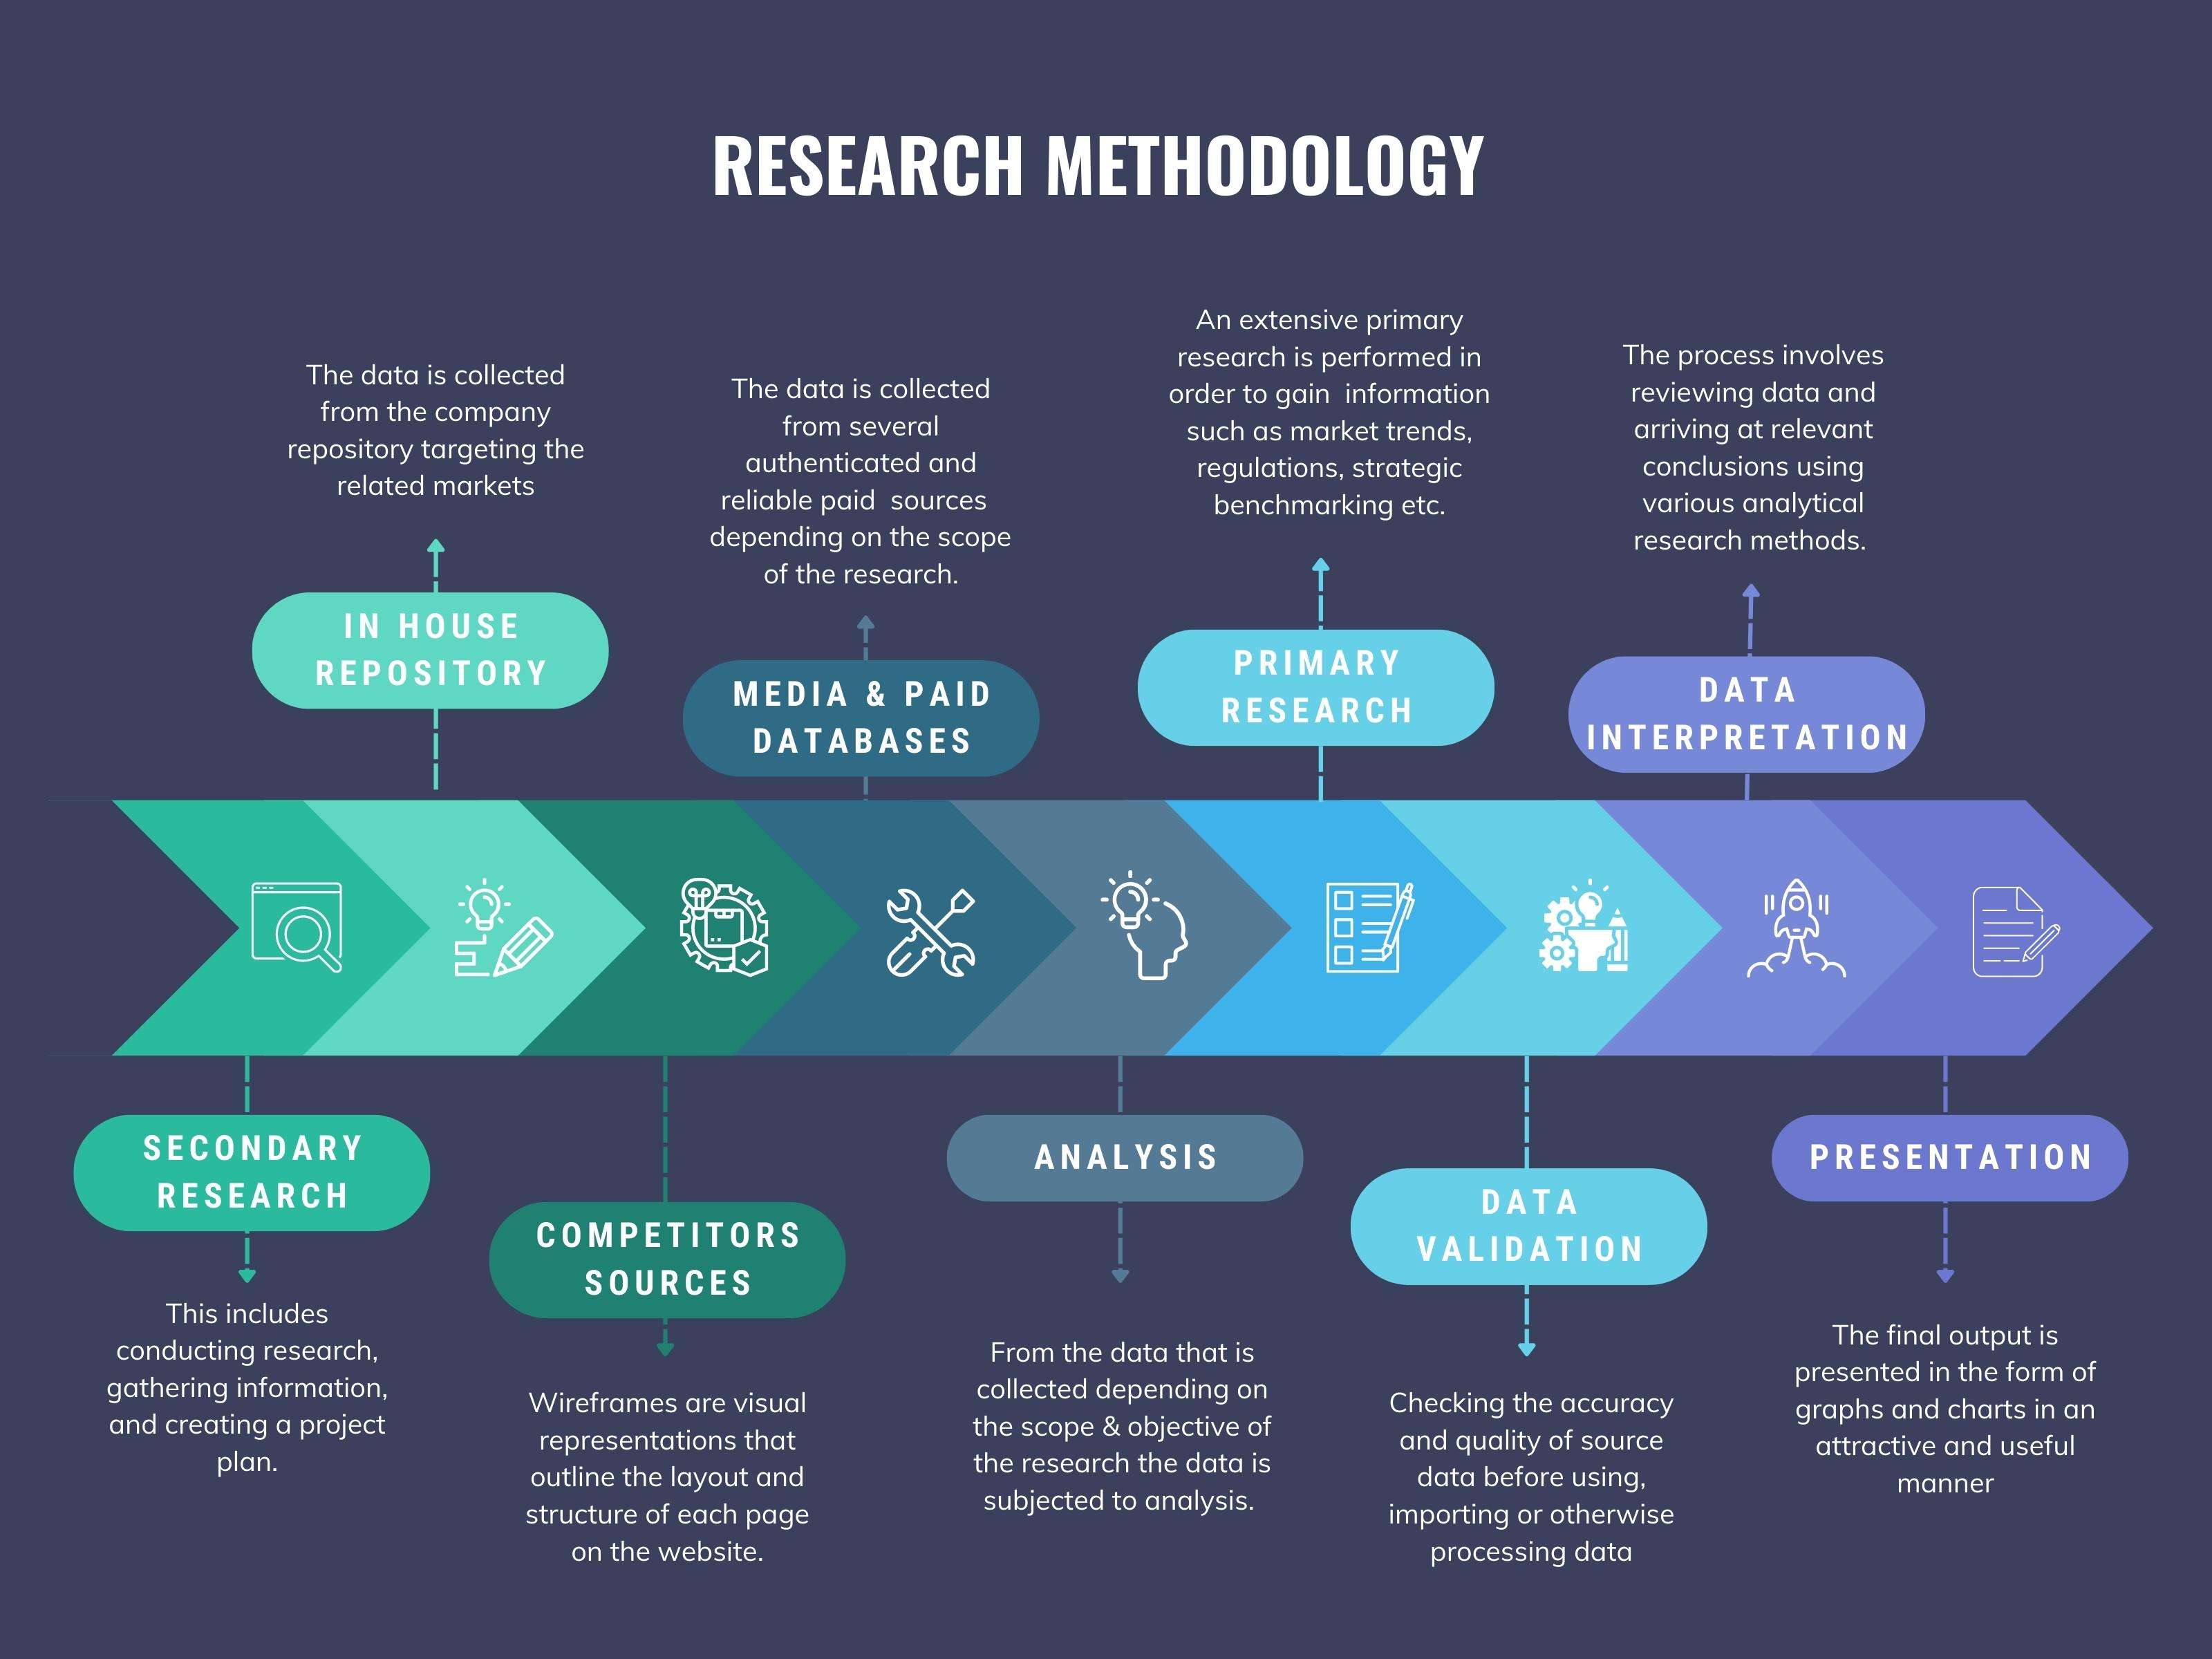
We at ‘Stratistics’ opt for an extensive research approach which involves data mining, data validation, and data analysis. The various research sources include in-house repository, secondary research, competitor’s sources, social media research, client internal data, and primary research.
Our team of analysts prefers the most reliable and authenticated data sources in order to perform the comprehensive literature search. With access to most of the authenticated data bases our team highly considers the best mix of information through various sources to obtain extensive and accurate analysis.
Each report takes an average time of a month and a team of 4 industry analysts. The time may vary depending on the scope and data availability of the desired market report. The various parameters used in the market assessment are standardized in order to enhance the data accuracy.
Data Mining
The data is collected from several authenticated, reliable, paid and unpaid sources and is filtered depending on the scope & objective of the research. Our reports repository acts as an added advantage in this procedure. Data gathering from the raw material suppliers, distributors and the manufacturers is performed on a regular basis, this helps in the comprehensive understanding of the products value chain. Apart from the above mentioned sources the data is also collected from the industry consultants to ensure the objective of the study is in the right direction.
Market trends such as technological advancements, regulatory affairs, market dynamics (Drivers, Restraints, Opportunities and Challenges) are obtained from scientific journals, market related national & international associations and organizations.
Data Analysis
From the data that is collected depending on the scope & objective of the research the data is subjected for the analysis. The critical steps that we follow for the data analysis include:
- Product Lifecycle Analysis
- Competitor analysis
- Risk analysis
- Porters Analysis
- PESTEL Analysis
- SWOT Analysis
The data engineering is performed by the core industry experts considering both the Marketing Mix Modeling and the Demand Forecasting. The marketing mix modeling makes use of multiple-regression techniques to predict the optimal mix of marketing variables. Regression factor is based on a number of variables and how they relate to an outcome such as sales or profits.
Data Validation
The data validation is performed by the exhaustive primary research from the expert interviews. This includes telephonic interviews, focus groups, face to face interviews, and questionnaires to validate our research from all aspects. The industry experts we approach come from the leading firms, involved in the supply chain ranging from the suppliers, distributors to the manufacturers and consumers so as to ensure an unbiased analysis.
We are in touch with more than 15,000 industry experts with the right mix of consultants, CEO's, presidents, vice presidents, managers, experts from both supply side and demand side, executives and so on.
The data validation involves the primary research from the industry experts belonging to:
- Leading Companies
- Suppliers & Distributors
- Manufacturers
- Consumers
- Industry/Strategic Consultants
Apart from the data validation the primary research also helps in performing the fill gap research, i.e. providing solutions for the unmet needs of the research which helps in enhancing the reports quality.
For more details about research methodology, kindly write to us at info@strategymrc.com
Frequently Asked Questions
In case of any queries regarding this report, you can contact the customer service by filing the “Inquiry Before Buy” form available on the right hand side. You may also contact us through email: info@strategymrc.com or phone: +1-301-202-5929
Yes, the samples are available for all the published reports. You can request them by filling the “Request Sample” option available in this page.
Yes, you can request a sample with your specific requirements. All the customized samples will be provided as per the requirement with the real data masked.
All our reports are available in Digital PDF format. In case if you require them in any other formats, such as PPT, Excel etc you can submit a request through “Inquiry Before Buy” form available on the right hand side. You may also contact us through email: info@strategymrc.com or phone: +1-301-202-5929
We offer a free 15% customization with every purchase. This requirement can be fulfilled for both pre and post sale. You may send your customization requirements through email at info@strategymrc.com or call us on +1-301-202-5929.
We have 3 different licensing options available in electronic format.
- Single User Licence: Allows one person, typically the buyer, to have access to the ordered product. The ordered product cannot be distributed to anyone else.
- 2-5 User Licence: Allows the ordered product to be shared among a maximum of 5 people within your organisation.
- Corporate License: Allows the product to be shared among all employees of your organisation regardless of their geographical location.
All our reports are typically be emailed to you as an attachment.
To order any available report you need to register on our website. The payment can be made either through CCAvenue or PayPal payments gateways which accept all international cards.
We extend our support to 6 months post sale. A post sale customization is also provided to cover your unmet needs in the report.
Request Customization
We offer complimentary customization of up to 15% with every purchase. To share your customization requirements, feel free to email us at info@strategymrc.com or call us on +1-301-202-5929. .
Please Note: Customization within the 15% threshold is entirely free of charge. If your request exceeds this limit, we will conduct a feasibility assessment. Following that, a detailed quote and timeline will be provided.
WHY CHOOSE US ?

Assured Quality
Best in class reports with high standard of research integrity

24X7 Research Support
Continuous support to ensure the best customer experience.

Free Customization
Adding more values to your product of interest.

Safe & Secure Access
Providing a secured environment for all online transactions.

Trusted by 600+ Brands
Serving the most reputed brands across the world.