
Automotive Cv Joint Market
Automotive CV Joint Market Forecasts to 2034 – Global Analysis By Joint Type (Fixed and Rzeppa Joints, Plunging and Tripod Joints, Double-Offset Joints, and Cross-Groove and Other Constant-Velocity Joints), Driveline Position, Drive Configuration, Vehicle Type, and By Geography

Market Dynamics:
Driver:
Electrified drivetrains retain demand for efficient articulated torque transfer
Most axle-driven electric vehicles still require a connection between the drive unit and moving wheels. Their immediate torque delivery and quieter operation make joint efficiency, vibration, and backlash more noticeable during vehicle development. Conventional front-wheel-drive and all-wheel-drive vehicles add an established volume base, while boot damage and wear support replacement demand. Suppliers can therefore serve both familiar and evolving architectures. The strongest products transfer torque smoothly across the required angle and plunge range without adding unnecessary mass or friction, giving vehicle engineers a practical way to improve driveline refinement and efficiency.
Restraint:
Contact geometry and lubrication require precise process control
CV joints must carry repeated contact loads while their internal parts move through changing angles. Track finish, heat treatment, lubricant behavior, and dimensional accuracy influence friction and fatigue life. A small deterioration in sealing can admit contaminants or release grease, undermining an otherwise sound design. Higher torque or tighter packaging can further narrow the acceptable operating window. These requirements make low-cost substitution difficult without careful validation. Manufacturers need consistent production methods and application knowledge, while aftermarket suppliers must provide complete fitting components and reliable instructions to prevent installation errors from becoming premature joint failures.
Opportunity:
Low-friction designs and predictive analysis can improve vehicle refinement
There is scope to reduce joint losses and induced vibration through revised track geometry, improved grease, and better integration with the shaft assembly. Simulation that predicts how a joint influences whole-vehicle behavior can shorten development work and help engineers select the appropriate design earlier. Electric vehicles provide a useful market because quieter cabins reveal driveline disturbances that were previously less apparent. Aftermarket kits offer another opportunity when they combine dependable joint performance with boots, clamps, and fasteners suited to the application. Suppliers can differentiate through measurable smoothness and service reliability rather than a nominally stronger part alone.
Threat:
Architecture changes and counterfeit replacements pressure established suppliers
New propulsion layouts can change shaft length, joint angles, and the number of driven wheels, altering the demand mix across an existing product range. In-wheel propulsion would remove some conventional shaft functions in the applications where it is adopted, although it does not represent a universal near-term replacement. The service market also faces price competition and inconsistent-quality copies that can damage customer confidence. Suppliers must manage a large fitment catalogue while funding development for newer drivetrains. Dependence on a few legacy platforms leaves a business exposed when customers redesign the axle or consolidate sourcing around complete driveline assemblies.
Covid-19 Impact:
COVID-19 disrupted vehicle production and reduced travel, affecting both new sideshaft orders and replacement-joint demand. Precision component manufacturing faced staffing restrictions, while logistics interruptions complicated the delivery of forged parts, boots, and lubricants. Lower mileage delayed some wear-related service, although essential fleets continued operating under different conditions. Development programs also lost access to vehicles and test facilities at critical stages. As activity recovered, suppliers needed to rebuild the correct application mix and restore stable process quality, with demand returning unevenly across passenger cars, commercial vehicles, and regional aftermarket channels.
The Fixed and Rzeppa Joints segment is expected to be the largest during the forecast period
Fixed and Rzeppa Joints are expected to be the largest joint-type segment because wheel-side torque transfer remains a common requirement across a substantial vehicle population. Their role in accommodating steering articulation gives them broad application in front-driven and all-wheel-drive platforms. Established design knowledge and production infrastructure support both factory fitment and replacement supply. Variations in angle capability, packaging, and torque capacity allow the family to serve different vehicle classes. The segment's scale is reinforced by service demand when boots or joints deteriorate, provided that replacement products preserve the correct geometry and installation requirements.
The Electric and Hybrid Vehicles segment is expected to have the highest CAGR during the forecast period
Electric and Hybrid Vehicles are anticipated to show the fastest growth among the covered vehicle types as more electrified platforms enter production and later reach the replacement market. Their driveline layouts often retain CV joints but place greater emphasis on efficiency, torque response, and quietness. This creates room for revised grease, compact geometries, and improved vibration behavior. Growth does not imply that every electric vehicle uses the same shaft arrangement, so suppliers must work closely with platform engineers. Designs that meet the specific operating angle and load requirements can capture value beyond a simple increase in vehicle volume.
Region with largest share:
Asia Pacific is expected to account for the largest regional share because of its extensive production of passenger vehicles and driveline components. The region supports conventional front-drive cars, all-wheel-drive models, and rapidly evolving electric platforms, creating diverse requirements for fixed and plunging joints. Local forging, machining, and assembly networks help manufacturers serve both domestic and export customers. Replacement demand adds a broad installed-base opportunity, though quality and price levels vary across distribution channels. Suppliers that maintain consistent process control and accurate application data can participate across these markets without sacrificing the durability required by OEM customers.
Region with highest CAGR:
Asia Pacific is projected to lead regional growth as electrified vehicle programs and a maturing service fleet increase demand for refined torque-transfer components. Manufacturers are placing greater attention on joint-induced noise and vibration as other powertrain noise sources diminish. Local engineering collaboration can help suppliers respond to compact axle layouts and changing torque requirements. At the same time, organized aftermarket distribution can improve access to reliable joint kits. Growth will favor companies that combine efficient production with application-specific development, rather than those that assume a conventional joint can be transferred unchanged to every new electric platform.
Key players in the market
Some of the key players in the Automotive CV Joint Market include GKN Automotive Limited, NTN Corporation, American Axle & Manufacturing, Inc., Dana Incorporated, Nexteer Automotive Group Limited, SKF AB, JTEKT Corporation, Hyundai WIA Corporation, Nachi-Fujikoshi Corp., Wanxiang Qianchao Co., Ltd., Neapco Holdings LLC, IFA Group, GSP Automotive Group, and Schaeffler AG.
Key Developments:
In August 2026, NTN announced analysis technology for predicting how CV joints affect whole-vehicle vibration. The method supports evaluation earlier in design, helping engineers address quietness and ride characteristics before relying entirely on physical driveline prototypes and repeated vehicle testing.
In August 2025, GKN Automotive described the use of its SX Countertrack CV joints and tubular interconnecting shafts in the Lucid Air. The technical update linked efficient torque transfer and lower shaft mass with an electric-vehicle application, illustrating continued CV-joint relevance in modern axle-driven powertrains.
In May 2025, NTN introduced an improved EDJ ball-type sliding CV joint for electric vehicles. A newly developed grease was central to the design's quietness and efficiency objectives, and the company planned to add the product to its EV driveshaft offering for global customer proposals.
Joint Types Covered:
• Fixed and Rzeppa Joints
• Plunging and Tripod Joints
• Double-Offset Joints
• Cross-Groove and Other Constant-Velocity Joints
Driveline Positions Covered:
• Outboard Wheel-Side Joints
• Inboard Transmission-Side Joints
• Intermediate Shaft and Propeller-Shaft Joints
Drive Configurations Covered:
• Front-Wheel Drive
• Rear-Wheel Drive
• All-Wheel and Four-Wheel Drive
Vehicle Types Covered:
• Passenger Cars
• Light Commercial Vehicles
• Electric and Hybrid Vehicles
Regions Covered:
• North America
o United States
o Canada
o Mexico
• Europe
o United Kingdom
o Germany
o France
o Italy
o Spain
o Netherlands
o Belgium
o Sweden
o Switzerland
o Poland
o Rest of Europe
• Asia Pacific
o China
o Japan
o India
o South Korea
o Australia
o Indonesia
o Thailand
o Malaysia
o Singapore
o Vietnam
o Rest of Asia Pacific
• South America
o Brazil
o Argentina
o Colombia
o Chile
o Peru
o Rest of South America
• Rest of the World (RoW)
o Middle East
▪ Saudi Arabia
▪ United Arab Emirates
▪ Qatar
▪ Israel
▪ Rest of Middle East
o Africa
▪ South Africa
▪ Egypt
▪ Morocco
▪ Rest of Africa
What our report offers:
- Market share assessments for the regional and country-level segments
- Strategic recommendations for the new entrants
- Covers Market data for the years 2023, 2024, 2025, 2026, 2027, 2028, 2030, 2032 and 2034
- Market Trends (Drivers, Constraints, Opportunities, Threats, Challenges, Investment Opportunities, and recommendations)
- Strategic recommendations in key business segments based on the market estimations
- Competitive landscaping mapping the key common trends
- Company profiling with detailed strategies, financials, and recent developments
- Supply chain trends mapping the latest technological advancements
Free Customization Offerings:
All the customers of this report will be entitled to receive one of the following free customization options:
• Company Profiling
o Comprehensive profiling of additional market players (up to 3)
o SWOT Analysis of key players (up to 3)
• Regional Segmentation
o Market estimations, Forecasts and CAGR of any prominent country as per the client's interest (Note: Depends on feasibility check)
• Competitive Benchmarking
o Benchmarking of key players based on product portfolio, geographical presence, and strategic alliances
Table of Contents
1 Executive Summary1.1 Market Snapshot and Key Highlights
1.2 Growth Drivers, Challenges, and Opportunities
1.3 Competitive Landscape Overview
1.4 Strategic Insights and Recommendations
2 Research Framework
2.1 Study Objectives and Scope
2.2 Stakeholder Analysis
2.3 Research Assumptions and Limitations
2.4 Research Methodology
2.4.1 Data Collection (Primary and Secondary)
2.4.2 Data Modeling and Estimation Techniques
2.4.3 Data Validation and Triangulation
2.4.4 Analytical and Forecasting Approach
3 Market Dynamics and Trend Analysis
3.1 Market Definition and Structure
3.2 Key Market Drivers
3.3 Market Restraints and Challenges
3.4 Growth Opportunities and Investment Hotspots
3.5 Industry Threats and Risk Assessment
3.6 Technology and Innovation Landscape
3.7 Emerging and High-Growth Markets
3.8 Regulatory and Policy Environment
3.9 Impact of COVID-19 and Recovery Outlook
4 Competitive and Strategic Assessment
4.1 Porter's Five Forces Analysis
4.1.1 Supplier Bargaining Power
4.1.2 Buyer Bargaining Power
4.1.3 Threat of Substitutes
4.1.4 Threat of New Entrants
4.1.5 Competitive Rivalry
4.2 Market Share Analysis of Key Players
4.3 Product Benchmarking and Performance Comparison
5 Global Automotive CV Joint Market, By Joint Type
5.1 Fixed and Rzeppa Joints
5.2 Plunging and Tripod Joints
5.3 Double-Offset Joints
5.4 Cross-Groove and Other Constant-Velocity Joints
6 Global Automotive CV Joint Market, By Driveline Position
6.1 Outboard Wheel-Side Joints
6.2 Inboard Transmission-Side Joints
6.3 Intermediate Shaft and Propeller-Shaft Joints
7 Global Automotive CV Joint Market, By Drive Configuration
7.1 Front-Wheel Drive
7.2 Rear-Wheel Drive
7.3 All-Wheel and Four-Wheel Drive
8 Global Automotive CV Joint Market, By Vehicle Type
8.1 Passenger Cars
8.2 Light Commercial Vehicles
8.3 Electric and Hybrid Vehicles
9 Global Automotive CV Joint Market, By Geography
9.1 North America
9.1.1 United States
9.1.2 Canada
9.1.3 Mexico
9.2 Europe
9.2.1 United Kingdom
9.2.2 Germany
9.2.3 France
9.2.4 Italy
9.2.5 Spain
9.2.6 Netherlands
9.2.7 Belgium
9.2.8 Sweden
9.2.9 Switzerland
9.2.10 Poland
9.2.11 Rest of Europe
9.3 Asia Pacific
9.3.1 China
9.3.2 Japan
9.3.3 India
9.3.4 South Korea
9.3.5 Australia
9.3.6 Indonesia
9.3.7 Thailand
9.3.8 Malaysia
9.3.9 Singapore
9.3.10 Vietnam
9.3.11 Rest of Asia Pacific
9.4 South America
9.4.1 Brazil
9.4.2 Argentina
9.4.3 Colombia
9.4.4 Chile
9.4.5 Peru
9.4.6 Rest of South America
9.5 Rest of the World (RoW)
9.5.1 Middle East
9.5.1.1 Saudi Arabia
9.5.1.2 United Arab Emirates
9.5.1.3 Qatar
9.5.1.4 Israel
9.5.1.5 Rest of Middle East
9.5.2 Africa
9.5.2.1 South Africa
9.5.2.2 Egypt
9.5.2.3 Morocco
9.5.2.4 Rest of Africa
10 Strategic Market Intelligence
10.1 Industry Value Network and Supply Chain Assessment
10.2 White-Space and Opportunity Mapping
10.3 Product Evolution and Market Life Cycle Analysis
10.4 Channel, Distributor, and Go-to-Market Assessment
11 Industry Developments and Strategic Initiatives
11.1 Mergers and Acquisitions
11.2 Partnerships, Alliances, and Joint Ventures
11.3 New Product Launches and Certifications
11.4 Capacity Expansion and Investments
11.5 Other Strategic Initiatives
12 Company Profiles
12.1 GKN Automotive Limited
12.2 NTN Corporation
12.3 American Axle & Manufacturing, Inc.
12.4 Dana Incorporated
12.5 Nexteer Automotive Group Limited
12.6 SKF AB
12.7 JTEKT Corporation
12.8 Hyundai WIA Corporation
12.9 Nachi-Fujikoshi Corp.
12.10 Wanxiang Qianchao Co., Ltd.
12.11 Neapco Holdings LLC
12.12 IFA Group
12.13 GSP Automotive Group
12.14 Schaeffler AG
List of Tables
1 Global Automotive CV Joint Market Outlook, By Region (2023–2034) ($MN)
2 Global Automotive CV Joint Market Outlook, By Joint Type (2023–2034) ($MN)
3 Global Automotive CV Joint Market Outlook, By Fixed and Rzeppa Joints (2023–2034) ($MN)
4 Global Automotive CV Joint Market Outlook, By Plunging and Tripod Joints (2023–2034) ($MN)
5 Global Automotive CV Joint Market Outlook, By Double-Offset Joints (2023–2034) ($MN)
6 Global Automotive CV Joint Market Outlook, By Cross-Groove and Other Constant-Velocity Joints (2023–2034) ($MN)
7 Global Automotive CV Joint Market Outlook, By Driveline Position (2023–2034) ($MN)
8 Global Automotive CV Joint Market Outlook, By Outboard Wheel-Side Joints (2023–2034) ($MN)
9 Global Automotive CV Joint Market Outlook, By Inboard Transmission-Side Joints (2023–2034) ($MN)
10 Global Automotive CV Joint Market Outlook, By Intermediate Shaft and Propeller-Shaft Joints (2023–2034) ($MN)
11 Global Automotive CV Joint Market Outlook, By Drive Configuration (2023–2034) ($MN)
12 Global Automotive CV Joint Market Outlook, By Front-Wheel Drive (2023–2034) ($MN)
13 Global Automotive CV Joint Market Outlook, By Rear-Wheel Drive (2023–2034) ($MN)
14 Global Automotive CV Joint Market Outlook, By All-Wheel and Four-Wheel Drive (2023–2034) ($MN)
15 Global Automotive CV Joint Market Outlook, By Vehicle Type (2023–2034) ($MN)
16 Global Automotive CV Joint Market Outlook, By Passenger Cars (2023–2034) ($MN)
17 Global Automotive CV Joint Market Outlook, By Light Commercial Vehicles (2023–2034) ($MN)
18 Global Automotive CV Joint Market Outlook, By Electric and Hybrid Vehicles (2023–2034) ($MN)
Note: Tables for North America, Europe, APAC, South America, and Rest of the World (RoW) Regions are also represented in the same manner as above.
List of Figures
RESEARCH METHODOLOGY
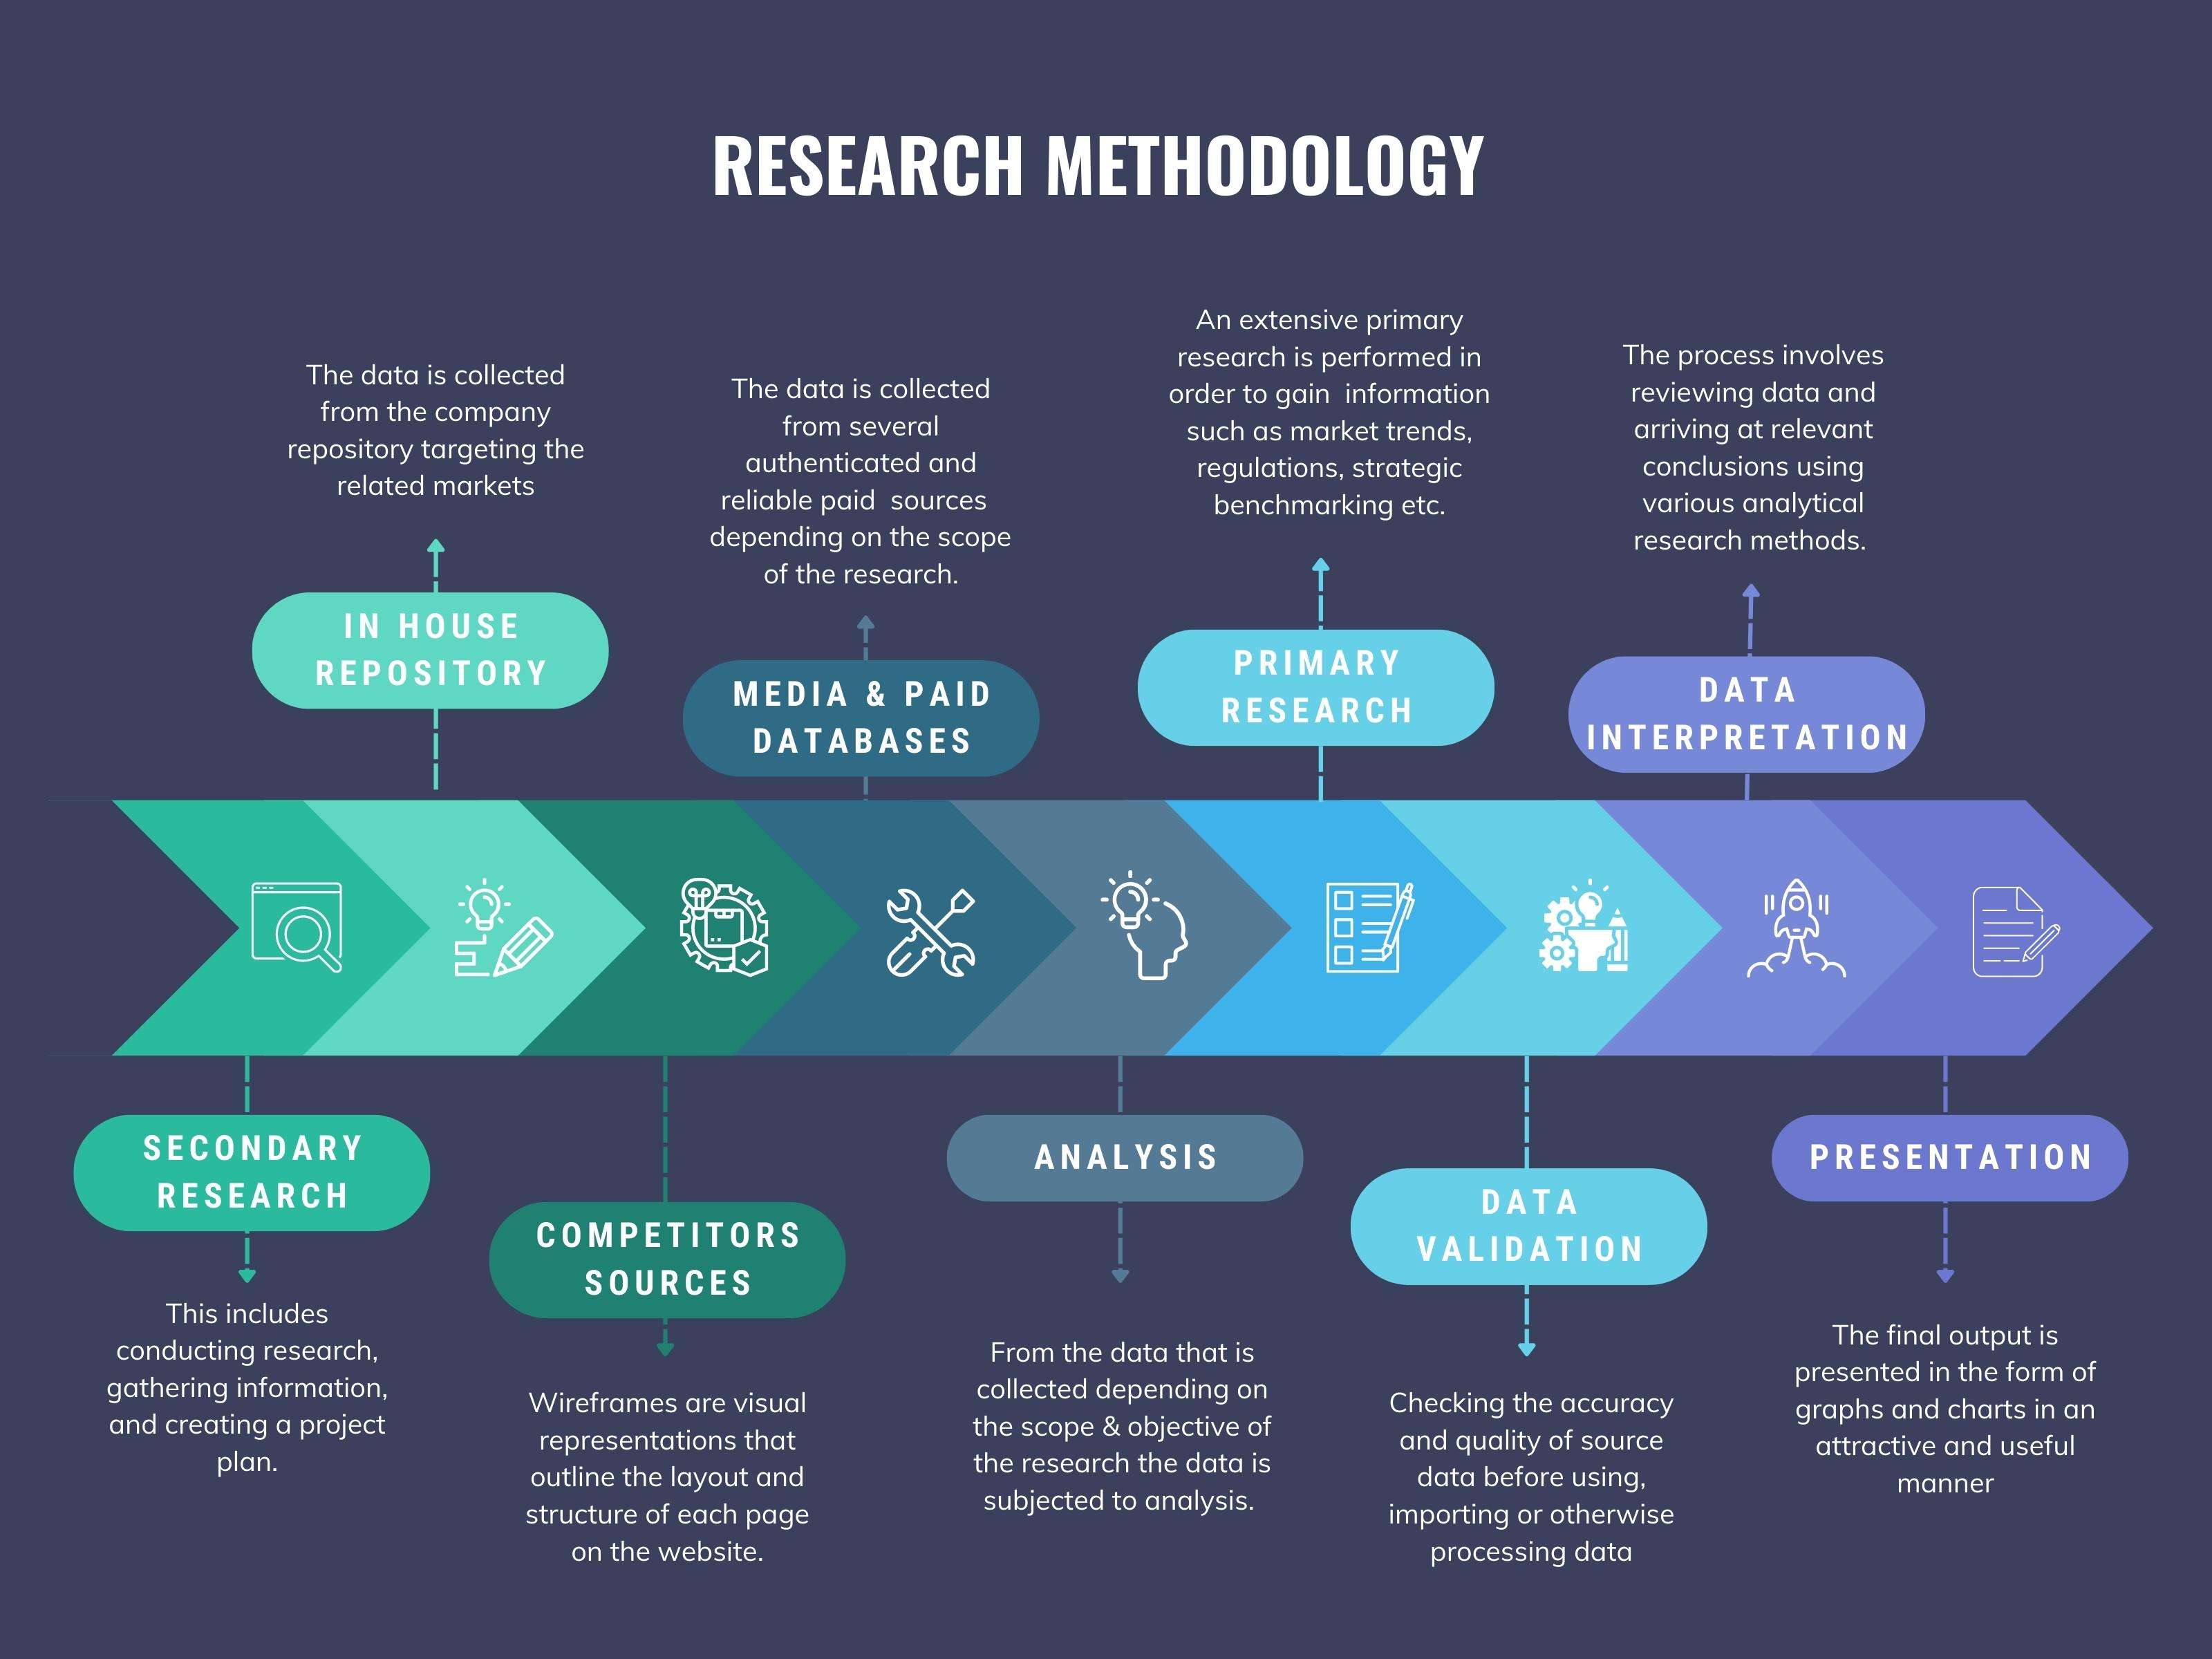
We at ‘Stratistics’ opt for an extensive research approach which involves data mining, data validation, and data analysis. The various research sources include in-house repository, secondary research, competitor’s sources, social media research, client internal data, and primary research.
Our team of analysts prefers the most reliable and authenticated data sources in order to perform the comprehensive literature search. With access to most of the authenticated data bases our team highly considers the best mix of information through various sources to obtain extensive and accurate analysis.
Each report takes an average time of a month and a team of 4 industry analysts. The time may vary depending on the scope and data availability of the desired market report. The various parameters used in the market assessment are standardized in order to enhance the data accuracy.
Data Mining
The data is collected from several authenticated, reliable, paid and unpaid sources and is filtered depending on the scope & objective of the research. Our reports repository acts as an added advantage in this procedure. Data gathering from the raw material suppliers, distributors and the manufacturers is performed on a regular basis, this helps in the comprehensive understanding of the products value chain. Apart from the above mentioned sources the data is also collected from the industry consultants to ensure the objective of the study is in the right direction.
Market trends such as technological advancements, regulatory affairs, market dynamics (Drivers, Restraints, Opportunities and Challenges) are obtained from scientific journals, market related national & international associations and organizations.
Data Analysis
From the data that is collected depending on the scope & objective of the research the data is subjected for the analysis. The critical steps that we follow for the data analysis include:
- Product Lifecycle Analysis
- Competitor analysis
- Risk analysis
- Porters Analysis
- PESTEL Analysis
- SWOT Analysis
The data engineering is performed by the core industry experts considering both the Marketing Mix Modeling and the Demand Forecasting. The marketing mix modeling makes use of multiple-regression techniques to predict the optimal mix of marketing variables. Regression factor is based on a number of variables and how they relate to an outcome such as sales or profits.
Data Validation
The data validation is performed by the exhaustive primary research from the expert interviews. This includes telephonic interviews, focus groups, face to face interviews, and questionnaires to validate our research from all aspects. The industry experts we approach come from the leading firms, involved in the supply chain ranging from the suppliers, distributors to the manufacturers and consumers so as to ensure an unbiased analysis.
We are in touch with more than 15,000 industry experts with the right mix of consultants, CEO's, presidents, vice presidents, managers, experts from both supply side and demand side, executives and so on.
The data validation involves the primary research from the industry experts belonging to:
- Leading Companies
- Suppliers & Distributors
- Manufacturers
- Consumers
- Industry/Strategic Consultants
Apart from the data validation the primary research also helps in performing the fill gap research, i.e. providing solutions for the unmet needs of the research which helps in enhancing the reports quality.
For more details about research methodology, kindly write to us at info@strategymrc.com
Frequently Asked Questions
In case of any queries regarding this report, you can contact the customer service by filing the “Inquiry Before Buy” form available on the right hand side. You may also contact us through email: info@strategymrc.com or phone: +1-301-202-5929
Yes, the samples are available for all the published reports. You can request them by filling the “Request Sample” option available in this page.
Yes, you can request a sample with your specific requirements. All the customized samples will be provided as per the requirement with the real data masked.
All our reports are available in Digital PDF format. In case if you require them in any other formats, such as PPT, Excel etc you can submit a request through “Inquiry Before Buy” form available on the right hand side. You may also contact us through email: info@strategymrc.com or phone: +1-301-202-5929
We offer a free 15% customization with every purchase. This requirement can be fulfilled for both pre and post sale. You may send your customization requirements through email at info@strategymrc.com or call us on +1-301-202-5929.
We have 3 different licensing options available in electronic format.
- Single User Licence: Allows one person, typically the buyer, to have access to the ordered product. The ordered product cannot be distributed to anyone else.
- 2-5 User Licence: Allows the ordered product to be shared among a maximum of 5 people within your organisation.
- Corporate License: Allows the product to be shared among all employees of your organisation regardless of their geographical location.
All our reports are typically be emailed to you as an attachment.
To order any available report you need to register on our website. The payment can be made either through CCAvenue or PayPal payments gateways which accept all international cards.
We extend our support to 6 months post sale. A post sale customization is also provided to cover your unmet needs in the report.
Request Customization
We offer complimentary customization of up to 15% with every purchase. To share your customization requirements, feel free to email us at info@strategymrc.com or call us on +1-301-202-5929. .
Please Note: Customization within the 15% threshold is entirely free of charge. If your request exceeds this limit, we will conduct a feasibility assessment. Following that, a detailed quote and timeline will be provided.
WHY CHOOSE US ?

Assured Quality
Best in class reports with high standard of research integrity

24X7 Research Support
Continuous support to ensure the best customer experience.

Free Customization
Adding more values to your product of interest.

Safe & Secure Access
Providing a secured environment for all online transactions.

Trusted by 600+ Brands
Serving the most reputed brands across the world.