
Ayurvedic Fmcg Products Market
Ayurvedic FMCG Products Market Forecasts to 2034 - Global Analysis By Product (Personal Care Products, Healthcare & Supplements, Food & Beverage Products, Oral Care Products and Other Products), Formulation Type, Distribution Channel, Packaging Type, and End User

|
Years Covered |
2023-2034 |
|
Estimated Year Value (2026) |
US $13.7 BN |
|
Projected Year Value (2034) |
US $44.4 BN |
|
CAGR (2026-2034) |
15.5% |
|
Regions Covered |
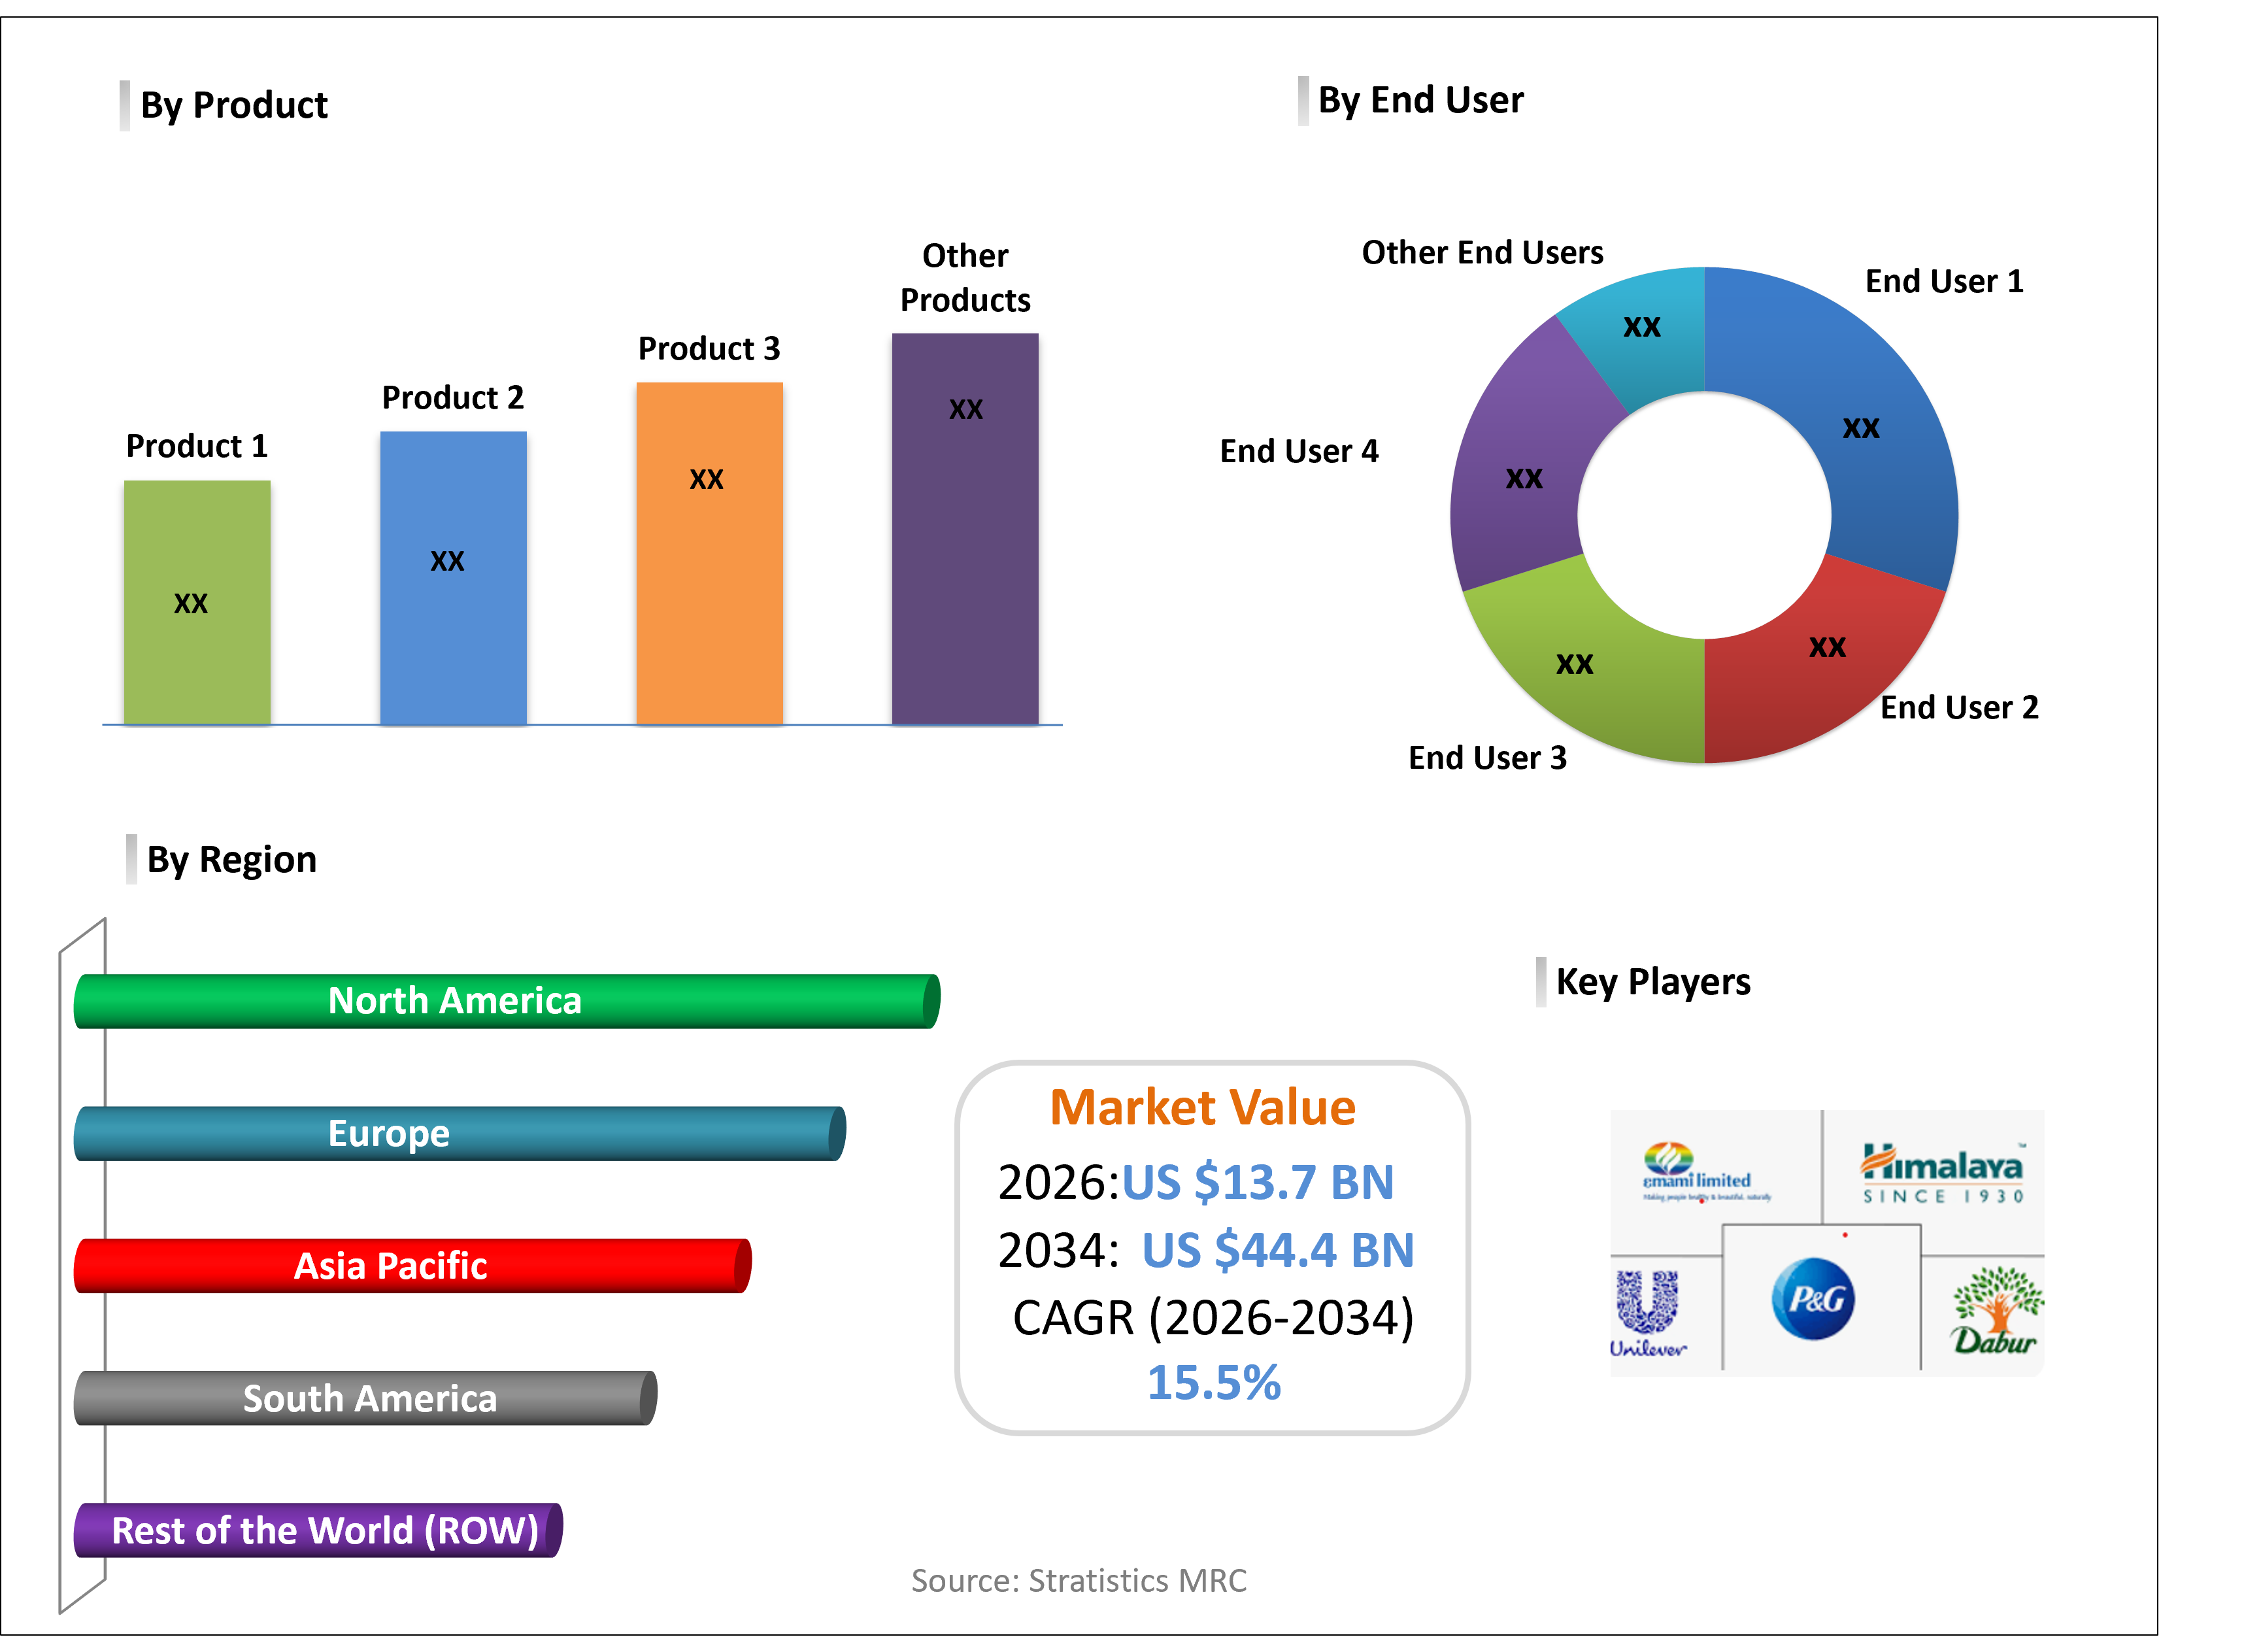
North America, Europe, Asia Pacific, South America, and Rest of the World (RoW) |
|
Countries Covered |
United States, Canada, Mexico, United Kingdom, Germany, France, Italy, Spain, Netherlands, Belgium, Sweden, Switzerland, Poland, Rest of Europe, China, Japan, India, South Korea, Australia, Indonesia, Thailand, Malaysia, Singapore, Vietnam, Rest of Asia Pacific, Brazil, Argentina, Colombia, Chile, Peru, Rest of South America, Saudi Arabia, United Arab Emirates, Qatar, Israel, Rest of Middle East, South Africa, Egypt, Morocco, and Rest of Africa. |
|
Largest Market |
North America |
|
Highest Growing Market |
Asia Pacific |
According to Stratistics MRC, the Global Ayurvedic FMCG Products Market is accounted for $13.7 billion in 2026 and is expected to reach $44.4 billion by 2034 growing at a CAGR of 15.5% during the forecast period. Ayurvedic FMCG Products are consumer goods based on traditional Ayurvedic principles, focusing on natural ingredients and holistic health benefits. These products include personal care items, health supplements, food products, and herbal remedies. They emphasize balance, prevention, and natural healing. Increasing consumer trust in traditional medicine and rising demand for chemical-free products are driving growth. The market is expanding globally as Ayurvedic products gain recognition for their effectiveness and sustainability.
Market Dynamics:
Driver:
Trust in traditional Indian formulations
Ayurvedic formulations are widely trusted for their natural composition and long history of use. This is driving demand for products based on herbal and ancient practices. Consumers perceive these products as safe for long-term usage. Knowledge passed through generations is influencing buying behavior. Brands are highlighting authenticity and heritage to attract consumers. As trust grows, the market continues to expand steadily.
Restraint:
Slow product efficacy perception
Consumers believe that Ayurvedic products take longer to show visible results. This perception reduces preference among users seeking quick outcomes. Modern consumers often compare these products with fast-acting alternatives. Lack of immediate results may affect repeat purchases. Awareness about long-term benefits is still limited in some segments. Brands need to educate consumers about gradual effectiveness. These factors can restrict market growth.
Opportunity:
Global expansion of Ayurvedic brands
Consumers in developed regions are showing interest in herbal and plant-based products. This is encouraging Indian brands to expand globally. Export opportunities are increasing for certified Ayurvedic products. Companies are focusing on quality standards to meet global regulations. Strategic partnerships are also supporting international growth. This trend is expected to create strong growth opportunities.
Threat:
Mislabeling of Ayurvedic ingredients
Some products may not contain the claimed herbal components. This reduces consumer trust and affects brand credibility. Lack of strict regulation increases the risk of misleading claims. Consumers may face safety concerns due to inaccurate information. Regulatory authorities are focusing on improving labeling standards. These issues can negatively impact market growth.
Covid-19 Impact:
The pandemic increased interest in traditional wellness and immunity-boosting products. Ayurvedic products gained popularity due to their natural positioning. Consumers preferred herbal solutions for daily health support. Demand for immunity-related products increased significantly. Online platforms helped brands reach a wider audience. Companies expanded product offerings during this period.
The personal care products segment is expected to be the largest during the forecast period
The personal care products segment is expected to account for the largest market share during the forecast period as daily-use items such as soaps, oils, and shampoos are widely adopted by consumers. These products are integrated into regular hygiene routines across all age groups. Consumers prefer herbal alternatives for safer and long-term usage. Increasing awareness of chemical-free products is supporting demand. Wide product availability across retail channels also drives growth. Continuous innovation in formulations is improving product appeal. These factors are expected to sustain the segment’s dominant position.
The urban consumers segment is expected to have the highest CAGR during the forecast period
Over the forecast period, the urban consumers segment is predicted to witness the highest growth rate due to rising awareness of Ayurvedic benefits among city populations. Increasing disposable income is supporting higher spending on premium herbal products. Urban lifestyles are driving demand for convenient and effective solutions. Consumers are shifting toward natural alternatives for personal care. Strong marketing and brand visibility are influencing adoption. Expansion of modern retail and e-commerce platforms is improving accessibility.
Region with largest share:
During the forecast period, the North America region is expected to hold the largest market share owing to increasing demand for natural and herbal wellness products among consumers in the United States and Canada. Growing awareness of Ayurvedic benefits is supporting product adoption. Consumers are actively seeking chemical-free personal care solutions. Strong presence of international Ayurvedic brands is expanding market reach. Advanced retail and online channels improve product availability. High spending capacity further supports demand.
Region with highest CAGR:
Over the forecast period, the Asia Pacific region is anticipated to exhibit the highest CAGR driven by strong cultural acceptance of Ayurvedic practices in countries such as India, China, and Sri Lanka. Rising population and increasing awareness of herbal products are supporting growth. Government initiatives are promoting traditional medicine systems. Growing middle-class income is boosting spending on wellness products. Expansion of local brands is strengthening market presence. Increasing digital reach is improving product accessibility.

Key players in the market
Some of the key players in Ayurvedic FMCG Products Market include Dabur India Ltd., Patanjali Ayurved Ltd., Himalaya Wellness Company, Emami Limited, ITC Limited, Marico Limited, Godrej Consumer Products Ltd., Colgate-Palmolive Company, Unilever plc, Procter & Gamble Company, Baidhyanath Group, Zandu, Hamdard Laboratories, Herbal Hills Wellness and Maharishi Ayurveda Products.
Key Developments:
In May 2026, Emami Limited entered into a definitive agreement to acquire a 60% stake in IncNut Digital for ₹321 crore to strengthen its digital-first ecosystem. This partnership allows Emami to leverage IncNut's data-driven platforms, such as Vedix, to scale its personalized Ayurvedic personal care offerings and better engage with tech-savvy urban consumers.
In February 2026, Dabur India Limited signed a Memorandum of Understanding (MoU) with the Government of Himachal Pradesh to upscale the sustainable cultivation of elite Himalayan medicinal plants. This collaboration focuses on ensuring the long-term availability of high-quality Ayurvedic herbs while supporting local farming communities through standardized, eco-friendly agricultural practices.
Products Covered:
• Personal Care Products
• Healthcare & Supplements
• Food & Beverage Products
• Oral Care Products
• Other Products
Formulation Types Covered:
• Classical Ayurvedic Formulations
• Proprietary Ayurvedic Products
• Herbal Blends
• Functional Ayurvedic Products
• Other Formulation Types
Distribution Channels Covered:
• Traditional Retail
• Modern Trade
• Online Retail
• Ayurvedic Stores
• Other Distribution Channels
Packaging Types Covered:
• Sustainable Packaging
• Plastic Packaging
• Glass Packaging
• Metal Packaging
• Other Packaging Types
End Users Covered:
• Households
• Health-Conscious Consumers
• Rural Consumers
• Urban Consumers
• Other End Users
Regions Covered:
• North America
o United States
o Canada
o Mexico
• Europe
o United Kingdom
o Germany
o France
o Italy
o Spain
o Netherlands
o Belgium
o Sweden
o Switzerland
o Poland
o Rest of Europe
• Asia Pacific
o China
o Japan
o India
o South Korea
o Australia
o Indonesia
o Thailand
o Malaysia
o Singapore
o Vietnam
o Rest of Asia Pacific
• South America
o Brazil
o Argentina
o Colombia
o Chile
o Peru
o Rest of South America
• Rest of the World (RoW)
o Middle East
§ Saudi Arabia
§ United Arab Emirates
§ Qatar
§ Israel
§ Rest of Middle East
o Africa
§ South Africa
§ Egypt
§ Morocco
§ Rest of Africa
What our report offers:
- Market share assessments for the regional and country-level segments
- Strategic recommendations for the new entrants
- Covers Market data for the years 2023, 2024, 2025, 2026, 2027, 2028, 2030, 2032 and 2034
- Market Trends (Drivers, Constraints, Opportunities, Threats, Challenges, Investment Opportunities, and recommendations)
- Strategic recommendations in key business segments based on the market estimations
- Competitive landscaping mapping the key common trends
- Company profiling with detailed strategies, financials, and recent developments
- Supply chain trends mapping the latest technological advancements
Free Customization Offerings:
All the customers of this report will be entitled to receive one of the following free customization options:
• Company Profiling
o Comprehensive profiling of additional market players (up to 3)
o SWOT Analysis of key players (up to 3)
• Regional Segmentation
o Market estimations, Forecasts and CAGR of any prominent country as per the client's interest (Note: Depends on feasibility check)
• Competitive Benchmarking
o Benchmarking of key players based on product portfolio, geographical presence, and strategic alliances
Table of Contents
1 Executive Summary
1.1 Market Snapshot and Key Highlights
1.2 Growth Drivers, Challenges, and Opportunities
1.3 Competitive Landscape Overview
1.4 Strategic Insights and Recommendations
2 Research Framework
2.1 Study Objectives and Scope
2.2 Stakeholder Analysis
2.3 Research Assumptions and Limitations
2.4 Research Methodology
2.4.1 Data Collection (Primary and Secondary)
2.4.2 Data Modeling and Estimation Techniques
2.4.3 Data Validation and Triangulation
2.4.4 Analytical and Forecasting Approach
3 Market Dynamics and Trend Analysis
3.1 Market Definition and Structure
3.2 Key Market Drivers
3.3 Market Restraints and Challenges
3.4 Growth Opportunities and Investment Hotspots
3.5 Industry Threats and Risk Assessment
3.6 Technology and Innovation Landscape
3.7 Emerging and High-Growth Markets
3.8 Regulatory and Policy Environment
3.9 Impact of COVID-19 and Recovery Outlook
4 Competitive and Strategic Assessment
4.1 Porter's Five Forces Analysis
4.1.1 Supplier Bargaining Power
4.1.2 Buyer Bargaining Power
4.1.3 Threat of Substitutes
4.1.4 Threat of New Entrants
4.1.5 Competitive Rivalry
4.2 Market Share Analysis of Key Players
4.3 Product Benchmarking and Performance Comparison
5 Global Ayurvedic FMCG Products Market, By Product
5.1 Personal Care Products
5.2 Healthcare & Supplements
5.3 Food & Beverage Products
5.4 Oral Care Products
5.5 Other Products
6 Global Ayurvedic FMCG Products Market, By Formulation Type
6.1 Classical Ayurvedic Formulations
6.2 Proprietary Ayurvedic Products
6.3 Herbal Blends
6.4 Functional Ayurvedic Products
6.5 Other Formulation Types
7 Global Ayurvedic FMCG Products Market, By Distribution Channel
7.1 Traditional Retail
7.2 Modern Trade
7.3 Online Retail
7.4 Ayurvedic Stores
7.5 Other Distribution Channels
8 Global Ayurvedic FMCG Products Market, By Packaging Type
8.1 Sustainable Packaging
8.2 Plastic Packaging
8.3 Glass Packaging
8.4 Metal Packaging
8.5 Other Packaging Types
9 Global Ayurvedic FMCG Products Market, By End User
9.1 Households
9.2 Health-Conscious Consumers
9.3 Rural Consumers
9.4 Urban Consumers
9.5 Other End Users
10 Global Ayurvedic FMCG Products Market, By Geography
10.1 North America
10.1.1 United States
10.1.2 Canada
10.1.3 Mexico
10.2 Europe
10.2.1 United Kingdom
10.2.2 Germany
10.2.3 France
10.2.4 Italy
10.2.5 Spain
10.2.6 Netherlands
10.2.7 Belgium
10.2.8 Sweden
10.2.9 Switzerland
10.2.10 Poland
10.2.11 Rest of Europe
10.3 Asia Pacific
10.3.1 China
10.3.2 Japan
10.3.3 India
10.3.4 South Korea
10.3.5 Australia
10.3.6 Indonesia
10.3.7 Thailand
10.3.8 Malaysia
10.3.9 Singapore
10.3.10 Vietnam
10.3.11 Rest of Asia Pacific
10.4 South America
10.4.1 Brazil
10.4.2 Argentina
10.4.3 Colombia
10.4.4 Chile
10.4.5 Peru
10.4.6 Rest of South America
10.5 Rest of the World (RoW)
10.5.1 Middle East
10.5.1.1 Saudi Arabia
10.5.1.2 United Arab Emirates
10.5.1.3 Qatar
10.5.1.4 Israel
10.5.1.5 Rest of Middle East
10.5.2 Africa
10.5.2.1 South Africa
10.5.2.2 Egypt
10.5.2.3 Morocco
10.5.2.4 Rest of Africa
11 Strategic Market Intelligence
11.1 Industry Value Network and Supply Chain Assessment
11.2 White-Space and Opportunity Mapping
11.3 Product Evolution and Market Life Cycle Analysis
11.4 Channel, Distributor, and Go-to-Market Assessment
12 Industry Developments and Strategic Initiatives
12.1 Mergers and Acquisitions
12.2 Partnerships, Alliances, and Joint Ventures
12.3 New Product Launches and Certifications
12.4 Capacity Expansion and Investments
12.5 Other Strategic Initiatives
13 Company Profiles
13.1 Dabur India Ltd.
13.2 Patanjali Ayurved Ltd.
13.3 Himalaya Wellness Company
13.4 Emami Limited
13.5 ITC Limited
13.6 Marico Limited
13.7 Godrej Consumer Products Ltd.
13.8 Colgate-Palmolive Company
13.9 Unilever plc
13.10 Procter & Gamble Company
13.11 Baidhyanath Group
13.12 Zandu
13.13 Hamdard Laboratories
13.14 Herbal Hills Wellness
13.15 Maharishi Ayurveda Products
List of Tables
1 Global Ayurvedic FMCG Products Market Outlook, By Region (2023-2034) ($MN)
2 Global Ayurvedic FMCG Products Market, By Product (2023–2034) ($MN)
3 Global Ayurvedic FMCG Products Market, By Personal Care Products (2023–2034) ($MN)
4 Global Ayurvedic FMCG Products Market, By Healthcare & Supplements (2023–2034) ($MN)
5 Global Ayurvedic FMCG Products Market, By Food & Beverage Products (2023–2034) ($MN)
6 Global Ayurvedic FMCG Products Market, By Oral Care Products (2023–2034) ($MN)
7 Global Ayurvedic FMCG Products Market, By Other Products (2023–2034) ($MN)
8 Global Ayurvedic FMCG Products Market, By Formulation Type (2023–2034) ($MN)
9 Global Ayurvedic FMCG Products Market, By Classical Ayurvedic Formulations (2023–2034) ($MN)
10 Global Ayurvedic FMCG Products Market, By Proprietary Ayurvedic Products (2023–2034) ($MN)
11 Global Ayurvedic FMCG Products Market, By Herbal Blends (2023–2034) ($MN)
12 Global Ayurvedic FMCG Products Market, By Functional Ayurvedic Products (2023–2034) ($MN)
13 Global Ayurvedic FMCG Products Market, By Other Formulation Types (2023–2034) ($MN)
14 Global Ayurvedic FMCG Products Market, By Distribution Channel (2023–2034) ($MN)
15 Global Ayurvedic FMCG Products Market, By Traditional Retail (2023–2034) ($MN)
16 Global Ayurvedic FMCG Products Market, By Modern Trade (2023–2034) ($MN)
17 Global Ayurvedic FMCG Products Market, By Online Retail (2023–2034) ($MN)
18 Global Ayurvedic FMCG Products Market, By Ayurvedic Stores (2023–2034) ($MN)
19 Global Ayurvedic FMCG Products Market, By Other Distribution Channels (2023–2034) ($MN)
20 Global Ayurvedic FMCG Products Market, By Packaging Type (2023–2034) ($MN)
21 Global Ayurvedic FMCG Products Market, By Sustainable Packaging (2023–2034) ($MN)
22 Global Ayurvedic FMCG Products Market, By Plastic Packaging (2023–2034) ($MN)
23 Global Ayurvedic FMCG Products Market, By Glass Packaging (2023–2034) ($MN)
24 Global Ayurvedic FMCG Products Market, By Metal Packaging (2023–2034) ($MN)
25 Global Ayurvedic FMCG Products Market, By Other Packaging Types (2023–2034) ($MN)
26 Global Ayurvedic FMCG Products Market, By End User (2023–2034) ($MN)
27 Global Ayurvedic FMCG Products Market, By Households (2023–2034) ($MN)
28 Global Ayurvedic FMCG Products Market, By Health-Conscious Consumers (2023–2034) ($MN)
29 Global Ayurvedic FMCG Products Market, By Rural Consumers (2023–2034) ($MN)
30 Global Ayurvedic FMCG Products Market, By Urban Consumers (2023–2034) ($MN)
31 Global Ayurvedic FMCG Products Market, By Other End Users (2023–2034) ($MN)
Note: Tables for North America, Europe, APAC, South America, and Rest of the World (RoW) are also represented in the same manner as above.
List of Figures
RESEARCH METHODOLOGY

We at ‘Stratistics’ opt for an extensive research approach which involves data mining, data validation, and data analysis. The various research sources include in-house repository, secondary research, competitor’s sources, social media research, client internal data, and primary research.
Our team of analysts prefers the most reliable and authenticated data sources in order to perform the comprehensive literature search. With access to most of the authenticated data bases our team highly considers the best mix of information through various sources to obtain extensive and accurate analysis.
Each report takes an average time of a month and a team of 4 industry analysts. The time may vary depending on the scope and data availability of the desired market report. The various parameters used in the market assessment are standardized in order to enhance the data accuracy.
Data Mining
The data is collected from several authenticated, reliable, paid and unpaid sources and is filtered depending on the scope & objective of the research. Our reports repository acts as an added advantage in this procedure. Data gathering from the raw material suppliers, distributors and the manufacturers is performed on a regular basis, this helps in the comprehensive understanding of the products value chain. Apart from the above mentioned sources the data is also collected from the industry consultants to ensure the objective of the study is in the right direction.
Market trends such as technological advancements, regulatory affairs, market dynamics (Drivers, Restraints, Opportunities and Challenges) are obtained from scientific journals, market related national & international associations and organizations.
Data Analysis
From the data that is collected depending on the scope & objective of the research the data is subjected for the analysis. The critical steps that we follow for the data analysis include:
- Product Lifecycle Analysis
- Competitor analysis
- Risk analysis
- Porters Analysis
- PESTEL Analysis
- SWOT Analysis
The data engineering is performed by the core industry experts considering both the Marketing Mix Modeling and the Demand Forecasting. The marketing mix modeling makes use of multiple-regression techniques to predict the optimal mix of marketing variables. Regression factor is based on a number of variables and how they relate to an outcome such as sales or profits.
Data Validation
The data validation is performed by the exhaustive primary research from the expert interviews. This includes telephonic interviews, focus groups, face to face interviews, and questionnaires to validate our research from all aspects. The industry experts we approach come from the leading firms, involved in the supply chain ranging from the suppliers, distributors to the manufacturers and consumers so as to ensure an unbiased analysis.
We are in touch with more than 15,000 industry experts with the right mix of consultants, CEO's, presidents, vice presidents, managers, experts from both supply side and demand side, executives and so on.
The data validation involves the primary research from the industry experts belonging to:
- Leading Companies
- Suppliers & Distributors
- Manufacturers
- Consumers
- Industry/Strategic Consultants
Apart from the data validation the primary research also helps in performing the fill gap research, i.e. providing solutions for the unmet needs of the research which helps in enhancing the reports quality.
For more details about research methodology, kindly write to us at info@strategymrc.com
Frequently Asked Questions
In case of any queries regarding this report, you can contact the customer service by filing the “Inquiry Before Buy” form available on the right hand side. You may also contact us through email: info@strategymrc.com or phone: +1-301-202-5929
Yes, the samples are available for all the published reports. You can request them by filling the “Request Sample” option available in this page.
Yes, you can request a sample with your specific requirements. All the customized samples will be provided as per the requirement with the real data masked.
All our reports are available in Digital PDF format. In case if you require them in any other formats, such as PPT, Excel etc you can submit a request through “Inquiry Before Buy” form available on the right hand side. You may also contact us through email: info@strategymrc.com or phone: +1-301-202-5929
We offer a free 15% customization with every purchase. This requirement can be fulfilled for both pre and post sale. You may send your customization requirements through email at info@strategymrc.com or call us on +1-301-202-5929.
We have 3 different licensing options available in electronic format.
- Single User Licence: Allows one person, typically the buyer, to have access to the ordered product. The ordered product cannot be distributed to anyone else.
- 2-5 User Licence: Allows the ordered product to be shared among a maximum of 5 people within your organisation.
- Corporate License: Allows the product to be shared among all employees of your organisation regardless of their geographical location.
All our reports are typically be emailed to you as an attachment.
To order any available report you need to register on our website. The payment can be made either through CCAvenue or PayPal payments gateways which accept all international cards.
We extend our support to 6 months post sale. A post sale customization is also provided to cover your unmet needs in the report.
Request Customization
We offer complimentary customization of up to 15% with every purchase. To share your customization requirements, feel free to email us at info@strategymrc.com or call us on +1-301-202-5929. .
Please Note: Customization within the 15% threshold is entirely free of charge. If your request exceeds this limit, we will conduct a feasibility assessment. Following that, a detailed quote and timeline will be provided.
WHY CHOOSE US ?

Assured Quality
Best in class reports with high standard of research integrity

24X7 Research Support
Continuous support to ensure the best customer experience.

Free Customization
Adding more values to your product of interest.

Safe & Secure Access
Providing a secured environment for all online transactions.

Trusted by 600+ Brands
Serving the most reputed brands across the world.