
Biomass Power Market
Biomass Power Market Forecasts to 2028 - Global Analysis By Feedstock (Solid Biofuel, Liquid Biofuel and Other Feedstocks), Technology (Combustion, Gasification and Other Technologies), End User (Industrial, Commercial, Residential & Other End User) and By Geography

|
Years Covered |
2020-2028 |
|
Estimated Year Value (2022) |
US $70.30 BN |
|
Projected Year Value (2028) |
US $154.32 BN |
|
CAGR (2022 - 2028) |
14% |
|
Regions Covered |
North America, Europe, Asia Pacific, South America, and Middle East & Africa |
|
Countries Covered |
US, Canada, Mexico, Germany, UK, Italy, France, Spain, Japan, China, India, Australia, New Zealand, South Korea, Rest of Asia Pacific, South America, Argentina, Brazil, Chile, Middle East & Africa, Saudi Arabia, UAE, Qatar, and South Africa |
|
Largest Market |
North America |
|
Highest Growing Market |
Europe |
According to Stratistics MRC, the Global Biomass Power Market is accounted for $70.30 billion in 2022 and is expected to reach $154.32 billion by 2028 growing at a CAGR of 14% during the forecast period. Biomass power is energy generated or produced by living or non living organisms. The most common biomass materials used for energy are plants, such as corn and soy etc. The energy from these organisms can be burned to create heat or converted into electricity. This biogas is used to produce energy by various processes such as thermal conversion, gasification, bio fuel, bio char etc. These biomass is rich in hydrogen, carbon etc. Biomass is an integral part of earth’s carbon cycle. The carbon cycle is the process by which carbon is exchanged between all layers of the earth. Hence the above factors are boosting in the market growth.
According to the BP Statistical Review of World Energy 2022, the United States produced 643 thousand barrels of oil equivalent of bio fuel per day, i.e., an increase of about 7.1% when compared to the previous year's value.
Market Dynamics:
Driver:
Rapid adoption of biomass power generation
Biomass power generation is increasingly being adopted across the globe to meet policy targets for reliable, affordable, and secure supply of energy in order to promote economic development and improve electricity access, in addition rapid industrialization in developing and emerging economies such as China, India, and Brazil is fuelling the demand for energy. Utilization of biomass resources for power generation forms an important part of the strategic initiatives by various governments and institutions. These initiatives aim to reorganize the national energy economies and augment the share of renewable energy in the overall power generation mix which is motivating the market growth.
Restraint:
Presence of alternative renewable energy source
Renewable sources of energy such as solar and wind energy have evolved as better alternatives due to vigorous research and development and giant capital investments. These alternative sources have lead to remarkable power generation and require less operational costs than biomass power. Furthermore, the incapacity of solar and wind energy to provide continuous power has been overcome with the evolution of battery energy storage systems, thus the lower costs and increasing adoption of solar and wind energy hinders the growth of the biomass power market.
Opportunity:
Regulatory framework and government support
The supporting Regulatory framework and government grants and funding programs that provide investment subsidies and tax benefits play a key role in encouraging power generating companies and utilities to switch to environment-friendly biomass for power generation. Moreover, biomass can compete with conservative power sources with the availability of low cost agricultural or forestry wastes and residues. Even in the regions where feedstock is expensive, the cost of electricity from biomass is still more competitive than that from coal-fired generation, making biomass ideal for off-grid power supply are likely to fuel the global biomass power generation market.
Threat:
Seasonal Nature of Biomass Power
Seasonal nature of biomass feedstock, along with transportation and storage problems, create severe challenges for plant operators. The accessibility of biomass feedstock depends upon the climatic conditions of the region they grow in and the cultivation period. Additionally, the cost of biomass feedstock is subject to climatic conditions and availability. Furthermore, the wet disposition of biomass makes transportation and storage a costly affair. Moreover, in order to avoid shortage and make certain availability throughout the year, biomass plant operators need to stock up the biomass feedstock, which requires specific storage facilities to prevent an increase in moisture content.
Covid-19 Impact
The corona virus pandemic has a negative impact on the market for biomass power generation. The development of the global biomass power generating market was greatly impacted by strict lockdowns, suspended commercial and industrial operations, and limitations placed by certain governments because of large-scale transmission capacities. Biogas and derivatives market participants are overcome the crisis by concentrating on efficient strategies. Hence pandemic has hampered the growth of the biomass power market.
The solid bio fuel segment is expected to be the largest during the forecast period
The solid bio fuel segment is estimated to have a lucrative growth, due to its biological origin which may be used as fuel for heat production or electricity generation. In energy statistics, solid bio fuels is a product aggregate equal to the sum of charcoal, fuel wood, wood residues and by-products, black liquor, biogases, animal waste, other vegetal materials and residuals and renewable fraction of industrial waste. They provide advantages of emission of non-toxic materials which reduces the risk of cancer and breathing problems in human beings. Moreover, they are friendly to the environment because they reduce the risk of global warming thus, propelling the market growth.
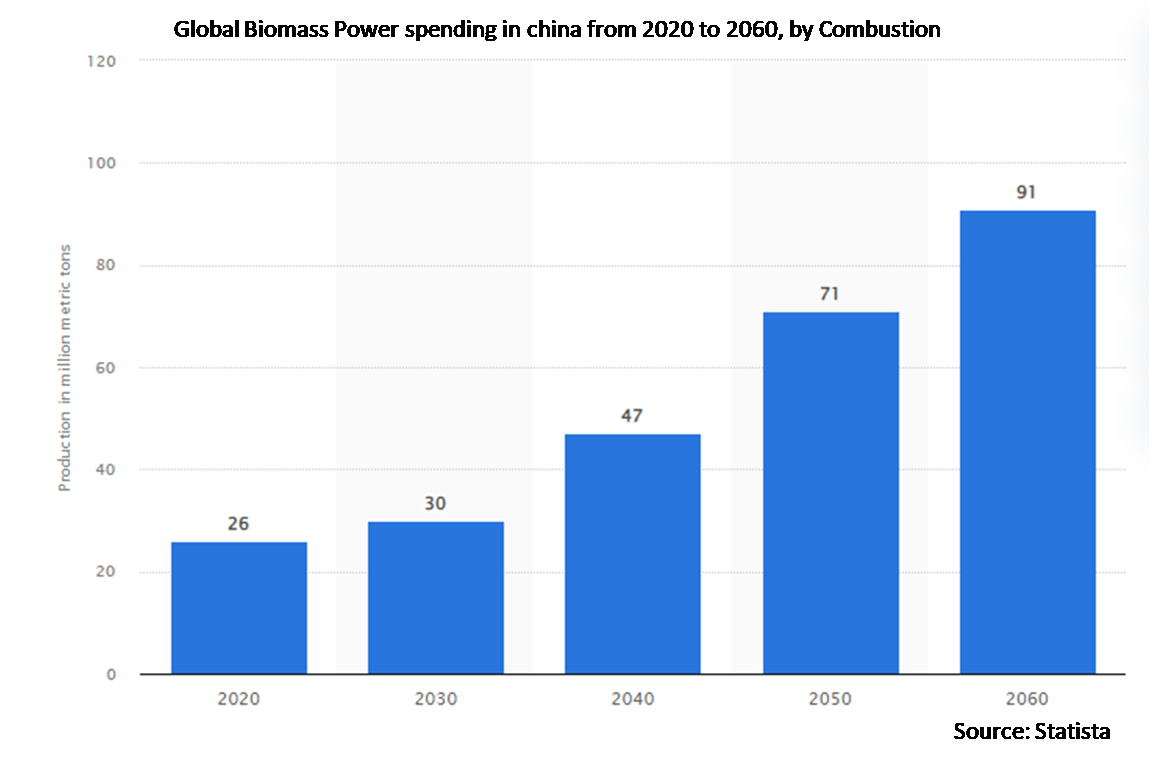
The combustion segment is expected to have the highest CAGR during the forecast period
The combustion segment is anticipated to witness the fastest CAGR growth during the forecast period, due to its benefits of protecting animal and human health by reducing pathogens. Convert nutrients in manure into a form that is more accessible for plants to use compared to raw manure. This can increase crop productivity and yield. Recycle nutrients on the farm, creating an economically and environmentally sustainable food production system. Moreover, it reduces greenhouse gas emissions by capturing methane gas that may otherwise have been lost to the atmosphere and by displacing fossil fuel energy use thereby enhancing the growth of the market.
Region with highest share:
North America is projected to hold the largest market share during the forecast period owing to the recent discovery of shale gas reserves in the region has resulted in gas-based power generation, which is gaining higher growth over coal-based power generation in the region in the past decade. Installers and system providers usually hold stock of major equipment in inventory. The North America locale is significantly reliant upon coal for power age. The new disclosure of shale gas holds in the area has brought about gas-based power age, which is acquiring higher development over coal-based power age thereby accelerating the market growth.
Region with highest CAGR:
Europe is projected to have the highest CAGR over the forecast period, owing to their aim be carbon-neutral by 2050. The European Union’s commitments as part of the Paris agreement, biomass feedstock are directly combusted in a furnace with air, to convert water into steam. The produced steam is used to drive a steam turbine to generate electricity. The new project commissioned in was done in locations, such as Florida, Georgia, California, and Hawaii. Furthermore, over 384 MW of biomass power projects are under different development phases in the country. These factors are anticipated to boost the market growth in the country over the forecast period.

Key players in the market
Some of the key players profiled in the Biomass Power Market include Babcock & Wilcox Company, Ameresco, Alstom SA, Engie, Indus Green Bio Energy Pvt. Ltd, NTPC, Oulun Energia Oy, Acciona, Helius Energy Plc, DONG Energy A/S, Fourth Partner Energy, Alstom SA, MGT Power Ltd., Vattenfall AB and Drax Group plc.
Key Developments:
In Nov 2022, Babcock & Wilcox Announces Agreement to Study Development of Biomass-to-Hydrogen Project in South Korea Using BrightLoop™ Technology for a hydrogen generation facility using biomass fuel in South Korea.
In Nov 2022, Ameresco Announces the Acquisition of Wind Farm in West County Cork, Ireland, his three-turbine site is designed to deliver a total combined capacity of 5MW of clean energy.
In Dec 2020, Babcock & Wilcox and Chart Industries to Collaborate on Hydrogen Innovation Utilizing B&W’s BrightLoopTM Technology utilizing Chart’s integrated hydrogen liquefaction and cryogenic carbon capture equipment and expertise. Together, this solution provides economic generation of low-carbon hydrogen and supplies cost-effective, transportable forms of liquid hydrogen and carbon dioxide.
Feedstock’s Covered:
• Solid Biofuel
• Liquid Biofuel
• Biogas
• Other Feedstock’s
Technologies Covered:
• Combustion
• Gasification
• Anaerobic Digestion
• Other Technologies
End Users Covered:
• Industrial
• Commercial
• Residential
• Other End Users
Regions Covered:
• North America
o US
o Canada
o Mexico
• Europe
o Germany
o UK
o Italy
o France
o Spain
o Rest of Europe
• Asia Pacific
o Japan
o China
o India
o Australia
o New Zealand
o South Korea
o Rest of Asia Pacific
• South America
o Argentina
o Brazil
o Chile
o Rest of South America
• Middle East & Africa
o Saudi Arabia
o UAE
o Qatar
o South Africa
o Rest of Middle East & Africa
What our report offers:
- Market share assessments for the regional and country-level segments
- Strategic recommendations for the new entrants
- Covers Market data for the years 2020, 2021, 2022, 2025, and 2028
- Market Trends (Drivers, Constraints, Opportunities, Threats, Challenges, Investment Opportunities, and recommendations)
- Strategic recommendations in key business segments based on the market estimations
- Competitive landscaping mapping the key common trends
- Company profiling with detailed strategies, financials, and recent developments
- Supply chain trends mapping the latest technological advancements
Free Customization Offerings:
All the customers of this report will be entitled to receive one of the following free customization options:
• Company Profiling
o Comprehensive profiling of additional market players (up to 3)
o SWOT Analysis of key players (up to 3)
• Regional Segmentation
o Market estimations, Forecasts and CAGR of any prominent country as per the client's interest (Note: Depends on feasibility check)
• Competitive Benchmarking
o Benchmarking of key players based on product portfolio, geographical presence, and strategic alliances
Table of Contents
1 Executive Summary
2 Preface
2.1 Abstract
2.2 Stake Holders
2.3 Research Scope
2.4 Research Methodology
2.4.1 Data Mining
2.4.2 Data Analysis
2.4.3 Data Validation
2.4.4 Research Approach
2.5 Research Sources
2.5.1 Primary Research Sources
2.5.2 Secondary Research Sources
2.5.3 Assumptions
3 Market Trend Analysis
3.1 Introduction
3.2 Drivers
3.3 Restraints
3.4 Opportunities
3.5 Threats
3.6 Technology Analysis
3.7 End User Analysis
3.8 Emerging Markets
3.9 Impact of Covid-19
4 Porters Five Force Analysis
4.1 Bargaining power of suppliers
4.2 Bargaining power of buyers
4.3 Threat of substitutes
4.4 Threat of new entrants
4.5 Competitive rivalry
5 Global Biomass Power Market, By Feedstock
5.1 Introduction
5.2 Solid Biofuel
5.3 Liquid Biofuel
5.4 Biogas
5.5 Other Feedstocks
6 Global Biomass Power Market, By Technology
6.1 Introduction
6.2 Combustion
6.3 Gasification
6.4 Anaerobic Digestion
6.5 Other Technologies
7 Global Biomass Power Market, By End User
7.1 Introduction
7.2 Industrial
7.3 Commercial
7.4 Residential
7.5 Other End Users
8 Global Biomass Power Market, By Geography
8.1 Introduction
8.2 North America
8.2.1 US
8.2.2 Canada
8.2.3 Mexico
8.3 Europe
8.3,1 Germany
8.3.2 UK
8.3,2 Italy
8.3.3 France
8.3,3 Spain
8.3.4 Rest of Europe
8.4 Asia Pacific
8.4.1 Japan
8.4.2 China
8.4.3 India
8.4.4 Australia
8.4.5 New Zealand
8.4.6 South Korea
8.4.7 Rest of Asia Pacific
8.5 South America
8.5.1 Argentina
8.5.2 Brazil
8.5.3 Chile
8.5.4 Rest of South America
8.6 Middle East & Africa
8.6.1 Saudi Arabia
8.6.2 UAE
8.6.3 Qatar
8.6.4 South Africa
8.6.5 Rest of Middle East & Africa
9 Key Developments
9.1 Agreements, Partnerships, Collaborations and Joint Ventures
9.2 Acquisitions & Mergers
9.3 New Product Launch
9.4 Expansions
9.5 Other Key Strategies
10 Company Profiling
10.1 Babcock & Wilcox Company
10.2 Ameresco
10.3 Alstom SA
10.4 Engie
10.5 Indus Green Bio Energy Pvt. Ltd
10.6 NTPC
10.7 Oulun Energia Oy
10.8 Acciona
10.9 Helius Energy Plc
10.10 DONG Energy A/S
10.11 Fourth Partner Energy
10.12 Alstom SA
10.13 MGT Power Ltd.
10.14 Vattenfall AB
10.15 Drax Group plc
List of Tables
1 Global Biomass Power Market Outlook, By Region (2020-2028) ($MN)
2 Global Biomass Power Market Outlook, By Feedstock (2020-2028) ($MN)
3 Global Biomass Power Market Outlook, By Introduction (2020-2028) ($MN)
4 Global Biomass Power Market Outlook, By Solid Biofuel (2020-2028) ($MN)
5 Global Biomass Power Market Outlook, By Liquid Biofuel (2020-2028) ($MN)
6 Global Biomass Power Market Outlook, By Biogas (2020-2028) ($MN)
7 Global Biomass Power Market Outlook, By Other Feedstocks (2020-2028) ($MN)
8 Global Biomass Power Market Outlook, By Technology (2020-2028) ($MN)
9 Global Biomass Power Market Outlook, By Introduction (2020-2028) ($MN)
10 Global Biomass Power Market Outlook, By Combustion (2020-2028) ($MN)
11 Global Biomass Power Market Outlook, By Gasification (2020-2028) ($MN)
12 Global Biomass Power Market Outlook, By Anaerobic Digestion (2020-2028) ($MN)
13 Global Biomass Power Market Outlook, By Other Technologies (2020-2028) ($MN)
14 Global Biomass Power Market Outlook, By End User (2020-2028) ($MN)
15 Global Biomass Power Market Outlook, By Introduction (2020-2028) ($MN)
16 Global Biomass Power Market Outlook, By Industrial (2020-2028) ($MN)
17 Global Biomass Power Market Outlook, By Commercial (2020-2028) ($MN)
18 Global Biomass Power Market Outlook, By Residential (2020-2028) ($MN)
19 Global Biomass Power Market Outlook, By Other End Users (2020-2028) ($MN)
20 North America Biomass Power Market Outlook, By Country (2020-2028) ($MN)
21 North America Biomass Power Market Outlook, By Feedstock (2020-2028) ($MN)
22 North America Biomass Power Market Outlook, By Introduction (2020-2028) ($MN)
23 North America Biomass Power Market Outlook, By Solid Biofuel (2020-2028) ($MN)
24 North America Biomass Power Market Outlook, By Liquid Biofuel (2020-2028) ($MN)
25 North America Biomass Power Market Outlook, By Biogas (2020-2028) ($MN)
26 North America Biomass Power Market Outlook, By Other Feedstocks (2020-2028) ($MN)
27 North America Biomass Power Market Outlook, By Technology (2020-2028) ($MN)
28 North America Biomass Power Market Outlook, By Introduction (2020-2028) ($MN)
29 North America Biomass Power Market Outlook, By Combustion (2020-2028) ($MN)
30 North America Biomass Power Market Outlook, By Gasification (2020-2028) ($MN)
31 North America Biomass Power Market Outlook, By Anaerobic Digestion (2020-2028) ($MN)
32 North America Biomass Power Market Outlook, By Other Technologies (2020-2028) ($MN)
33 North America Biomass Power Market Outlook, By End User (2020-2028) ($MN)
34 North America Biomass Power Market Outlook, By Introduction (2020-2028) ($MN)
35 North America Biomass Power Market Outlook, By Industrial (2020-2028) ($MN)
36 North America Biomass Power Market Outlook, By Commercial (2020-2028) ($MN)
37 North America Biomass Power Market Outlook, By Residential (2020-2028) ($MN)
38 North America Biomass Power Market Outlook, By Other End Users (2020-2028) ($MN)
39 Europe Biomass Power Market Outlook, By Country (2020-2028) ($MN)
40 Europe Biomass Power Market Outlook, By Feedstock (2020-2028) ($MN)
41 Europe Biomass Power Market Outlook, By Introduction (2020-2028) ($MN)
42 Europe Biomass Power Market Outlook, By Solid Biofuel (2020-2028) ($MN)
43 Europe Biomass Power Market Outlook, By Liquid Biofuel (2020-2028) ($MN)
44 Europe Biomass Power Market Outlook, By Biogas (2020-2028) ($MN)
45 Europe Biomass Power Market Outlook, By Other Feedstocks (2020-2028) ($MN)
46 Europe Biomass Power Market Outlook, By Technology (2020-2028) ($MN)
47 Europe Biomass Power Market Outlook, By Introduction (2020-2028) ($MN)
48 Europe Biomass Power Market Outlook, By Combustion (2020-2028) ($MN)
49 Europe Biomass Power Market Outlook, By Gasification (2020-2028) ($MN)
50 Europe Biomass Power Market Outlook, By Anaerobic Digestion (2020-2028) ($MN)
51 Europe Biomass Power Market Outlook, By Other Technologies (2020-2028) ($MN)
52 Europe Biomass Power Market Outlook, By End User (2020-2028) ($MN)
53 Europe Biomass Power Market Outlook, By Introduction (2020-2028) ($MN)
54 Europe Biomass Power Market Outlook, By Industrial (2020-2028) ($MN)
55 Europe Biomass Power Market Outlook, By Commercial (2020-2028) ($MN)
56 Europe Biomass Power Market Outlook, By Residential (2020-2028) ($MN)
57 Europe Biomass Power Market Outlook, By Other End Users (2020-2028) ($MN)
58 Asia Pacific Biomass Power Market Outlook, By Country (2020-2028) ($MN)
59 Asia Pacific Biomass Power Market Outlook, By Feedstock (2020-2028) ($MN)
60 Asia Pacific Biomass Power Market Outlook, By Introduction (2020-2028) ($MN)
61 Asia Pacific Biomass Power Market Outlook, By Solid Biofuel (2020-2028) ($MN)
62 Asia Pacific Biomass Power Market Outlook, By Liquid Biofuel (2020-2028) ($MN)
63 Asia Pacific Biomass Power Market Outlook, By Biogas (2020-2028) ($MN)
64 Asia Pacific Biomass Power Market Outlook, By Other Feedstocks (2020-2028) ($MN)
65 Asia Pacific Biomass Power Market Outlook, By Technology (2020-2028) ($MN)
66 Asia Pacific Biomass Power Market Outlook, By Introduction (2020-2028) ($MN)
67 Asia Pacific Biomass Power Market Outlook, By Combustion (2020-2028) ($MN)
68 Asia Pacific Biomass Power Market Outlook, By Gasification (2020-2028) ($MN)
69 Asia Pacific Biomass Power Market Outlook, By Anaerobic Digestion (2020-2028) ($MN)
70 Asia Pacific Biomass Power Market Outlook, By Other Technologies (2020-2028) ($MN)
71 Asia Pacific Biomass Power Market Outlook, By End User (2020-2028) ($MN)
72 Asia Pacific Biomass Power Market Outlook, By Introduction (2020-2028) ($MN)
73 Asia Pacific Biomass Power Market Outlook, By Industrial (2020-2028) ($MN)
74 Asia Pacific Biomass Power Market Outlook, By Commercial (2020-2028) ($MN)
75 Asia Pacific Biomass Power Market Outlook, By Residential (2020-2028) ($MN)
76 Asia Pacific Biomass Power Market Outlook, By Other End Users (2020-2028) ($MN)
77 South America Biomass Power Market Outlook, By Country (2020-2028) ($MN)
78 South America Biomass Power Market Outlook, By Feedstock (2020-2028) ($MN)
79 South America Biomass Power Market Outlook, By Introduction (2020-2028) ($MN)
80 South America Biomass Power Market Outlook, By Solid Biofuel (2020-2028) ($MN)
81 South America Biomass Power Market Outlook, By Liquid Biofuel (2020-2028) ($MN)
82 South America Biomass Power Market Outlook, By Biogas (2020-2028) ($MN)
83 South America Biomass Power Market Outlook, By Other Feedstocks (2020-2028) ($MN)
84 South America Biomass Power Market Outlook, By Technology (2020-2028) ($MN)
85 South America Biomass Power Market Outlook, By Introduction (2020-2028) ($MN)
86 South America Biomass Power Market Outlook, By Combustion (2020-2028) ($MN)
87 South America Biomass Power Market Outlook, By Gasification (2020-2028) ($MN)
88 South America Biomass Power Market Outlook, By Anaerobic Digestion (2020-2028) ($MN)
89 South America Biomass Power Market Outlook, By Other Technologies (2020-2028) ($MN)
90 South America Biomass Power Market Outlook, By End User (2020-2028) ($MN)
91 South America Biomass Power Market Outlook, By Introduction (2020-2028) ($MN)
92 South America Biomass Power Market Outlook, By Industrial (2020-2028) ($MN)
93 South America Biomass Power Market Outlook, By Commercial (2020-2028) ($MN)
94 South America Biomass Power Market Outlook, By Residential (2020-2028) ($MN)
95 South America Biomass Power Market Outlook, By Other End Users (2020-2028) ($MN)
96 Middle East & Africa Biomass Power Market Outlook, By Country (2020-2028) ($MN)
97 Middle East & Africa Biomass Power Market Outlook, By Feedstock (2020-2028) ($MN)
98 Middle East & Africa Biomass Power Market Outlook, By Introduction (2020-2028) ($MN)
99 Middle East & Africa Biomass Power Market Outlook, By Solid Biofuel (2020-2028) ($MN)
100 Middle East & Africa Biomass Power Market Outlook, By Liquid Biofuel (2020-2028) ($MN)
101 Middle East & Africa Biomass Power Market Outlook, By Biogas (2020-2028) ($MN)
102 Middle East & Africa Biomass Power Market Outlook, By Other Feedstocks (2020-2028) ($MN)
103 Middle East & Africa Biomass Power Market Outlook, By Technology (2020-2028) ($MN)
104 Middle East & Africa Biomass Power Market Outlook, By Introduction (2020-2028) ($MN)
105 Middle East & Africa Biomass Power Market Outlook, By Combustion (2020-2028) ($MN)
106 Middle East & Africa Biomass Power Market Outlook, By Gasification (2020-2028) ($MN)
107 Middle East & Africa Biomass Power Market Outlook, By Anaerobic Digestion (2020-2028) ($MN)
108 Middle East & Africa Biomass Power Market Outlook, By Other Technologies (2020-2028) ($MN)
109 Middle East & Africa Biomass Power Market Outlook, By End User (2020-2028) ($MN)
110 Middle East & Africa Biomass Power Market Outlook, By Introduction (2020-2028) ($MN)
111 Middle East & Africa Biomass Power Market Outlook, By Industrial (2020-2028) ($MN)
112 Middle East & Africa Biomass Power Market Outlook, By Commercial (2020-2028) ($MN)
113 Middle East & Africa Biomass Power Market Outlook, By Residential (2020-2028) ($MN)
114 Middle East & Africa Biomass Power Market Outlook, By Other End Users (2020-2028) ($MN)
List of Figures
RESEARCH METHODOLOGY

We at ‘Stratistics’ opt for an extensive research approach which involves data mining, data validation, and data analysis. The various research sources include in-house repository, secondary research, competitor’s sources, social media research, client internal data, and primary research.
Our team of analysts prefers the most reliable and authenticated data sources in order to perform the comprehensive literature search. With access to most of the authenticated data bases our team highly considers the best mix of information through various sources to obtain extensive and accurate analysis.
Each report takes an average time of a month and a team of 4 industry analysts. The time may vary depending on the scope and data availability of the desired market report. The various parameters used in the market assessment are standardized in order to enhance the data accuracy.
Data Mining
The data is collected from several authenticated, reliable, paid and unpaid sources and is filtered depending on the scope & objective of the research. Our reports repository acts as an added advantage in this procedure. Data gathering from the raw material suppliers, distributors and the manufacturers is performed on a regular basis, this helps in the comprehensive understanding of the products value chain. Apart from the above mentioned sources the data is also collected from the industry consultants to ensure the objective of the study is in the right direction.
Market trends such as technological advancements, regulatory affairs, market dynamics (Drivers, Restraints, Opportunities and Challenges) are obtained from scientific journals, market related national & international associations and organizations.
Data Analysis
From the data that is collected depending on the scope & objective of the research the data is subjected for the analysis. The critical steps that we follow for the data analysis include:
- Product Lifecycle Analysis
- Competitor analysis
- Risk analysis
- Porters Analysis
- PESTEL Analysis
- SWOT Analysis
The data engineering is performed by the core industry experts considering both the Marketing Mix Modeling and the Demand Forecasting. The marketing mix modeling makes use of multiple-regression techniques to predict the optimal mix of marketing variables. Regression factor is based on a number of variables and how they relate to an outcome such as sales or profits.
Data Validation
The data validation is performed by the exhaustive primary research from the expert interviews. This includes telephonic interviews, focus groups, face to face interviews, and questionnaires to validate our research from all aspects. The industry experts we approach come from the leading firms, involved in the supply chain ranging from the suppliers, distributors to the manufacturers and consumers so as to ensure an unbiased analysis.
We are in touch with more than 15,000 industry experts with the right mix of consultants, CEO's, presidents, vice presidents, managers, experts from both supply side and demand side, executives and so on.
The data validation involves the primary research from the industry experts belonging to:
- Leading Companies
- Suppliers & Distributors
- Manufacturers
- Consumers
- Industry/Strategic Consultants
Apart from the data validation the primary research also helps in performing the fill gap research, i.e. providing solutions for the unmet needs of the research which helps in enhancing the reports quality.
For more details about research methodology, kindly write to us at info@strategymrc.com
Frequently Asked Questions
In case of any queries regarding this report, you can contact the customer service by filing the “Inquiry Before Buy” form available on the right hand side. You may also contact us through email: info@strategymrc.com or phone: +1-301-202-5929
Yes, the samples are available for all the published reports. You can request them by filling the “Request Sample” option available in this page.
Yes, you can request a sample with your specific requirements. All the customized samples will be provided as per the requirement with the real data masked.
All our reports are available in Digital PDF format. In case if you require them in any other formats, such as PPT, Excel etc you can submit a request through “Inquiry Before Buy” form available on the right hand side. You may also contact us through email: info@strategymrc.com or phone: +1-301-202-5929
We offer a free 15% customization with every purchase. This requirement can be fulfilled for both pre and post sale. You may send your customization requirements through email at info@strategymrc.com or call us on +1-301-202-5929.
We have 3 different licensing options available in electronic format.
- Single User Licence: Allows one person, typically the buyer, to have access to the ordered product. The ordered product cannot be distributed to anyone else.
- 2-5 User Licence: Allows the ordered product to be shared among a maximum of 5 people within your organisation.
- Corporate License: Allows the product to be shared among all employees of your organisation regardless of their geographical location.
All our reports are typically be emailed to you as an attachment.
To order any available report you need to register on our website. The payment can be made either through CCAvenue or PayPal payments gateways which accept all international cards.
We extend our support to 6 months post sale. A post sale customization is also provided to cover your unmet needs in the report.
Request Customization
We provide a free 15% customization on every purchase. This requirement can be fulfilled for both pre and post sale. You may send your customization requirements through email at info@strategymrc.com or call us on +1-301-202-5929.
Note: This customization is absolutely free until it falls under the 15% bracket. If your requirement exceeds this a feasibility check will be performed. Post that, a quote will be provided along with the timelines.
WHY CHOOSE US ?

Assured Quality
Best in class reports with high standard of research integrity

24X7 Research Support
Continuous support to ensure the best customer experience.

Free Customization
Adding more values to your product of interest.

Safe & Secure Access
Providing a secured environment for all online transactions.

Trusted by 600+ Brands
Serving the most reputed brands across the world.