
Busbar Protection Market
Busbar Protection - Global Market Outlook (2019-2027)
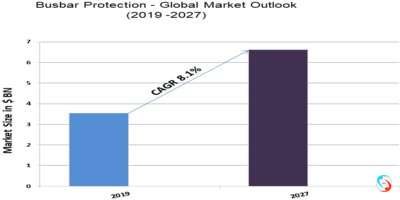
According to Stratistics MRC, the Global Busbar Protection Market is accounted for $3.55 billion in 2019 and is expected to reach $6.62 billion by 2027 growing at a CAGR of 8.1% during the forecast period. Increasing investments in transmission and distribution infrastructure and operational benefits of busbar protection relays are the major factors driving the market growth. However, a delay in grid expansion projects is restraining the market growth. Moreover, adoption of HVDC technology and increased investments in smart grids and energy systems would provide ample opportunities for the market growth.
Busbar protection is a protection scheme meant to protect the busbar from an electrical fault. Various feeders are connected to a busbar through circuit breaker in any of the bus configuration. Busbar protection scheme incorporates busbar differential relay which may either be high impedance or low impedance differential relay. There are different and the number of busbar protection schemes, the most popular amongst are differential protection, frame-earth protection, reverse-blocking/interlocking protection.
Based on impedance, the low impedance segment is likely to have a huge demand due to increasing investment in the smart grid and smart substation. Modern microprocessor-based low-impedance busbar protection relays utilize sophisticated algorithms to detect faults in the bus bar schemes. The system can be configured as de-centralized busbar protection system and centralized busbar protection system. By geography, Asia Pacific is going to have a lucrative growth during the forecast period. The growth of the Asia Pacific busbar protection market can be attributed to the increasing investment in grid expansion projects from countries such as China, Japan, and India.
Some of the key players profiled in the Busbar Protection Market include ABB, Andritz, Basler Electric, Benchmarking, Eaton, Erlphase Power Technologies, GE, Mitsubishi Electric, NR Electric, Schneider Electric, SEL, Siemens, Toshiba and ZIV.
Types Covered:
• Centralized
• Decentralized
Conductors Covered:
• Aluminum
• Brass
• Copper
Impedances Covered:
• High Impedance
• Low Impedance
• Medium Impedance
Voltages Covered:
• Extra High Voltage
• High Voltage (Above 801 A)
• Low Voltage (Up to 125 A)
• Medium Voltage (126 A to 800 A)
Sales Channels Covered:
• Distributor
• Direct Sales
End Users Covered:
• Utilities
• Residential
• Transportations
• Industries
Regions Covered:
• North America
o US
o Canada
o Mexico
• Europe
o Germany
o UK
o Italy
o France
o Spain
o Rest of Europe
• Asia Pacific
o Japan
o China
o India
o Australia
o New Zealand
o South Korea
o Rest of Asia Pacific
• South America
o Argentina
o Brazil
o Chile
o Rest of South America
• Middle East & Africa
o Saudi Arabia
o UAE
o Qatar
o South Africa
o Rest of Middle East & Africa
What our report offers:
- Market share assessments for the regional and country-level segments
- Strategic recommendations for the new entrants
- Covers Market data for the years 2018, 2019, 2020, 2024 and 2027
- Market Trends (Drivers, Constraints, Opportunities, Threats, Challenges, Investment Opportunities, and recommendations)
- Strategic analysis: Drivers and Constraints, Product/Technology Analysis, Porter’s five forces analysis, SWOT analysis, etc.
- Strategic recommendations in key business segments based on the market estimations
- Competitive landscaping mapping the key common trends
- Company profiling with detailed strategies, financials, and recent developments
- Supply chain trends mapping the latest technological advancements
Free Customization Offerings:
All the customers of this report will be entitled to receive one of the following free customization options:
• Company Profiling
o Comprehensive profiling of additional market players (up to 3)
o SWOT Analysis of key players (up to 3)
• Regional Segmentation
o Market estimations, Forecasts and CAGR of any prominent country as per the client's interest (Note: Depends on feasibility check)
• Competitive Benchmarking
Benchmarking of key players based on product portfolio, geographical presence, and strategic alliances
Table of Contents
1 Executive Summary
2 Preface
2.1 Abstract
2.2 Stake Holders
2.3 Research Scope
2.4 Research Methodology
2.4.1 Data Mining
2.4.2 Data Analysis
2.4.3 Data Validation
2.4.4 Research Approach
2.5 Research Sources
2.5.1 Primary Research Sources
2.5.2 Secondary Research Sources
2.5.3 Assumptions
3 Market Trend Analysis
3.1 Introduction
3.2 Drivers
3.3 Restraints
3.4 Opportunities
3.5 Threats
3.6 End User Analysis
3.7 Emerging Markets
3.8 Impact of Covid-19
4 Porters Five Force Analysis
4.1 Bargaining power of suppliers
4.2 Bargaining power of buyers
4.3 Threat of substitutes
4.4 Threat of new entrants
4.5 Competitive rivalry
5 Global Busbar Protection Market, By Type
5.1 Introduction
5.2 Centralized
5.3 Decentralized
6 Global Busbar Protection Market, By Conductor
6.1 Introduction
6.2 Aluminum
6.3 Brass
6.4 Copper
7 Global Busbar Protection Market, By Impedance
7.1 Introduction
7.2 High Impedance
7.3 Low Impedance
7.4 Medium Impedance
8 Global Busbar Protection Market, By Voltage
8.1 Introduction
8.2 Extra High Voltage
8.3 High Voltage (Above 801 A)
8.4 Low Voltage (Up to 125 A)
8.5 Medium Voltage (126 A to 800 A)
9 Global Busbar Protection Market, By Sales Channel
9.1 Introduction
9.2 Distributor
9.3 Direct Sales
10 Global Busbar Protection Market, By End User
10.1 Introduction
10.2 Utilities
10.3 Residential
10.4 Transportations
10.4.1 Metros
10.4.2 Railways
10.5 Industries
10.5.1 Cement and Chemicals
10.5.2 Metal & Mining
10.5.3 Oil & Gas
11 Global Busbar Protection Market, By Geography
11.1 Introduction
11.2 North America
11.2.1 US
11.2.2 Canada
11.2.3 Mexico
11.3 Europe
11.3.1 Germany
11.3.2 UK
11.3.3 Italy
11.3.4 France
11.3.5 Spain
11.3.6 Rest of Europe
11.4 Asia Pacific
11.4.1 Japan
11.4.2 China
11.4.3 India
11.4.4 Australia
11.4.5 New Zealand
11.4.6 South Korea
11.4.7 Rest of Asia Pacific
11.5 South America
11.5.1 Argentina
11.5.2 Brazil
11.5.3 Chile
11.5.4 Rest of South America
11.6 Middle East & Africa
11.6.1 Saudi Arabia
11.6.2 UAE
11.6.3 Qatar
11.6.4 South Africa
11.6.5 Rest of Middle East & Africa
12 Key Developments
12.1 Agreements, Partnerships, Collaborations and Joint Ventures
12.2 Acquisitions & Mergers
12.3 New Product Launch
12.4 Expansions
12.5 Other Key Strategies
13 Company Profiling
13.1 ABB
13.2 Andritz
13.3 Basler Electric
13.4 Benchmarking
13.5 Eaton
13.6 Erlphase Power Technologies
13.7 GE
13.8 Mitsubishi Electric
13.9 NR Electric
13.10 Schneider Electric
13.11 SEL
13.12 Siemens
13.13 Toshiba
13.14 ZIV
List of Tables
1 Global Busbar Protection Market Outlook, By Region (2018-2027) ($MN)
2 Global Busbar Protection Market Outlook, By Type (2018-2027) ($MN)
3 Global Busbar Protection Market Outlook, By Centralized (2018-2027) ($MN)
4 Global Busbar Protection Market Outlook, By Decentralized (2018-2027) ($MN)
5 Global Busbar Protection Market Outlook, By Conductor (2018-2027) ($MN)
6 Global Busbar Protection Market Outlook, By Aluminum (2018-2027) ($MN)
7 Global Busbar Protection Market Outlook, By Brass (2018-2027) ($MN)
8 Global Busbar Protection Market Outlook, By Copper (2018-2027) ($MN)
9 Global Busbar Protection Market Outlook, By Impedance (2018-2027) ($MN)
10 Global Busbar Protection Market Outlook, By High Impedance (2018-2027) ($MN)
11 Global Busbar Protection Market Outlook, By Low Impedance (2018-2027) ($MN)
12 Global Busbar Protection Market Outlook, By Medium Impedance (2018-2027) ($MN)
13 Global Busbar Protection Market Outlook, By Voltage (2018-2027) ($MN)
14 Global Busbar Protection Market Outlook, By Extra High Voltage (2018-2027) ($MN)
15 Global Busbar Protection Market Outlook, By High Voltage (Above 801 A) (2018-2027) ($MN)
16 Global Busbar Protection Market Outlook, By Low Voltage (Up to 125 A) (2018-2027) ($MN)
17 Global Busbar Protection Market Outlook, By Medium Voltage (126 A to 800 A) (2018-2027) ($MN)
18 Global Busbar Protection Market Outlook, By Sales Channel (2018-2027) ($MN)
19 Global Busbar Protection Market Outlook, By Distributor (2018-2027) ($MN)
20 Global Busbar Protection Market Outlook, By Direct Sales (2018-2027) ($MN)
21 Global Busbar Protection Market Outlook, By End User (2018-2027) ($MN)
22 Global Busbar Protection Market Outlook, By Utilities (2018-2027) ($MN)
23 Global Busbar Protection Market Outlook, By Residential (2018-2027) ($MN)
24 Global Busbar Protection Market Outlook, By Transportations (2018-2027) ($MN)
25 Global Busbar Protection Market Outlook, By Metros (2018-2027) ($MN)
26 Global Busbar Protection Market Outlook, By Railways (2018-2027) ($MN)
27 Global Busbar Protection Market Outlook, By Industries (2018-2027) ($MN)
28 Global Busbar Protection Market Outlook, By Cement and Chemicals (2018-2027) ($MN)
29 Global Busbar Protection Market Outlook, By Metal & Mining (2018-2027) ($MN)
30 Global Busbar Protection Market Outlook, By Oil & Gas (2018-2027) ($MN)
31 North America Busbar Protection Market Outlook, By Country (2018-2027) ($MN)
32 North America Busbar Protection Market Outlook, By Type (2018-2027) ($MN)
33 North America Busbar Protection Market Outlook, By Centralized (2018-2027) ($MN)
34 North America Busbar Protection Market Outlook, By Decentralized (2018-2027) ($MN)
35 North America Busbar Protection Market Outlook, By Conductor (2018-2027) ($MN)
36 North America Busbar Protection Market Outlook, By Aluminum (2018-2027) ($MN)
37 North America Busbar Protection Market Outlook, By Brass (2018-2027) ($MN)
38 North America Busbar Protection Market Outlook, By Copper (2018-2027) ($MN)
39 North America Busbar Protection Market Outlook, By Impedance (2018-2027) ($MN)
40 North America Busbar Protection Market Outlook, By High Impedance (2018-2027) ($MN)
41 North America Busbar Protection Market Outlook, By Low Impedance (2018-2027) ($MN)
42 North America Busbar Protection Market Outlook, By Medium Impedance (2018-2027) ($MN)
43 North America Busbar Protection Market Outlook, By Voltage (2018-2027) ($MN)
44 North America Busbar Protection Market Outlook, By Extra High Voltage (2018-2027) ($MN)
45 North America Busbar Protection Market Outlook, By High Voltage (Above 801 A) (2018-2027) ($MN)
46 North America Busbar Protection Market Outlook, By Low Voltage (Up to 125 A) (2018-2027) ($MN)
47 North America Busbar Protection Market Outlook, By Medium Voltage (126 A to 800 A) (2018-2027) ($MN)
48 North America Busbar Protection Market Outlook, By Sales Channel (2018-2027) ($MN)
49 North America Busbar Protection Market Outlook, By Distributor (2018-2027) ($MN)
50 North America Busbar Protection Market Outlook, By Direct Sales (2018-2027) ($MN)
51 North America Busbar Protection Market Outlook, By End User (2018-2027) ($MN)
52 North America Busbar Protection Market Outlook, By Utilities (2018-2027) ($MN)
53 North America Busbar Protection Market Outlook, By Residential (2018-2027) ($MN)
54 North America Busbar Protection Market Outlook, By Transportations (2018-2027) ($MN)
55 North America Busbar Protection Market Outlook, By Metros (2018-2027) ($MN)
56 North America Busbar Protection Market Outlook, By Railways (2018-2027) ($MN)
57 North America Busbar Protection Market Outlook, By Industries (2018-2027) ($MN)
58 North America Busbar Protection Market Outlook, By Cement and Chemicals (2018-2027) ($MN)
59 North America Busbar Protection Market Outlook, By Metal & Mining (2018-2027) ($MN)
60 North America Busbar Protection Market Outlook, By Oil & Gas (2018-2027) ($MN)
61 Europe Busbar Protection Market Outlook, By Country (2018-2027) ($MN)
62 Europe Busbar Protection Market Outlook, By Type (2018-2027) ($MN)
63 Europe Busbar Protection Market Outlook, By Centralized (2018-2027) ($MN)
64 Europe Busbar Protection Market Outlook, By Decentralized (2018-2027) ($MN)
65 Europe Busbar Protection Market Outlook, By Conductor (2018-2027) ($MN)
66 Europe Busbar Protection Market Outlook, By Aluminum (2018-2027) ($MN)
67 Europe Busbar Protection Market Outlook, By Brass (2018-2027) ($MN)
68 Europe Busbar Protection Market Outlook, By Copper (2018-2027) ($MN)
69 Europe Busbar Protection Market Outlook, By Impedance (2018-2027) ($MN)
70 Europe Busbar Protection Market Outlook, By High Impedance (2018-2027) ($MN)
71 Europe Busbar Protection Market Outlook, By Low Impedance (2018-2027) ($MN)
72 Europe Busbar Protection Market Outlook, By Medium Impedance (2018-2027) ($MN)
73 Europe Busbar Protection Market Outlook, By Voltage (2018-2027) ($MN)
74 Europe Busbar Protection Market Outlook, By Extra High Voltage (2018-2027) ($MN)
75 Europe Busbar Protection Market Outlook, By High Voltage (Above 801 A) (2018-2027) ($MN)
76 Europe Busbar Protection Market Outlook, By Low Voltage (Up to 125 A) (2018-2027) ($MN)
77 Europe Busbar Protection Market Outlook, By Medium Voltage (126 A to 800 A) (2018-2027) ($MN)
78 Europe Busbar Protection Market Outlook, By Sales Channel (2018-2027) ($MN)
79 Europe Busbar Protection Market Outlook, By Distributor (2018-2027) ($MN)
80 Europe Busbar Protection Market Outlook, By Direct Sales (2018-2027) ($MN)
81 Europe Busbar Protection Market Outlook, By End User (2018-2027) ($MN)
82 Europe Busbar Protection Market Outlook, By Utilities (2018-2027) ($MN)
83 Europe Busbar Protection Market Outlook, By Residential (2018-2027) ($MN)
84 Europe Busbar Protection Market Outlook, By Transportations (2018-2027) ($MN)
85 Europe Busbar Protection Market Outlook, By Metros (2018-2027) ($MN)
86 Europe Busbar Protection Market Outlook, By Railways (2018-2027) ($MN)
87 Europe Busbar Protection Market Outlook, By Industries (2018-2027) ($MN)
88 Europe Busbar Protection Market Outlook, By Cement and Chemicals (2018-2027) ($MN)
89 Europe Busbar Protection Market Outlook, By Metal & Mining (2018-2027) ($MN)
90 Europe Busbar Protection Market Outlook, By Oil & Gas (2018-2027) ($MN)
91 Asia Pacific Busbar Protection Market Outlook, By Country (2018-2027) ($MN)
92 Asia Pacific Busbar Protection Market Outlook, By Type (2018-2027) ($MN)
93 Asia Pacific Busbar Protection Market Outlook, By Centralized (2018-2027) ($MN)
94 Asia Pacific Busbar Protection Market Outlook, By Decentralized (2018-2027) ($MN)
95 Asia Pacific Busbar Protection Market Outlook, By Conductor (2018-2027) ($MN)
96 Asia Pacific Busbar Protection Market Outlook, By Aluminum (2018-2027) ($MN)
97 Asia Pacific Busbar Protection Market Outlook, By Brass (2018-2027) ($MN)
98 Asia Pacific Busbar Protection Market Outlook, By Copper (2018-2027) ($MN)
99 Asia Pacific Busbar Protection Market Outlook, By Impedance (2018-2027) ($MN)
100 Asia Pacific Busbar Protection Market Outlook, By High Impedance (2018-2027) ($MN)
101 Asia Pacific Busbar Protection Market Outlook, By Low Impedance (2018-2027) ($MN)
102 Asia Pacific Busbar Protection Market Outlook, By Medium Impedance (2018-2027) ($MN)
103 Asia Pacific Busbar Protection Market Outlook, By Voltage (2018-2027) ($MN)
104 Asia Pacific Busbar Protection Market Outlook, By Extra High Voltage (2018-2027) ($MN)
105 Asia Pacific Busbar Protection Market Outlook, By High Voltage (Above 801 A) (2018-2027) ($MN)
106 Asia Pacific Busbar Protection Market Outlook, By Low Voltage (Up to 125 A) (2018-2027) ($MN)
107 Asia Pacific Busbar Protection Market Outlook, By Medium Voltage (126 A to 800 A) (2018-2027) ($MN)
108 Asia Pacific Busbar Protection Market Outlook, By Sales Channel (2018-2027) ($MN)
109 Asia Pacific Busbar Protection Market Outlook, By Distributor (2018-2027) ($MN)
110 Asia Pacific Busbar Protection Market Outlook, By Direct Sales (2018-2027) ($MN)
111 Asia Pacific Busbar Protection Market Outlook, By End User (2018-2027) ($MN)
112 Asia Pacific Busbar Protection Market Outlook, By Utilities (2018-2027) ($MN)
113 Asia Pacific Busbar Protection Market Outlook, By Residential (2018-2027) ($MN)
114 Asia Pacific Busbar Protection Market Outlook, By Transportations (2018-2027) ($MN)
115 Asia Pacific Busbar Protection Market Outlook, By Metros (2018-2027) ($MN)
116 Asia Pacific Busbar Protection Market Outlook, By Railways (2018-2027) ($MN)
117 Asia Pacific Busbar Protection Market Outlook, By Industries (2018-2027) ($MN)
118 Asia Pacific Busbar Protection Market Outlook, By Cement and Chemicals (2018-2027) ($MN)
119 Asia Pacific Busbar Protection Market Outlook, By Metal & Mining (2018-2027) ($MN)
120 Asia Pacific Busbar Protection Market Outlook, By Oil & Gas (2018-2027) ($MN)
121 South America Busbar Protection Market Outlook, By Country (2018-2027) ($MN)
122 South America Busbar Protection Market Outlook, By Type (2018-2027) ($MN)
123 South America Busbar Protection Market Outlook, By Centralized (2018-2027) ($MN)
124 South America Busbar Protection Market Outlook, By Decentralized (2018-2027) ($MN)
125 South America Busbar Protection Market Outlook, By Conductor (2018-2027) ($MN)
126 South America Busbar Protection Market Outlook, By Aluminum (2018-2027) ($MN)
127 South America Busbar Protection Market Outlook, By Brass (2018-2027) ($MN)
128 South America Busbar Protection Market Outlook, By Copper (2018-2027) ($MN)
129 South America Busbar Protection Market Outlook, By Impedance (2018-2027) ($MN)
130 South America Busbar Protection Market Outlook, By High Impedance (2018-2027) ($MN)
131 South America Busbar Protection Market Outlook, By Low Impedance (2018-2027) ($MN)
132 South America Busbar Protection Market Outlook, By Medium Impedance (2018-2027) ($MN)
133 South America Busbar Protection Market Outlook, By Voltage (2018-2027) ($MN)
134 South America Busbar Protection Market Outlook, By Extra High Voltage (2018-2027) ($MN)
135 South America Busbar Protection Market Outlook, By High Voltage (Above 801 A) (2018-2027) ($MN)
136 South America Busbar Protection Market Outlook, By Low Voltage (Up to 125 A) (2018-2027) ($MN)
137 South America Busbar Protection Market Outlook, By Medium Voltage (126 A to 800 A) (2018-2027) ($MN)
138 South America Busbar Protection Market Outlook, By Sales Channel (2018-2027) ($MN)
139 South America Busbar Protection Market Outlook, By Distributor (2018-2027) ($MN)
140 South America Busbar Protection Market Outlook, By Direct Sales (2018-2027) ($MN)
141 South America Busbar Protection Market Outlook, By End User (2018-2027) ($MN)
142 South America Busbar Protection Market Outlook, By Utilities (2018-2027) ($MN)
143 South America Busbar Protection Market Outlook, By Residential (2018-2027) ($MN)
144 South America Busbar Protection Market Outlook, By Transportations (2018-2027) ($MN)
145 South America Busbar Protection Market Outlook, By Metros (2018-2027) ($MN)
146 South America Busbar Protection Market Outlook, By Railways (2018-2027) ($MN)
147 South America Busbar Protection Market Outlook, By Industries (2018-2027) ($MN)
148 South America Busbar Protection Market Outlook, By Cement and Chemicals (2018-2027) ($MN)
149 South America Busbar Protection Market Outlook, By Metal & Mining (2018-2027) ($MN)
150 South America Busbar Protection Market Outlook, By Oil & Gas (2018-2027) ($MN)
151 Middle East & Africa Busbar Protection Market Outlook, By Country (2018-2027) ($MN)
152 Middle East & Africa Busbar Protection Market Outlook, By Type (2018-2027) ($MN)
153 Middle East & Africa Busbar Protection Market Outlook, By Centralized (2018-2027) ($MN)
154 Middle East & Africa Busbar Protection Market Outlook, By Decentralized (2018-2027) ($MN)
155 Middle East & Africa Busbar Protection Market Outlook, By Conductor (2018-2027) ($MN)
156 Middle East & Africa Busbar Protection Market Outlook, By Aluminum (2018-2027) ($MN)
157 Middle East & Africa Busbar Protection Market Outlook, By Brass (2018-2027) ($MN)
158 Middle East & Africa Busbar Protection Market Outlook, By Copper (2018-2027) ($MN)
159 Middle East & Africa Busbar Protection Market Outlook, By Impedance (2018-2027) ($MN)
160 Middle East & Africa Busbar Protection Market Outlook, By High Impedance (2018-2027) ($MN)
161 Middle East & Africa Busbar Protection Market Outlook, By Low Impedance (2018-2027) ($MN)
162 Middle East & Africa Busbar Protection Market Outlook, By Medium Impedance (2018-2027) ($MN)
163 Middle East & Africa Busbar Protection Market Outlook, By Voltage (2018-2027) ($MN)
164 Middle East & Africa Busbar Protection Market Outlook, By Extra High Voltage (2018-2027) ($MN)
165 Middle East & Africa Busbar Protection Market Outlook, By High Voltage (Above 801 A) (2018-2027) ($MN)
166 Middle East & Africa Busbar Protection Market Outlook, By Low Voltage (Up to 125 A) (2018-2027) ($MN)
167 Middle East & Africa Busbar Protection Market Outlook, By Medium Voltage (126 A to 800 A) (2018-2027) ($MN)
168 Middle East & Africa Busbar Protection Market Outlook, By Sales Channel (2018-2027) ($MN)
169 Middle East & Africa Busbar Protection Market Outlook, By Distributor (2018-2027) ($MN)
170 Middle East & Africa Busbar Protection Market Outlook, By Direct Sales (2018-2027) ($MN)
171 Middle East & Africa Busbar Protection Market Outlook, By End User (2018-2027) ($MN)
172 Middle East & Africa Busbar Protection Market Outlook, By Utilities (2018-2027) ($MN)
173 Middle East & Africa Busbar Protection Market Outlook, By Residential (2018-2027) ($MN)
174 Middle East & Africa Busbar Protection Market Outlook, By Transportations (2018-2027) ($MN)
175 Middle East & Africa Busbar Protection Market Outlook, By Metros (2018-2027) ($MN)
176 Middle East & Africa Busbar Protection Market Outlook, By Railways (2018-2027) ($MN)
177 Middle East & Africa Busbar Protection Market Outlook, By Industries (2018-2027) ($MN)
178 Middle East & Africa Busbar Protection Market Outlook, By Cement and Chemicals (2018-2027) ($MN)
179 Middle East & Africa Busbar Protection Market Outlook, By Metal & Mining (2018-2027) ($MN)
180 Middle East & Africa Busbar Protection Market Outlook, By Oil & Gas (2018-2027) ($MN)
List of Figures
RESEARCH METHODOLOGY

We at ‘Stratistics’ opt for an extensive research approach which involves data mining, data validation, and data analysis. The various research sources include in-house repository, secondary research, competitor’s sources, social media research, client internal data, and primary research.
Our team of analysts prefers the most reliable and authenticated data sources in order to perform the comprehensive literature search. With access to most of the authenticated data bases our team highly considers the best mix of information through various sources to obtain extensive and accurate analysis.
Each report takes an average time of a month and a team of 4 industry analysts. The time may vary depending on the scope and data availability of the desired market report. The various parameters used in the market assessment are standardized in order to enhance the data accuracy.
Data Mining
The data is collected from several authenticated, reliable, paid and unpaid sources and is filtered depending on the scope & objective of the research. Our reports repository acts as an added advantage in this procedure. Data gathering from the raw material suppliers, distributors and the manufacturers is performed on a regular basis, this helps in the comprehensive understanding of the products value chain. Apart from the above mentioned sources the data is also collected from the industry consultants to ensure the objective of the study is in the right direction.
Market trends such as technological advancements, regulatory affairs, market dynamics (Drivers, Restraints, Opportunities and Challenges) are obtained from scientific journals, market related national & international associations and organizations.
Data Analysis
From the data that is collected depending on the scope & objective of the research the data is subjected for the analysis. The critical steps that we follow for the data analysis include:
- Product Lifecycle Analysis
- Competitor analysis
- Risk analysis
- Porters Analysis
- PESTEL Analysis
- SWOT Analysis
The data engineering is performed by the core industry experts considering both the Marketing Mix Modeling and the Demand Forecasting. The marketing mix modeling makes use of multiple-regression techniques to predict the optimal mix of marketing variables. Regression factor is based on a number of variables and how they relate to an outcome such as sales or profits.
Data Validation
The data validation is performed by the exhaustive primary research from the expert interviews. This includes telephonic interviews, focus groups, face to face interviews, and questionnaires to validate our research from all aspects. The industry experts we approach come from the leading firms, involved in the supply chain ranging from the suppliers, distributors to the manufacturers and consumers so as to ensure an unbiased analysis.
We are in touch with more than 15,000 industry experts with the right mix of consultants, CEO's, presidents, vice presidents, managers, experts from both supply side and demand side, executives and so on.
The data validation involves the primary research from the industry experts belonging to:
- Leading Companies
- Suppliers & Distributors
- Manufacturers
- Consumers
- Industry/Strategic Consultants
Apart from the data validation the primary research also helps in performing the fill gap research, i.e. providing solutions for the unmet needs of the research which helps in enhancing the reports quality.
For more details about research methodology, kindly write to us at info@strategymrc.com
Frequently Asked Questions
In case of any queries regarding this report, you can contact the customer service by filing the “Inquiry Before Buy” form available on the right hand side. You may also contact us through email: info@strategymrc.com or phone: +1-301-202-5929
Yes, the samples are available for all the published reports. You can request them by filling the “Request Sample” option available in this page.
Yes, you can request a sample with your specific requirements. All the customized samples will be provided as per the requirement with the real data masked.
All our reports are available in Digital PDF format. In case if you require them in any other formats, such as PPT, Excel etc you can submit a request through “Inquiry Before Buy” form available on the right hand side. You may also contact us through email: info@strategymrc.com or phone: +1-301-202-5929
We offer a free 15% customization with every purchase. This requirement can be fulfilled for both pre and post sale. You may send your customization requirements through email at info@strategymrc.com or call us on +1-301-202-5929.
We have 3 different licensing options available in electronic format.
- Single User Licence: Allows one person, typically the buyer, to have access to the ordered product. The ordered product cannot be distributed to anyone else.
- 2-5 User Licence: Allows the ordered product to be shared among a maximum of 5 people within your organisation.
- Corporate License: Allows the product to be shared among all employees of your organisation regardless of their geographical location.
All our reports are typically be emailed to you as an attachment.
To order any available report you need to register on our website. The payment can be made either through CCAvenue or PayPal payments gateways which accept all international cards.
We extend our support to 6 months post sale. A post sale customization is also provided to cover your unmet needs in the report.
Request Customization
We offer complimentary customization of up to 15% with every purchase. To share your customization requirements, feel free to email us at info@strategymrc.com or call us on +1-301-202-5929. .
Please Note: Customization within the 15% threshold is entirely free of charge. If your request exceeds this limit, we will conduct a feasibility assessment. Following that, a detailed quote and timeline will be provided.
WHY CHOOSE US ?

Assured Quality
Best in class reports with high standard of research integrity

24X7 Research Support
Continuous support to ensure the best customer experience.

Free Customization
Adding more values to your product of interest.

Safe & Secure Access
Providing a secured environment for all online transactions.

Trusted by 600+ Brands
Serving the most reputed brands across the world.