
Ccus Materials Market
CCUS Materials Market Forecasts to 2034 - Global Analysis By Material Type (Absorbents, Adsorbents, Membranes, Catalysts, Sorbents, and Metal-Organic Frameworks (MOFs)), Source of CO-, Service Model, Technology, Application, End User, and By Geography

|
Years Covered |
2023-2034 |
|
Estimated Year Value (2026) |
US $4.8 BN |
|
Projected Year Value (2034) |
US $7.6 BN |
|
CAGR (2026 - 2034) |
5.9% |
|
Regions Covered |
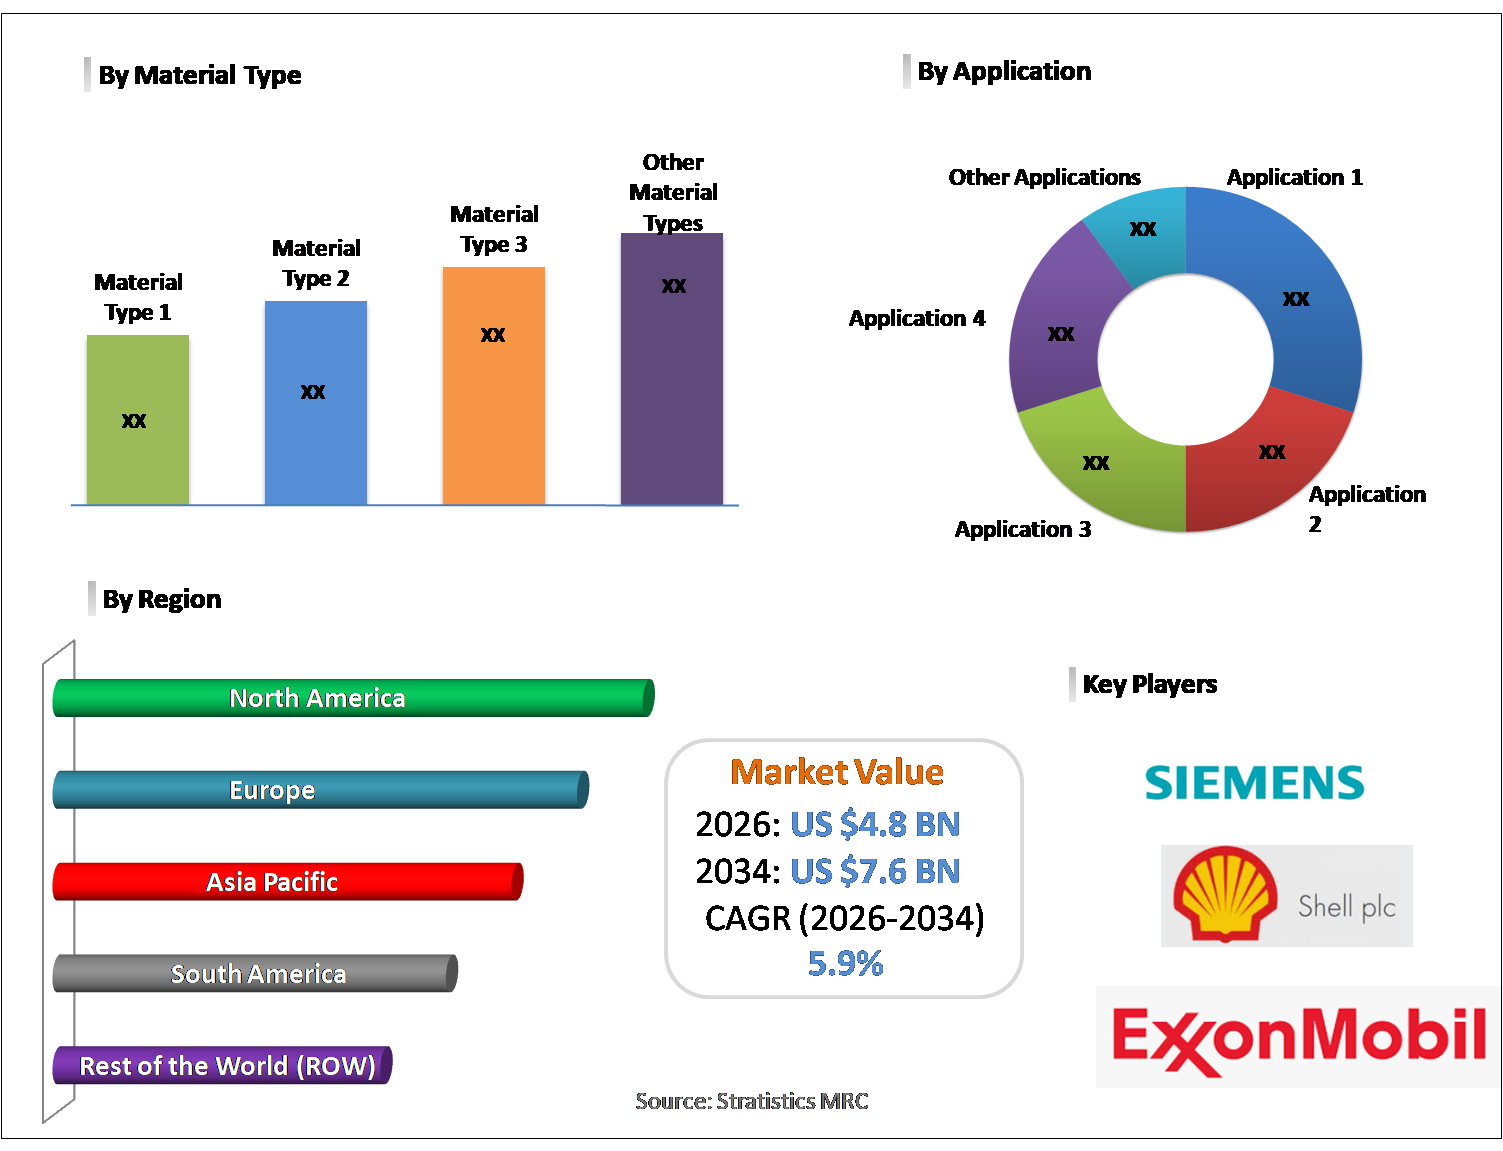
North America, Europe, Asia Pacific, South America, and Rest of the World (RoW) |
|
Countries Covered |
United States, Canada, Mexico, United Kingdom, Germany, France, Italy, Spain, Netherlands, Belgium, Sweden, Switzerland, Poland, Rest of Europe, China, Japan, India, South Korea, Australia, Indonesia, Thailand, Malaysia, Singapore, Vietnam, Rest of Asia Pacific, Brazil, Argentina, Colombia, Chile, Peru, Rest of South America, Saudi Arabia, United Arab Emirates, Qatar, Israel, Rest of Middle East, South Africa, Egypt, Morocco, and Rest of Africa. |
|
Largest Market |
North America |
|
Highest Growing Market |
Asia Pacific |
According to Stratistics MRC, the Global CCUS Materials Market is accounted for $4.8 billion in 2026 and is expected to reach $7.6 billion by 2034 growing at a CAGR of 5.9% during the forecast period. CCUS materials are specialized substances including absorbents, adsorbents, membranes, catalysts, and sorbents used in carbon capture, utilization, and storage processes to separate and process carbon dioxide from industrial emissions. These materials form the functional core of carbon capture systems, enabling efficient CO2 separation from flue gases produced by power plants, cement factories, and other heavy industrial sources. Advanced CCUS materials such as metal-organic frameworks and amine-based solvents are driving improvements in capture efficiency, energy consumption reduction, and overall system economics.
Market Dynamics:
Driver:
Government mandates for carbon emission reduction
Governments across major economies including the European Union, United States, and China have established legally binding net-zero emission commitments that require carbon capture, utilization, and storage as a critical tool for decarbonizing industrial sectors. Mandatory carbon pricing mechanisms, emissions trading systems, and carbon border adjustment policies create direct financial incentives for heavy industry to deploy carbon capture technology, generating substantial and growing demand for the specialized absorbents, membranes, and catalysts that form the functional core.
Restraint:
High capital investment requirements for projects
Construction and operation of commercial-scale carbon capture facilities requires enormous capital investment, including specialized material procurement, engineering of capture systems, development of CO2 compression and transport infrastructure, and establishment of geological storage sites. These costs remain prohibitive for many industrial operators, especially in sectors with tight margins such as cement and steel. Without sustained government subsidies or carbon pricing at levels sufficient to make capture projects financially attractive, the high capital barrier continues to slow.
Opportunity:
Expanding industrial decarbonization commitments globally
Industrial sectors including steel, cement, chemicals, and power generation face mounting decarbonization pressure from regulators, investors, and customers but lack readily available alternatives to combustion-based processes. For these hard-to-abate industries, CCUS represents the most commercially viable near-term pathway to reducing emissions without restructuring production. Growing corporate net-zero commitments and expanding government funding for industrial CCUS demonstration projects are creating a broad and deepening market for advanced capture materials across diverse industrial applications globally.
Threat:
High energy penalty of current capture technologies
The dominant post-combustion carbon capture technologies based on amine solvent absorption impose a significant energy penalty on facilities where deployed, typically reducing net energy output by a meaningful percentage. This energy cost increases operational expenses and reduces the overall climate benefit by requiring additional fuel consumption to run the capture process. The challenge of developing next-generation capture materials that deliver high selectivity and capacity at substantially lower regeneration energy requirements remains a critical technical barrier.
Covid-19 Impact:
The CCUS Materials Market experienced strategic momentum during the COVID-19 period as governments and industries reinforced long-term decarbonization commitments. Spurred by green recovery initiatives and sustainability-focused stimulus packages, investments in carbon capture infrastructure accelerated. Fueled by heightened emphasis on industrial emission control and climate resilience, research activities surrounding advanced absorbents, membranes, and catalytic materials expanded. Additionally, collaborations between energy producers and technology developers strengthened commercialization pathways, reinforcing steady market advancement in the post-pandemic landscape.
The absorbents segment is expected to be the largest during the forecast period
The absorbents segment is expected to account for the largest market share during the forecast period, due to its high carbon capture efficiency and broad applicability across industrial facilities and power generation plants. Propelled by continuous innovation in solid sorbents, amine-based solutions, and metal-organic frameworks, absorbent materials demonstrate superior CO₂ selectivity and regeneration performance. Furthermore, scalability, cost optimization advancements, and compatibility with existing capture systems strengthen their dominant adoption across large-scale CCUS installations.
The point source segment is expected to have the highest CAGR during the forecast period
Over the forecast period, the point source segment is predicted to witness the highest growth rate, driven by increasing implementation of carbon capture technologies at concentrated emission sites such as cement plants, refineries, and thermal power stations. Spurred by stringent emission reduction targets and industrial decarbonization mandates, point source capture solutions enable measurable and immediate carbon mitigation. Additionally, integration with enhanced oil recovery and industrial utilization pathways is accelerating deployment across high-emission sectors.
Region with largest share:
During the forecast period, the North America region is expected to hold the largest market share, owing to substantial federal funding, tax incentives, and established CCUS infrastructure. Propelled by advanced research ecosystems and strong collaboration between energy companies and technology providers, the region demonstrates early commercialization of innovative capture materials. Moreover, supportive regulatory frameworks and active carbon storage projects reinforce North America’s leadership in CCUS materials deployment.
Region with highest CAGR:
Over the forecast period, the Asia Pacific region is anticipated to exhibit the highest CAGR, due to expanding industrial output and rising commitment toward carbon neutrality targets. Spurred by government-backed decarbonization programs and increasing investments in low-carbon technologies, industries across China, Japan, South Korea, and India are actively adopting CCUS solutions. Furthermore, growing public-private partnerships and infrastructure expansion are accelerating material innovation and large-scale project implementation across the region.

Key players in the market
Some of the key players in CCUS Materials Market include Exxon Mobil Corporation, Shell plc, BP plc, TotalEnergies SE, Chevron Corporation, Schlumberger Limited, Baker Hughes Company, Honeywell International Inc., Linde plc, Air Liquide, Mitsubishi Heavy Industries, Ltd., Siemens Energy AG, Aker Solutions ASA, Halliburton Company, BASF SE and Dow Inc.
Key Developments:
In February 2026, TotalEnergies outlined 2026 objectives, emphasizing relentless emissions reduction. The company reinforced CCUS deployment, focusing on materials innovation and partnerships to strengthen resilience and accelerate carbon management across industrial and power sectors.
In January 2026, Shell published its Energy Security Scenarios, highlighting CCUS as critical for balancing energy security and decarbonization. The company reinforced investment in carbon management technologies, including capture materials, to support global climate goals.
In December 2025, ExxonMobil updated its 2030 plan, accelerating emissions‑intensity targets to 2026. The company emphasized CCUS materials innovation, leveraging advantaged assets and cost savings to strengthen competitiveness in carbon capture and storage projects.
Material Types Covered:
• Absorbents
• Adsorbents
• Membranes
• Catalysts
• Sorbents
• Metal-Organic Frameworks (MOFs)
Source of CO2 Covered:
• Point Source
• Ambient Air
Service Models Covered:
• Capture-as-a-Service
• Technology Licensing
• Engineering, Procurement & Construction (EPC)
Technologies Covered:
• Pre-Combustion Capture
• Post-Combustion Capture
• Oxy-Fuel Combustion
• Direct Air Capture
Applications Covered:
• Power Generation
• Oil & Gas
• Chemical Processing
• Cement
• Steel
End Users Covered:
• Energy Companies
• Industrial Manufacturers
• Oilfield Service Providers
• Government Projects
Regions Covered:
• North America
o United States
o Canada
o Mexico
• Europe
o United Kingdom
o Germany
o France
o Italy
o Spain
o Netherlands
o Belgium
o Sweden
o Switzerland
o Poland
o Rest of Europe
• Asia Pacific
o China
o Japan
o India
o South Korea
o Australia
o Indonesia
o Thailand
o Malaysia
o Singapore
o Vietnam
o Rest of Asia Pacific
• South America
o Brazil
o Argentina
o Colombia
o Chile
o Peru
o Rest of South America
• Rest of the World (RoW)
o Middle East
§ Saudi Arabia
§ United Arab Emirates
§ Qatar
§ Israel
§ Rest of Middle East
o Africa
§ South Africa
§ Egypt
§ Morocco
§ Rest of Africa
What our report offers:
- Market share assessments for the regional and country-level segments
- Strategic recommendations for the new entrants
- Covers Market data for the years 2023, 2024, 2025, 2026, 2027, 2028, 2030, 2032 and 2034
- Market Trends (Drivers, Constraints, Opportunities, Threats, Challenges, Investment Opportunities, and recommendations)
- Strategic recommendations in key business segments based on the market estimations
- Competitive landscaping mapping the key common trends
- Company profiling with detailed strategies, financials, and recent developments
- Supply chain trends mapping the latest technological advancements
Free Customization Offerings:
All the customers of this report will be entitled to receive one of the following free customization options:
• Company Profiling
o Comprehensive profiling of additional market players (up to 3)
o SWOT Analysis of key players (up to 3)
• Regional Segmentation
o Market estimations, Forecasts and CAGR of any prominent country as per the client's interest (Note: Depends on feasibility check)
• Competitive Benchmarking
o Benchmarking of key players based on product portfolio, geographical presence, and strategic alliances
Table of Contents
1 Executive Summary
1.1 Market Snapshot and Key Highlights
1.2 Growth Drivers, Challenges, and Opportunities
1.3 Competitive Landscape Overview
1.4 Strategic Insights and Recommendations
2 Research Framework
2.1 Study Objectives and Scope
2.2 Stakeholder Analysis
2.3 Research Assumptions and Limitations
2.4 Research Methodology
2.4.1 Data Collection (Primary and Secondary)
2.4.2 Data Modeling and Estimation Techniques
2.4.3 Data Validation and Triangulation
2.4.4 Analytical and Forecasting Approach
3 Market Dynamics and Trend Analysis
3.1 Market Definition and Structure
3.2 Key Market Drivers
3.3 Market Restraints and Challenges
3.4 Growth Opportunities and Investment Hotspots
3.5 Industry Threats and Risk Assessment
3.6 Technology and Innovation Landscape
3.7 Emerging and High-Growth Markets
3.8 Regulatory and Policy Environment
3.9 Impact of COVID-19 and Recovery Outlook
4 Competitive and Strategic Assessment
4.1 Porter's Five Forces Analysis
4.1.1 Supplier Bargaining Power
4.1.2 Buyer Bargaining Power
4.1.3 Threat of Substitutes
4.1.4 Threat of New Entrants
4.1.5 Competitive Rivalry
4.2 Market Share Analysis of Key Players
4.3 Product Benchmarking and Performance Comparison
5 Global CCUS Materials Market, By Material Type
5.1 Absorbents
5.2 Adsorbents
5.3 Membranes
5.4 Catalysts
5.5 Sorbents
5.6 Metal-Organic Frameworks (MOFs)
6 Global CCUS Materials Market, By Source of CO₂
6.1 Point Source
6.2 Ambient Air
7 Global CCUS Materials Market, By Service Model
7.1 Capture-as-a-Service
7.2 Technology Licensing
7.3 Engineering, Procurement & Construction (EPC)
8 Global CCUS Materials Market, By Technology
8.1 Pre-Combustion Capture
8.2 Post-Combustion Capture
8.3 Oxy-Fuel Combustion
8.4 Direct Air Capture
9 Global CCUS Materials Market, By Application
9.1 Power Generation
9.2 Oil & Gas
9.3 Chemical Processing
9.4 Cement
9.5 Steel
10 Global CCUS Materials Market, By End User
10.1 Energy Companies
10.2 Industrial Manufacturers
10.3 Oilfield Service Providers
10.4 Government Projects
11 Global CCUS Materials Market, By Geography
11.1 North America
11.1.1 United States
11.1.2 Canada
11.1.3 Mexico
11.2 Europe
11.2.1 United Kingdom
11.2.2 Germany
11.2.3 France
11.2.4 Italy
11.2.5 Spain
11.2.6 Netherlands
11.2.7 Belgium
11.2.8 Sweden
11.2.9 Switzerland
11.2.10 Poland
11.2.11 Rest of Europe
11.3 Asia Pacific
11.3.1 China
11.3.2 Japan
11.3.3 India
11.3.4 South Korea
11.3.5 Australia
11.3.6 Indonesia
11.3.7 Thailand
11.3.8 Malaysia
11.3.9 Singapore
11.3.10 Vietnam
11.3.11 Rest of Asia Pacific
11.4 South America
11.4.1 Brazil
11.4.2 Argentina
11.4.3 Colombia
11.4.4 Chile
11.4.5 Peru
11.4.6 Rest of South America
11.5 Rest of the World (RoW)
11.5.1 Middle East
11.5.1.1 Saudi Arabia
11.5.1.2 United Arab Emirates
11.5.1.3 Qatar
11.5.1.4 Israel
11.5.1.5 Rest of Middle East
11.5.2 Africa
11.5.2.1 South Africa
11.5.2.2 Egypt
11.5.2.3 Morocco
11.5.2.4 Rest of Africa
12 Strategic Market Intelligence
12.1 Industry Value Network and Supply Chain Assessment
12.2 White-Space and Opportunity Mapping
12.3 Product Evolution and Market Life Cycle Analysis
12.4 Channel, Distributor, and Go-to-Market Assessment
13 Industry Developments and Strategic Initiatives
13.1 Mergers and Acquisitions
13.2 Partnerships, Alliances, and Joint Ventures
13.3 New Product Launches and Certifications
13.4 Capacity Expansion and Investments
13.5 Other Strategic Initiatives
14 Company Profiles
14.1 Exxon Mobil Corporation
14.2 Shell plc
14.3 BP plc
14.4 TotalEnergies SE
14.5 Chevron Corporation
14.6 Schlumberger Limited
14.7 Baker Hughes Company
14.8 Honeywell International Inc.
14.9 Linde plc
14.10 Air Liquide
14.11 Mitsubishi Heavy Industries, Ltd.
14.12 Siemens Energy AG
14.13 Aker Solutions ASA
14.14 Halliburton Company
14.15 BASF SE
14.16 Dow Inc.
14.17 Carbon Clean Solutions Ltd.
14.18 Climeworks AG
List of Tables
1 Global CCUS Materials Market Outlook, By Region (2023-2034) ($MN)
2 Global CCUS Materials Market Outlook, By Material Type (2023-2034) ($MN)
3 Global CCUS Materials Market Outlook, By Absorbents (2023-2034) ($MN)
4 Global CCUS Materials Market Outlook, By Adsorbents (2023-2034) ($MN)
5 Global CCUS Materials Market Outlook, By Membranes (2023-2034) ($MN)
6 Global CCUS Materials Market Outlook, By Catalysts (2023-2034) ($MN)
7 Global CCUS Materials Market Outlook, By Sorbents (2023-2034) ($MN)
8 Global CCUS Materials Market Outlook, By Metal-Organic Frameworks (MOFs) (2023-2034) ($MN)
9 Global CCUS Materials Market Outlook, By Source of CO₂ (2023-2034) ($MN)
10 Global CCUS Materials Market Outlook, By Point Source (2023-2034) ($MN)
11 Global CCUS Materials Market Outlook, By Ambient Air (2023-2034) ($MN)
12 Global CCUS Materials Market Outlook, By Service Model (2023-2034) ($MN)
13 Global CCUS Materials Market Outlook, By Capture-as-a-Service (2023-2034) ($MN)
14 Global CCUS Materials Market Outlook, By Technology Licensing (2023-2034) ($MN)
15 Global CCUS Materials Market Outlook, By Engineering, Procurement & Construction (EPC) (2023-2034) ($MN)
16 Global CCUS Materials Market Outlook, By Technology (2023-2034) ($MN)
17 Global CCUS Materials Market Outlook, By Pre-Combustion Capture (2023-2034) ($MN)
18 Global CCUS Materials Market Outlook, By Post-Combustion Capture (2023-2034) ($MN)
19 Global CCUS Materials Market Outlook, By Oxy-Fuel Combustion (2023-2034) ($MN)
20 Global CCUS Materials Market Outlook, By Direct Air Capture (2023-2034) ($MN)
21 Global CCUS Materials Market Outlook, By Application (2023-2034) ($MN)
22 Global CCUS Materials Market Outlook, By Power Generation (2023-2034) ($MN)
23 Global CCUS Materials Market Outlook, By Oil & Gas (2023-2034) ($MN)
24 Global CCUS Materials Market Outlook, By Chemical Processing (2023-2034) ($MN)
25 Global CCUS Materials Market Outlook, By Cement (2023-2034) ($MN)
26 Global CCUS Materials Market Outlook, By Steel (2023-2034) ($MN)
27 Global CCUS Materials Market Outlook, By End User (2023-2034) ($MN)
28 Global CCUS Materials Market Outlook, By Energy Companies (2023-2034) ($MN)
29 Global CCUS Materials Market Outlook, By Industrial Manufacturers (2023-2034) ($MN)
30 Global CCUS Materials Market Outlook, By Oilfield Service Providers (2023-2034) ($MN)
31 Global CCUS Materials Market Outlook, By Government Projects (2023-2034) ($MN)
Note: Tables for North America, Europe, APAC, South America, and Rest of the World (RoW) Regions are also represented in the same manner as above.
List of Figures
RESEARCH METHODOLOGY

We at ‘Stratistics’ opt for an extensive research approach which involves data mining, data validation, and data analysis. The various research sources include in-house repository, secondary research, competitor’s sources, social media research, client internal data, and primary research.
Our team of analysts prefers the most reliable and authenticated data sources in order to perform the comprehensive literature search. With access to most of the authenticated data bases our team highly considers the best mix of information through various sources to obtain extensive and accurate analysis.
Each report takes an average time of a month and a team of 4 industry analysts. The time may vary depending on the scope and data availability of the desired market report. The various parameters used in the market assessment are standardized in order to enhance the data accuracy.
Data Mining
The data is collected from several authenticated, reliable, paid and unpaid sources and is filtered depending on the scope & objective of the research. Our reports repository acts as an added advantage in this procedure. Data gathering from the raw material suppliers, distributors and the manufacturers is performed on a regular basis, this helps in the comprehensive understanding of the products value chain. Apart from the above mentioned sources the data is also collected from the industry consultants to ensure the objective of the study is in the right direction.
Market trends such as technological advancements, regulatory affairs, market dynamics (Drivers, Restraints, Opportunities and Challenges) are obtained from scientific journals, market related national & international associations and organizations.
Data Analysis
From the data that is collected depending on the scope & objective of the research the data is subjected for the analysis. The critical steps that we follow for the data analysis include:
- Product Lifecycle Analysis
- Competitor analysis
- Risk analysis
- Porters Analysis
- PESTEL Analysis
- SWOT Analysis
The data engineering is performed by the core industry experts considering both the Marketing Mix Modeling and the Demand Forecasting. The marketing mix modeling makes use of multiple-regression techniques to predict the optimal mix of marketing variables. Regression factor is based on a number of variables and how they relate to an outcome such as sales or profits.
Data Validation
The data validation is performed by the exhaustive primary research from the expert interviews. This includes telephonic interviews, focus groups, face to face interviews, and questionnaires to validate our research from all aspects. The industry experts we approach come from the leading firms, involved in the supply chain ranging from the suppliers, distributors to the manufacturers and consumers so as to ensure an unbiased analysis.
We are in touch with more than 15,000 industry experts with the right mix of consultants, CEO's, presidents, vice presidents, managers, experts from both supply side and demand side, executives and so on.
The data validation involves the primary research from the industry experts belonging to:
- Leading Companies
- Suppliers & Distributors
- Manufacturers
- Consumers
- Industry/Strategic Consultants
Apart from the data validation the primary research also helps in performing the fill gap research, i.e. providing solutions for the unmet needs of the research which helps in enhancing the reports quality.
For more details about research methodology, kindly write to us at info@strategymrc.com
Frequently Asked Questions
In case of any queries regarding this report, you can contact the customer service by filing the “Inquiry Before Buy” form available on the right hand side. You may also contact us through email: info@strategymrc.com or phone: +1-301-202-5929
Yes, the samples are available for all the published reports. You can request them by filling the “Request Sample” option available in this page.
Yes, you can request a sample with your specific requirements. All the customized samples will be provided as per the requirement with the real data masked.
All our reports are available in Digital PDF format. In case if you require them in any other formats, such as PPT, Excel etc you can submit a request through “Inquiry Before Buy” form available on the right hand side. You may also contact us through email: info@strategymrc.com or phone: +1-301-202-5929
We offer a free 15% customization with every purchase. This requirement can be fulfilled for both pre and post sale. You may send your customization requirements through email at info@strategymrc.com or call us on +1-301-202-5929.
We have 3 different licensing options available in electronic format.
- Single User Licence: Allows one person, typically the buyer, to have access to the ordered product. The ordered product cannot be distributed to anyone else.
- 2-5 User Licence: Allows the ordered product to be shared among a maximum of 5 people within your organisation.
- Corporate License: Allows the product to be shared among all employees of your organisation regardless of their geographical location.
All our reports are typically be emailed to you as an attachment.
To order any available report you need to register on our website. The payment can be made either through CCAvenue or PayPal payments gateways which accept all international cards.
We extend our support to 6 months post sale. A post sale customization is also provided to cover your unmet needs in the report.
Request Customization
We offer complimentary customization of up to 15% with every purchase. To share your customization requirements, feel free to email us at info@strategymrc.com or call us on +1-301-202-5929. .
Please Note: Customization within the 15% threshold is entirely free of charge. If your request exceeds this limit, we will conduct a feasibility assessment. Following that, a detailed quote and timeline will be provided.
WHY CHOOSE US ?

Assured Quality
Best in class reports with high standard of research integrity

24X7 Research Support
Continuous support to ensure the best customer experience.

Free Customization
Adding more values to your product of interest.

Safe & Secure Access
Providing a secured environment for all online transactions.

Trusted by 600+ Brands
Serving the most reputed brands across the world.