
Chemical Fertilizers Market
Chemical Fertilizers Market Forecasts to 2032 – Global Analysis By Fertilizer Type (Nitrogenous Fertilizers, Phosphate Fertilizers, Potash Fertilizers and Compound Fertilizers), Crop Type, Form, Distribution Channel, Application and By Geography

According to Stratistics MRC, the Global Chemical Fertilizers Market is accounted for $220.08 billion in 2025 and is expected to reach $365.13 billion by 2032 growing at a CAGR of 7.5% during the forecast period. Chemical fertilizers are man-made products designed to provide vital nutrients such as nitrogen, phosphorus, and potassium to plants, promoting rapid and vigorous growth. In modern farming, they are highly valued for their ability to enrich soil instantly and enhance crop production significantly. Compared to organic fertilizers, they are more efficient, require less effort, and show quicker results. Yet, their overuse can damage soil health, lower long-term fertility, and pollute water sources. They may also disrupt soil microorganisms and upset environmental stability. Thus, chemical fertilizers are crucial for ensuring sufficient food supply, but their application should be controlled and combined with eco-friendly methods.
According to the International Fertilizer Association (IFA), Global fertilizer demand is projected to reach 200 million tonnes of nutrients by 2026, driven by population growth, dietary shifts, and the need to improve agricultural productivity.
Market Dynamics:
Driver:
Rising global food demand
One of the strongest factors fueling the chemical fertilizers market is the surge in worldwide food requirements caused by population expansion. With more people to feed, farmers are under pressure to achieve higher production levels and guarantee food supply. Chemical fertilizers play a vital role here, offering critical nutrients that speed up plant growth and increase harvest volumes. Because cultivable land is shrinking due to urbanization, the use of fertilizers helps maximize yield from limited farmland. Their quick action and efficiency make them indispensable in modern farming. Therefore, growing global food needs directly contribute to the rising demand for chemical fertilizers.
Restraint:
Rising costs and dependency
Increased reliance on chemical fertilizers is limiting the market’s long-term prospects. Prolonged use depletes natural soil fertility, compelling farmers to apply higher amounts to sustain crop output. This dependency drives up production costs, posing challenges for small-scale farmers with limited resources. Additionally, volatility in raw material prices, especially natural gas, makes fertilizers more expensive and less accessible. Such rising costs create affordability issues in many developing nations, reducing overall demand. Farmers are gradually turning toward cost-effective and sustainable alternatives to ease the financial load. Consequently, the combination of rising expenses and dependency acts as a strong restraint for market expansion.
Opportunity:
Technological innovations in fertilizers
Innovation in fertilizer technology is creating strong opportunities for the chemical fertilizers market. The introduction of slow-release, water-soluble, and bio-fortified fertilizers enables better nutrient absorption and reduces losses. These advanced products appeal to farmers seeking efficiency and sustainability. When paired with precision farming practices, they maximize crop yields while minimizing environmental impacts. Global companies that prioritize research and eco-friendly innovations are well-positioned to capture greater market share. Such advancements not only enhance farm productivity but also address growing sustainability concerns. Therefore, technological improvements in fertilizer design open significant opportunities for long-term growth and profitability across global agricultural markets.
Threat:
Competition from organic alternatives
Rising interest in organic farming presents a growing threat to the chemical fertilizers industry. With consumers demanding cleaner and safer food, organic produce has gained global momentum. This trend decreases reliance on chemical inputs, since organic cultivation primarily uses compost, manures, and biofertilizers. Additionally, many governments actively promote organic farming with incentives, certifications, and awareness programs, making it an appealing option for farmers. The emphasis on sustainability and health-conscious diets further accelerates this shift. As a result, chemical fertilizers face stiff competition from natural alternatives, forcing the industry to adapt through innovation or risk losing relevance in an evolving agricultural landscape.
Covid-19 Impact:
Covid-19 strongly influenced the chemical fertilizers market, leading to disruptions as well as new realizations about agriculture’s importance. Global lockdowns interrupted supply chains, delaying fertilizer manufacturing and delivery. Many farmers struggled to secure adequate supplies, which impacted crop production cycles. Increased fuel costs and shortages of raw materials further drove up fertilizer prices, creating affordability issues in low-income regions. Despite these obstacles, the crisis emphasized the role of fertilizers in maintaining food security. As a result, governments prioritized agricultural inputs during the pandemic. Although market growth slowed in the short term, the essential demand for fertilizers supported recovery in the post-Covid era.
The nitrogenous fertilizers segment is expected to be the largest during the forecast period
The nitrogenous fertilizers segment is expected to account for the largest market share during the forecast period, as they are fundamental to agricultural productivity. Nitrogen is vital for plant development because it enhances chlorophyll production, facilitates photosynthesis, and aids in protein building. High-demand crops like wheat, maize, and rice depend heavily on nitrogen inputs, driving widespread use of urea, ammonium nitrate, and other nitrogen-based products. Farmers prefer these fertilizers for their immediate effectiveness and ability to boost yields quickly. Increasing food requirements and decreasing arable land further amplify their importance. Consequently, nitrogenous fertilizers remain the most dominant segment, maintaining leadership in the global chemical fertilizers market.
The fruits and vegetables segment is expected to have the highest CAGR during the forecast period
Over the forecast period, the fruits and vegetables segment is predicted to witness the highest growth rate. Increasing health awareness and the popularity of plant-rich diets are driving higher global consumption of fresh produce. These crops demand careful nutrient management, making fertilizers essential for improving productivity, flavor, and shelf stability. Rising incomes and rapid urbanization are also boosting demand, alongside growth in international trade of horticultural products. To meet these needs, farmers rely on advanced fertilizers tailored for fruit and vegetable cultivation. As consumer preferences continue to diversify, this segment is set to expand rapidly, surpassing others in growth rate.
Region with largest share:
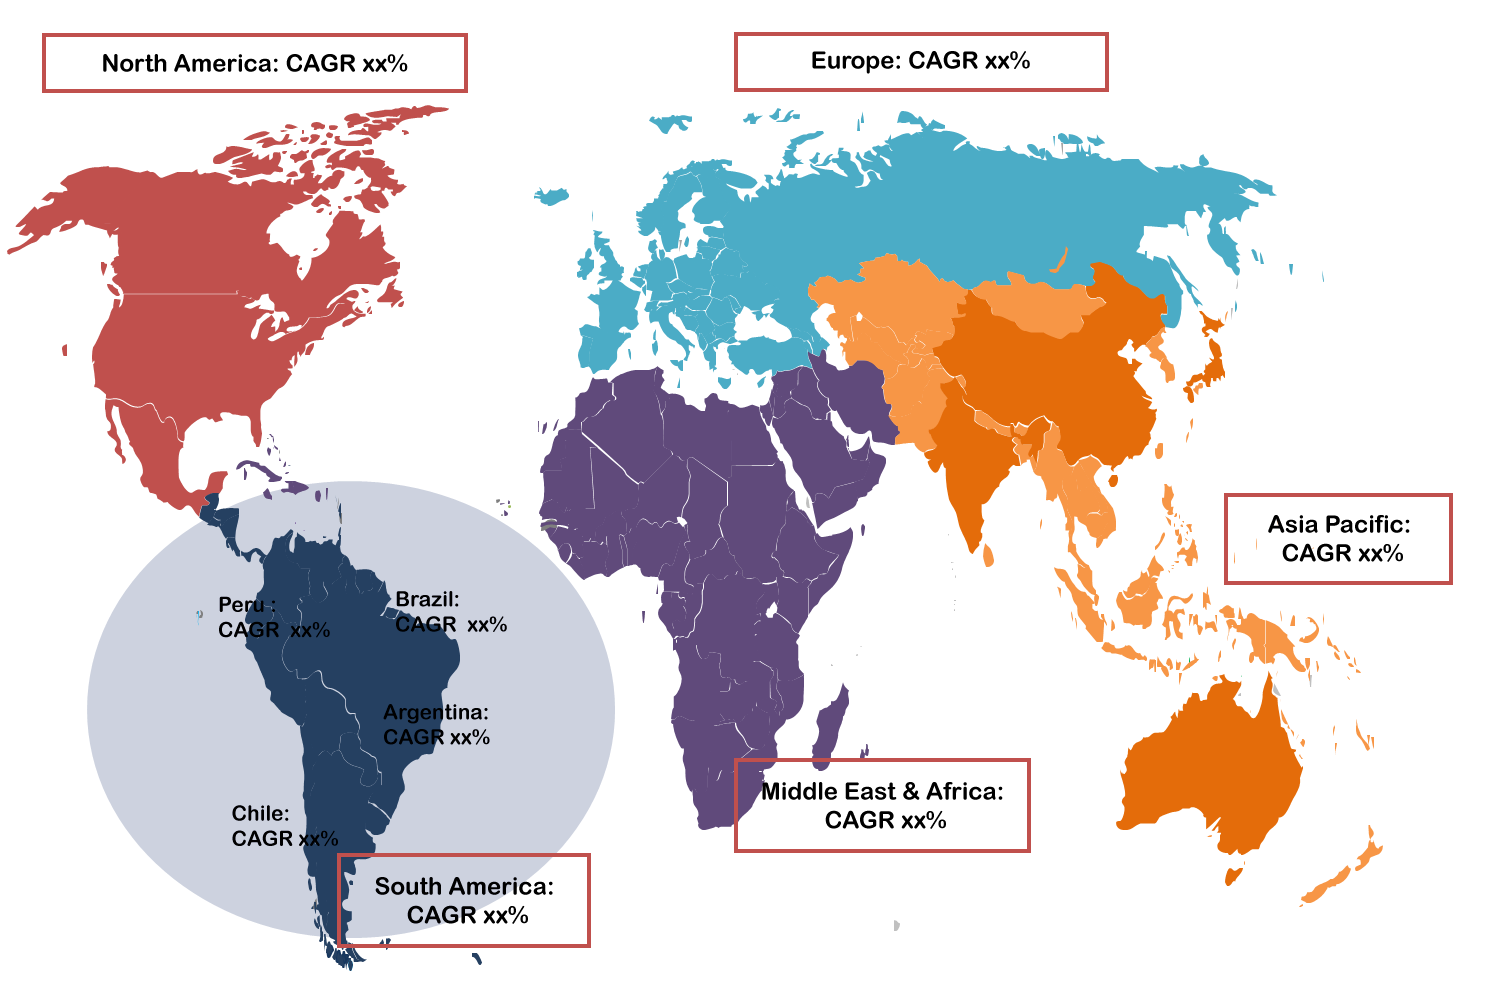
During the forecast period, the Asia Pacific region is expected to hold the largest market share. This leadership stems from its extensive farmlands and the agricultural dependence of major countries like China and India. With food demand climbing alongside population growth, fertilizers play a crucial role in boosting crop yields and ensuring food supply. Limited cultivable land has made fertilizers vital for intensive farming in the region. Strong government support, including subsidies and farmer education, further drives their use. Moreover, exports of crops such as rice, cereals, and vegetables add to demand. Thus, Asia-Pacific maintains its position as the leading fertilizer market.
Region with highest CAGR:
Over the forecast period, the South America region is anticipated to exhibit the highest CAGR. This growth is largely driven by Brazil and Argentina, where crops like soybeans, corn, and sugarcane dominate global exports. These crops demand intensive fertilizer use, encouraging widespread adoption. Expanding agricultural land, modernization of farming practices and rising global food demand strengthen the trend. Additionally, government support, private investments, and enhanced logistics are accelerating fertilizer penetration across the region. With its expanding role in global food supply chains, Latin America is set to remain the fastest-growing region in the fertilizer market.
Key players in the market
Some of the key players in Chemical Fertilizers Market include Coromandel International, Chambal Fertilisers, Gujarat State Fertilizers & Chemicals (GSFC), Rashtriya Chemicals and Fertilizers (RCF), Deepak Fertilisers, Zuari Agro Chemicals, National Fertilizers Ltd (NFL), Fertilisers and Chemicals Travancore (FACT), Gujarat Narmada Valley Fertilisers & Chemicals (GNFC), Nagarjuna Fertilisers, ICL Group Ltd., OCI N.V., CVR Partners, Tata Chemicals and Yara International.
Key Developments:
In July 2025, Deepak Fertilisers and Petrochemicals Corporation’s (DFPCL) group company, Performance Chemiserve, has signed a 5.5-year Liquefied Natural Gas regasification agreement with Petronet LNG (PLL). DFPCL Group will be importing the LNG. DFPCL has already signed an LNG sale and purchase agreement with Equinor, a global energy company based in Norway.
In March 2025, Coromandel International Limited announced the signing of definitive agreements to acquire majority stake in NACL Industries Limited (NACL). NACL is an India based Crop Protection player having strong branded formulation business in domestic markets, exports Technicals in key global geographies and has presence in contract manufacturing operations with global multinational agrochemical companies.
In January 2025, ICL announced it has signed a joint venture (JV) agreement with Shenzhen Dynanonic Co., Ltd. to establish lithium iron phosphate (LFP) cathode active material (CAM) production in Europe, with an initial investment of approximately €285 million. A new facility at ICL's Sallent, Spain, site is currently in planning stages and will substantially expand the company’s battery materials business.
Fertilizer Types Covered:
• Nitrogenous Fertilizers
• Phosphate Fertilizers
• Potash Fertilizers
• Compound Fertilizers
Crop Types Covered:
• Cereals & Grains
• Oilseeds & Pulses
• Fruits & Vegetables
• Turf & Ornamentals
Forms Covered:
• Solid Fertilizers
• Liquid Fertilizers
• Gaseous Fertilizers
Distribution Channels Covered:
• Direct-to-Farmer
• Agri-retailers & Distributors
• E-commerce Platforms
Applications Covered:
• Soil Application
• Foliar Spray
• Fertigation
• Aerial Application
Regions Covered:
• North America
o US
o Canada
o Mexico
• Europe
o Germany
o UK
o Italy
o France
o Spain
o Rest of Europe
• Asia Pacific
o Japan
o China
o India
o Australia
o New Zealand
o South Korea
o Rest of Asia Pacific
• South America
o Argentina
o Brazil
o Chile
o Rest of South America
• Middle East & Africa
o Saudi Arabia
o UAE
o Qatar
o South Africa
o Rest of Middle East & Africa
What our report offers:
- Market share assessments for the regional and country-level segments
- Strategic recommendations for the new entrants
- Covers Market data for the years 2024, 2025, 2026, 2028, and 2032
- Market Trends (Drivers, Constraints, Opportunities, Threats, Challenges, Investment Opportunities, and recommendations)
- Strategic recommendations in key business segments based on the market estimations
- Competitive landscaping mapping the key common trends
- Company profiling with detailed strategies, financials, and recent developments
- Supply chain trends mapping the latest technological advancements
Free Customization Offerings:
All the customers of this report will be entitled to receive one of the following free customization options:
• Company Profiling
o Comprehensive profiling of additional market players (up to 3)
o SWOT Analysis of key players (up to 3)
• Regional Segmentation
o Market estimations, Forecasts and CAGR of any prominent country as per the client's interest (Note: Depends on feasibility check)
• Competitive Benchmarking
o Benchmarking of key players based on product portfolio, geographical presence, and strategic alliances
Table of Contents
1 Executive Summary
2 Preface
2.1 Abstract
2.2 Stake Holders
2.3 Research Scope
2.4 Research Methodology
2.4.1 Data Mining
2.4.2 Data Analysis
2.4.3 Data Validation
2.4.4 Research Approach
2.5 Research Sources
2.5.1 Primary Research Sources
2.5.2 Secondary Research Sources
2.5.3 Assumptions
3 Market Trend Analysis
3.1 Introduction
3.2 Drivers
3.3 Restraints
3.4 Opportunities
3.5 Threats
3.6 Application Analysis
3.7 Emerging Markets
3.8 Impact of Covid-19
4 Porters Five Force Analysis
4.1 Bargaining power of suppliers
4.2 Bargaining power of buyers
4.3 Threat of substitutes
4.4 Threat of new entrants
4.5 Competitive rivalry
5 Global Chemical Fertilizers Market, By Fertilizer Type
5.1 Introduction
5.2 Nitrogenous Fertilizers
5.3 Phosphate Fertilizers
5.4 Potash Fertilizers
5.5 Compound Fertilizers
6 Global Chemical Fertilizers Market, By Crop Type
6.1 Introduction
6.2 Cereals & Grains
6.3 Oilseeds & Pulses
6.4 Fruits & Vegetables
6.5 Turf & Ornamentals
7 Global Chemical Fertilizers Market, By Form
7.1 Introduction
7.2 Solid Fertilizers
7.3 Liquid Fertilizers
7.4 Gaseous Fertilizers
8 Global Chemical Fertilizers Market, By Distribution Channel
8.1 Introduction
8.2 Direct-to-Farmer
8.3 Agri-retailers & Distributors
8.4 E-commerce Platforms
9 Global Chemical Fertilizers Market, By Application
9.1 Introduction
9.2 Soil Application
9.3 Foliar Spray
9.4 Fertigation
9.5 Aerial Application
10 Global Chemical Fertilizers Market, By Geography
10.1 Introduction
10.2 North America
10.2.1 US
10.2.2 Canada
10.2.3 Mexico
10.3 Europe
10.3.1 Germany
10.3.2 UK
10.3.3 Italy
10.3.4 France
10.3.5 Spain
10.3.6 Rest of Europe
10.4 Asia Pacific
10.4.1 Japan
10.4.2 China
10.4.3 India
10.4.4 Australia
10.4.5 New Zealand
10.4.6 South Korea
10.4.7 Rest of Asia Pacific
10.5 South America
10.5.1 Argentina
10.5.2 Brazil
10.5.3 Chile
10.5.4 Rest of South America
10.6 Middle East & Africa
10.6.1 Saudi Arabia
10.6.2 UAE
10.6.3 Qatar
10.6.4 South Africa
10.6.5 Rest of Middle East & Africa
11 Key Developments
11.1 Agreements, Partnerships, Collaborations and Joint Ventures
11.2 Acquisitions & Mergers
11.3 New Product Launch
11.4 Expansions
11.5 Other Key Strategies
12 Company Profiling
12.1 Coromandel International
12.2 Chambal Fertilisers
12.3 Gujarat State Fertilizers & Chemicals (GSFC)
12.4 Rashtriya Chemicals and Fertilizers (RCF)
12.5 Deepak Fertilisers
12.6 Zuari Agro Chemicals
12.7 National Fertilizers Ltd (NFL)
12.8 Fertilisers and Chemicals Travancore (FACT)
12.9 Gujarat Narmada Valley Fertilisers & Chemicals (GNFC)
12.10 Nagarjuna Fertilisers
12.11 ICL Group Ltd.
12.12 OCI N.V.
12.13 CVR Partners
12.14 Tata Chemicals
12.15 Yara International
List of Tables
1 Global Chemical Fertilizers Market Outlook, By Region (2024-2032) ($MN)
2 Global Chemical Fertilizers Market Outlook, By Fertilizer Type (2024-2032) ($MN)
3 Global Chemical Fertilizers Market Outlook, By Nitrogenous Fertilizers (2024-2032) ($MN)
4 Global Chemical Fertilizers Market Outlook, By Phosphate Fertilizers (2024-2032) ($MN)
5 Global Chemical Fertilizers Market Outlook, By Potash Fertilizers (2024-2032) ($MN)
6 Global Chemical Fertilizers Market Outlook, By Compound Fertilizers (2024-2032) ($MN)
7 Global Chemical Fertilizers Market Outlook, By Crop Type (2024-2032) ($MN)
8 Global Chemical Fertilizers Market Outlook, By Cereals & Grains (2024-2032) ($MN)
9 Global Chemical Fertilizers Market Outlook, By Oilseeds & Pulses (2024-2032) ($MN)
10 Global Chemical Fertilizers Market Outlook, By Fruits & Vegetables (2024-2032) ($MN)
11 Global Chemical Fertilizers Market Outlook, By Turf & Ornamentals (2024-2032) ($MN)
12 Global Chemical Fertilizers Market Outlook, By Form (2024-2032) ($MN)
13 Global Chemical Fertilizers Market Outlook, By Solid Fertilizers (2024-2032) ($MN)
14 Global Chemical Fertilizers Market Outlook, By Liquid Fertilizers (2024-2032) ($MN)
15 Global Chemical Fertilizers Market Outlook, By Gaseous Fertilizers (2024-2032) ($MN)
16 Global Chemical Fertilizers Market Outlook, By Distribution Channel (2024-2032) ($MN)
17 Global Chemical Fertilizers Market Outlook, By Direct-to-Farmer (2024-2032) ($MN)
18 Global Chemical Fertilizers Market Outlook, By Agri-retailers & Distributors (2024-2032) ($MN)
19 Global Chemical Fertilizers Market Outlook, By E-commerce Platforms (2024-2032) ($MN)
20 Global Chemical Fertilizers Market Outlook, By Application (2024-2032) ($MN)
21 Global Chemical Fertilizers Market Outlook, By Soil Application (2024-2032) ($MN)
22 Global Chemical Fertilizers Market Outlook, By Foliar Spray (2024-2032) ($MN)
23 Global Chemical Fertilizers Market Outlook, By Fertigation (2024-2032) ($MN)
24 Global Chemical Fertilizers Market Outlook, By Aerial Application (2024-2032) ($MN)
Note: Tables for North America, Europe, APAC, South America, and Middle East & Africa Regions are also represented in the same manner as above.
List of Figures
RESEARCH METHODOLOGY

We at ‘Stratistics’ opt for an extensive research approach which involves data mining, data validation, and data analysis. The various research sources include in-house repository, secondary research, competitor’s sources, social media research, client internal data, and primary research.
Our team of analysts prefers the most reliable and authenticated data sources in order to perform the comprehensive literature search. With access to most of the authenticated data bases our team highly considers the best mix of information through various sources to obtain extensive and accurate analysis.
Each report takes an average time of a month and a team of 4 industry analysts. The time may vary depending on the scope and data availability of the desired market report. The various parameters used in the market assessment are standardized in order to enhance the data accuracy.
Data Mining
The data is collected from several authenticated, reliable, paid and unpaid sources and is filtered depending on the scope & objective of the research. Our reports repository acts as an added advantage in this procedure. Data gathering from the raw material suppliers, distributors and the manufacturers is performed on a regular basis, this helps in the comprehensive understanding of the products value chain. Apart from the above mentioned sources the data is also collected from the industry consultants to ensure the objective of the study is in the right direction.
Market trends such as technological advancements, regulatory affairs, market dynamics (Drivers, Restraints, Opportunities and Challenges) are obtained from scientific journals, market related national & international associations and organizations.
Data Analysis
From the data that is collected depending on the scope & objective of the research the data is subjected for the analysis. The critical steps that we follow for the data analysis include:
- Product Lifecycle Analysis
- Competitor analysis
- Risk analysis
- Porters Analysis
- PESTEL Analysis
- SWOT Analysis
The data engineering is performed by the core industry experts considering both the Marketing Mix Modeling and the Demand Forecasting. The marketing mix modeling makes use of multiple-regression techniques to predict the optimal mix of marketing variables. Regression factor is based on a number of variables and how they relate to an outcome such as sales or profits.
Data Validation
The data validation is performed by the exhaustive primary research from the expert interviews. This includes telephonic interviews, focus groups, face to face interviews, and questionnaires to validate our research from all aspects. The industry experts we approach come from the leading firms, involved in the supply chain ranging from the suppliers, distributors to the manufacturers and consumers so as to ensure an unbiased analysis.
We are in touch with more than 15,000 industry experts with the right mix of consultants, CEO's, presidents, vice presidents, managers, experts from both supply side and demand side, executives and so on.
The data validation involves the primary research from the industry experts belonging to:
- Leading Companies
- Suppliers & Distributors
- Manufacturers
- Consumers
- Industry/Strategic Consultants
Apart from the data validation the primary research also helps in performing the fill gap research, i.e. providing solutions for the unmet needs of the research which helps in enhancing the reports quality.
For more details about research methodology, kindly write to us at info@strategymrc.com
Frequently Asked Questions
In case of any queries regarding this report, you can contact the customer service by filing the “Inquiry Before Buy” form available on the right hand side. You may also contact us through email: info@strategymrc.com or phone: +1-301-202-5929
Yes, the samples are available for all the published reports. You can request them by filling the “Request Sample” option available in this page.
Yes, you can request a sample with your specific requirements. All the customized samples will be provided as per the requirement with the real data masked.
All our reports are available in Digital PDF format. In case if you require them in any other formats, such as PPT, Excel etc you can submit a request through “Inquiry Before Buy” form available on the right hand side. You may also contact us through email: info@strategymrc.com or phone: +1-301-202-5929
We offer a free 15% customization with every purchase. This requirement can be fulfilled for both pre and post sale. You may send your customization requirements through email at info@strategymrc.com or call us on +1-301-202-5929.
We have 3 different licensing options available in electronic format.
- Single User Licence: Allows one person, typically the buyer, to have access to the ordered product. The ordered product cannot be distributed to anyone else.
- 2-5 User Licence: Allows the ordered product to be shared among a maximum of 5 people within your organisation.
- Corporate License: Allows the product to be shared among all employees of your organisation regardless of their geographical location.
All our reports are typically be emailed to you as an attachment.
To order any available report you need to register on our website. The payment can be made either through CCAvenue or PayPal payments gateways which accept all international cards.
We extend our support to 6 months post sale. A post sale customization is also provided to cover your unmet needs in the report.
Request Customization
We offer complimentary customization of up to 15% with every purchase. To share your customization requirements, feel free to email us at info@strategymrc.com or call us on +1-301-202-5929. .
Please Note: Customization within the 15% threshold is entirely free of charge. If your request exceeds this limit, we will conduct a feasibility assessment. Following that, a detailed quote and timeline will be provided.
WHY CHOOSE US ?

Assured Quality
Best in class reports with high standard of research integrity

24X7 Research Support
Continuous support to ensure the best customer experience.

Free Customization
Adding more values to your product of interest.

Safe & Secure Access
Providing a secured environment for all online transactions.

Trusted by 600+ Brands
Serving the most reputed brands across the world.