
Collimating Lens Market
Collimating Lens Market Forecasts to 2028 - Global Analysis By Light Source (LED, Laser and Others Light sources), Material (Glass, Plastic and Others materials), Wavelength(<1,000, 1,000-1,500, 1,500-2,000 and >2,000), End users(Automobile, Medical, LiDAR and Light and Display Measurement) and By Geography

|
Years Covered |
2020-2028 |
|
Estimated Year Value (2022) |
US $388.83 MN |
|
Projected Year Value (2028) |
US $606.81 MN |
|
CAGR (2022 - 2028) |
7.7% |
|
Regions Covered |
North America, Europe, Asia Pacific, South America, and Middle East & Africa |
|
Countries Covered |
US, Canada, Mexico, Germany, UK, Italy, France, Spain, Japan, China, India, Australia, New Zealand, South Korea, Rest of Asia Pacific, South America, Argentina, Brazil, Chile, Middle East & Africa, Saudi Arabia, UAE, Qatar, and South Africa |
|
Largest Market |
North America |
|
Highest Growing Market |
Asia Pacific |
According to Stratistics MRC, the Global Collimating Lens Market is accounted for $388.83 million in 2022 and is expected to reach $606.81 million by 2028 growing at a CAGR of 7.7% during the forecast period. Collimating lenses are the assisting optical lenses that align the lines to be parallel before entering the spectrometer. These lenses assist in setting the illumination and collection angles for sampling, as well as controlling the field of view, collection competence, and spatial resolution of their units. Additionally, it is used to narrow down the spatial section of light beams, improving visualization.
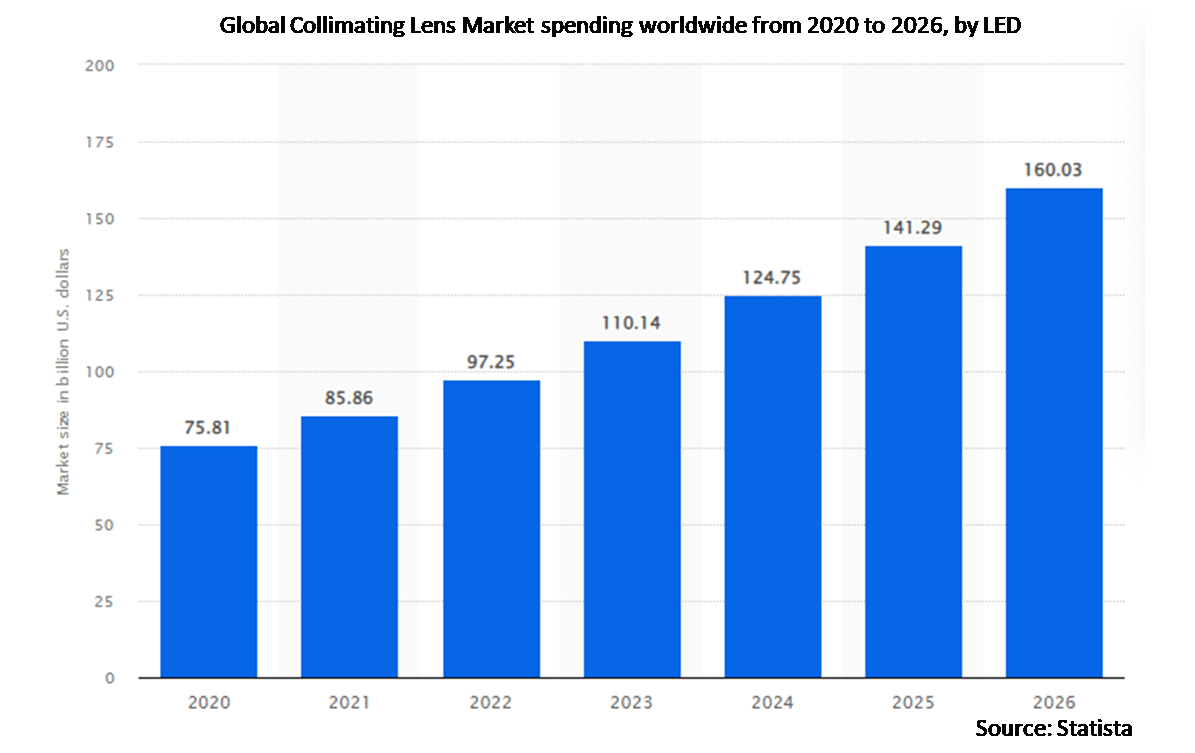
According to the report published by Zion Market Research, global demand for collimating lens market was valued at approximately USD 305.47 Million in 2019, and is expected to generate revenue of around USD 453.28 Million by end of 2026, growing at a CAGR of around 5.8% between 2020 and 2026.
Market Dynamics:
Driver:
Rise in the use of optics systems
Collimating lenses are curved optical devices used to align the light beams entering a spectrometer setup. Users can alter the setup's field of view, collection efficiency, and spatial resolution by using these lenses to change the lighting and sampling collection angles. Spectrophotometers, colorimeters, and light meters are a few examples of collimating lenses that are used to make sure the light entering an instrument is parallel and covers the required measuring area. In optical systems, lenses are used. In the upcoming five years, for instance, Collimating lenses are advantageous in many ways when compared to other kinds of lenses, especially when expanding optic systems. Collimation lenses are therefore being used more frequently in various industries. Light beams can be collimated with great accuracy and clarity using collimating lenses. Users can regulate the field of view, spatial resolution, and efficiency of their tools or setups by using collimating lenses.
Restraint:
High cost of manufacturing
Aspheric lenses offer more optical functionality than spherical lenses, which ultimately results in an expensive investment. Because of the high manufacturing costs, it is difficult for a variety of end users to adopt aspheric lenses for better performance, which restrains the collimating lens market's expansion.
Opportunity:
Optical sensor market gains in popularity
The collimating lens market created opportunities for the growth by recent developments in optical sensor technology, which have significantly changed the industry. These developments have led to a class of devices that are used in various types of light-matter interactions to monitor, use contactless detection, quantify molecules, and generate analytical signals for a variety of applications. The AQ2200 optical sensor modules were updated and released by the Japanese multinational electrical engineering and software company Yokogawa Electric Corporation in July 2020. For a variety of applications that require high accuracy, the AQ2200-212 single-channel optical sensor module offers improved measurement performance and minimal uncertainty. As a result, it is anticipated that the introduction of various optical measuring applications and non-imaging optics solutions will propel the collimating lens market.
Threat:
Product and quality evaluation
Due to the extreme precision needed in collimating lenses, quality control and product testing can be difficult. Some geometric parameters, like peak-valley value and roughness, are frequently used in the evaluation of lens quality geometric parameters, like peak-valley value and roughness, are frequently used in the evaluation of lens quality. According to performance evaluation, experiments are done to validate the analysis, and a mold polishing procedure is offered as a way to improve lens quality. This can affect the production cycle and raise costs. Some geometric parameters, like peak-valley value and roughness, are frequently used in the evaluation of lens quality.
Covid-19 Impact:
Significant alterations in people's priorities, organizations' policies, and governmental operations were brought about by the effects of COVID-19 on daily life. These new findings fuel innovation and technological progress. Collimating lenses are essential components of the hardware infrastructure for industries such as consumer electronics, healthcare, IT and ITES, automotive, telecommunications, and government. The introduction of COVID-19, according to the Electronic Components Business Association, has hampered other business operations in the industry and delayed the launch of new products. Numerous manufacturers have temporarily ceased operations as a result of the reduced product demand caused by lockdown procedures and the constrained manufacturing capacity.
The automobile segment is expected to be the largest during the forecast period
Automobile manufacturers constantly strive to make their products unique by differentiating their vehicles from those offered by their competitors. Automobile producers are using laser and LED headlamps and other advanced lighting technologies to set their products apart from those of rivals, which is helping to drive the market. As a result, market opportunities are created by the growing use of LED headlamps in automobiles.
The glass segment is expected to have the highest CAGR during the forecast period
The market's highest CAGR is anticipated for the glass segment during the forecast period, which currently holds a sizable market share. Light travels through materials more slowly, the higher their refractive index. The refractive index is calculated as the difference between the speed of light in a vacuum and the material of the lens. Light moves more slowly through the lens material, increasing the amount of refractive distortion. Therefore, the market for glass collimating lenses will experience growth due to higher glass material density.
Region with highest share:
North America will hold the largest market share for laser collimating lenses globally. The demand for laser collimating lenses is increasing due to the presence of major players and cutting-edge technologies. There are many benefits when compared to other lens types, including an increasing number of applications and the growth of optic systems. Collimation lenses are consequently employed more frequently in industry.
Region with highest CAGR:
Asia Pacific is projected to have the highest CAGR over the forecast period, due to the rising demand for LiDAR systems in nations like China and Japan, by the growing use of these systems in automotive applications. Over the next years, the market will grow as a result of rising pharmaceutical company demand for spectroscopy equipment. The high adoption of cutting-edge technologies in numerous applications, including medical, lidar, light and display measurement, and spectroscopy, will cause markets revenue share to exceed 25% in 2021.

Key players in the market
Some of the key players in Collimating Lens market include AMS Technologies AG, Auer Lighting GmbH, Avantes BV, Axetris AG, Bentham, Broadcom, CASIX, Edmund Optics Inc., FISBA AG, Focuslight Technologies Inc., Hamamatsu Photonics K.K., Ingeneric GmbH, IPG Photonics Corporation, Lightpath Technologies, Ocean Optics, Inc., Optikos Corporation, Quarton Inc, , The Optoelectronics Co. Ltd., Thorlabs, Inc., Trioptics GmbH and Ushio America, Inc.
Key Developments:
In October 2022, Auer Lighting GmbH received certification from IATF 16949 technical specifications to develop a quality management system issued by the international automotive Task Force.
In June 2022, Ocean Insights expanded its Rochester, N.Y facility. The company is doubling its engineering, production, and support facility. The new facility will focus on developing a spectral system for industries, including consumer electronics. The new 13,528-square-foot facility will expand the company's production capabilities and strengthen its photonics product and application expertise portfolio.
In May 2022, Focuslight Technologies Inc. unveiled the Focuslight Blue Meniscus SAC. This new Slow Axis Collimator (SAC) features an effective focal length (EFL) of 9.7 mm. It has a concave-convex, a cylindrical lens design for collimating the slow axis of laser diodes.
Light Sources Covered:
• LED
• Laser
• Others Light sources
Materials Covered:
• Glass
• Plastic
• Others materials
Wavelengths Covered:
• <1,000
• 1,000–1,500
• 1,500–2,000
• >2,000
End Users Covered:
• Automobile
• Medical
• LiDAR
• Light and Display Measurement
• Spectroscopy
• Interferometry
• Other End Users
Regions Covered:
• North America
o US
o Canada
o Mexico
• Europe
o Germany
o UK
o Italy
o France
o Spain
o Rest of Europe
• Asia Pacific
o Japan
o China
o India
o Australia
o New Zealand
o South Korea
o Rest of Asia Pacific
• South America
o Argentina
o Brazil
o Chile
o Rest of South America
• Middle East & Africa
o Saudi Arabia
o UAE
o Qatar
o South Africa
o Rest of Middle East & Africa
What our report offers:
- Market share assessments for the regional and country-level segments
- Strategic recommendations for the new entrants
- Covers Market data for the years 2020, 2021, 2022, 2025, and 2028
- Market Trends (Drivers, Constraints, Opportunities, Threats, Challenges, Investment Opportunities, and recommendations)
- Strategic recommendations in key business segments based on the market estimations
- Competitive landscaping mapping the key common trends
- Company profiling with detailed strategies, financials, and recent developments
- Supply chain trends mapping the latest technological advancements
Free Customization Offerings:
All the customers of this report will be entitled to receive one of the following free customization options:
• Company Profiling
o Comprehensive profiling of additional market players (up to 3)
o SWOT Analysis of key players (up to 3)
• Regional Segmentation
o Market estimations, Forecasts and CAGR of any prominent country as per the client's interest (Note: Depends on feasibility check)
• Competitive Benchmarking
Benchmarking of key players based on product portfolio, geographical presence, and strategic alliances
Table of Contents
1 Executive Summary
2 Preface
2.1 Abstract
2.2 Stake Holders
2.3 Research Scope
2.4 Research Methodology
2.4.1 Data Mining
2.4.2 Data Analysis
2.4.3 Data Validation
2.4.4 Research Approach
2.5 Research Sources
2.5.1 Primary Research Sources
2.5.2 Secondary Research Sources
2.5.3 Assumptions
3 Market Trend Analysis
3.1 Introduction
3.2 Drivers
3.3 Restraints
3.4 Opportunities
3.5 Threats
3.6 End User Analysis
3.7 Emerging Markets
3.8 Impact of Covid-19
4 Porters Five Force Analysis
4.1 Bargaining power of suppliers
4.2 Bargaining power of buyers
4.3 Threat of substitutes
4.4 Threat of new entrants
4.5 Competitive rivalry
5 Global Collimating Lens Market, By Light Source
5.1 Introduction
5.2 LED
5.3 Laser
5.4 Others Light sources
6 Global Collimating Lens Market, By Material
6.1 Introduction
6.2 Glass
6.3 Plastic
6.4 Others materials
7 Global Collimating Lens Market, By Wavelength
7.1 Introduction
7.2 <1,000
7.3 1,000-1,500
7.4 1,500-2,000
7.5 >2,000
8 Global Collimating Lens Market, By End User
8.1 Introduction
8.2 Automobile
8.3 Medical
8.4 LiDAR
8.5 Light and Display Measurement
8.6 Spectroscopy
8.7 Interferometry
8.8 Other End Users
9 Global Collimating Lens Market, By Geography
9.1 Introduction
9.2 North America
9.2.1 US
9.2.2 Canada
9.2.3 Mexico
9.3 Europe
9.3.1 Germany
9.3.2 UK
9.3.3 Italy
9.3.4 France
9.3.5 Spain
9.3.6 Rest of Europe
9.4 Asia Pacific
9.4.1 Japan
9.4.2 China
9.4.3 India
9.4.4 Australia
9.4.5 New Zealand
9.4.6 South Korea
9.4.7 Rest of Asia Pacific
9.5 South America
9.5.1 Argentina
9.5.2 Brazil
9.5.3 Chile
9.5.4 Rest of South America
9.6 Middle East & Africa
9.6.1 Saudi Arabia
9.6.2 UAE
9.6.3 Qatar
9.6.4 South Africa
9.6.5 Rest of Middle East & Africa
10 Key Developments
10.1 Agreements, Partnerships, Collaborations and Joint Ventures
10.2 Acquisitions & Mergers
10.3 New Product Launch
10.4 Expansions
10.5 Other Key Strategies
11 Company Profiling
11.1 AMS Technologies AG
11.2 Auer Lighting GmbH
11.3 Avantes BV
11.4 Axetris AG
11.5 Bentham
11.6 Broadcom
11.7 CASIX
11.8 Edmund Optics Inc.
11.9 FISBA AG
11.10 Focuslight Technologies Inc.
11.11 Hamamatsu Photonics K.K.
11.12 Ingeneric GmbH
11.13 IPG Photonics Corporation
11.14 Lightpath Technologies
11.15 Ocean Optics, Inc.
11.16 Optikos Corporation
11.17 Quarton Inc,
11.18 The Optoelectronics Co. Ltd.
11.19 Thorlabs, Inc.
11.20 Trioptics GmbH
11.21 Ushio America, Inc.
List of Tables
1 Global Collimating Lens Market Outlook, By Region (2020-2028) ($MN)
2 Global Collimating Lens Market Outlook, By Light Source (2020-2028) ($MN)
3 Global Collimating Lens Market Outlook, By LED (2020-2028) ($MN)
4 Global Collimating Lens Market Outlook, By Laser (2020-2028) ($MN)
5 Global Collimating Lens Market Outlook, By Others Light sources (2020-2028) ($MN)
6 Global Collimating Lens Market Outlook, By Material (2020-2028) ($MN)
7 Global Collimating Lens Market Outlook, By Glass (2020-2028) ($MN)
8 Global Collimating Lens Market Outlook, By Plastic (2020-2028) ($MN)
9 Global Collimating Lens Market Outlook, By Others materials (2020-2028) ($MN)
10 Global Collimating Lens Market Outlook, By Wavelength (2020-2028) ($MN)
11 Global Collimating Lens Market Outlook, By <1,000 (2020-2028) ($MN)
12 Global Collimating Lens Market Outlook, By 1,000-1,500 (2020-2028) ($MN)
13 Global Collimating Lens Market Outlook, By 1,500-2,000 (2020-2028) ($MN)
14 Global Collimating Lens Market Outlook, By >2,000 (2020-2028) ($MN)
15 Global Collimating Lens Market Outlook, By End User (2020-2028) ($MN)
16 Global Collimating Lens Market Outlook, By Automobile (2020-2028) ($MN)
17 Global Collimating Lens Market Outlook, By Medical (2020-2028) ($MN)
18 Global Collimating Lens Market Outlook, By LiDAR (2020-2028) ($MN)
19 Global Collimating Lens Market Outlook, By Light and Display Measurement (2020-2028) ($MN)
20 Global Collimating Lens Market Outlook, By Spectroscopy (2020-2028) ($MN)
21 Global Collimating Lens Market Outlook, By Interferometry (2020-2028) ($MN)
22 Global Collimating Lens Market Outlook, By Other End Users (2020-2028) ($MN)
23 North America Collimating Lens Market Outlook, By Country (2020-2028) ($MN)
24 North America Collimating Lens Market Outlook, By Light Source (2020-2028) ($MN)
25 North America Collimating Lens Market Outlook, By LED (2020-2028) ($MN)
26 North America Collimating Lens Market Outlook, By Laser (2020-2028) ($MN)
27 North America Collimating Lens Market Outlook, By Others Light sources (2020-2028) ($MN)
28 North America Collimating Lens Market Outlook, By Material (2020-2028) ($MN)
29 North America Collimating Lens Market Outlook, By Glass (2020-2028) ($MN)
30 North America Collimating Lens Market Outlook, By Plastic (2020-2028) ($MN)
31 North America Collimating Lens Market Outlook, By Others materials (2020-2028) ($MN)
32 North America Collimating Lens Market Outlook, By Wavelength (2020-2028) ($MN)
33 North America Collimating Lens Market Outlook, By <1,000 (2020-2028) ($MN)
34 North America Collimating Lens Market Outlook, By 1,000-1,500 (2020-2028) ($MN)
35 North America Collimating Lens Market Outlook, By 1,500-2,000 (2020-2028) ($MN)
36 North America Collimating Lens Market Outlook, By >2,000 (2020-2028) ($MN)
37 North America Collimating Lens Market Outlook, By End User (2020-2028) ($MN)
38 North America Collimating Lens Market Outlook, By Automobile (2020-2028) ($MN)
39 North America Collimating Lens Market Outlook, By Medical (2020-2028) ($MN)
40 North America Collimating Lens Market Outlook, By LiDAR (2020-2028) ($MN)
41 North America Collimating Lens Market Outlook, By Light and Display Measurement (2020-2028) ($MN)
42 North America Collimating Lens Market Outlook, By Spectroscopy (2020-2028) ($MN)
43 North America Collimating Lens Market Outlook, By Interferometry (2020-2028) ($MN)
44 North America Collimating Lens Market Outlook, By Other End Users (2020-2028) ($MN)
45 Europe Collimating Lens Market Outlook, By Country (2020-2028) ($MN)
46 Europe Collimating Lens Market Outlook, By Light Source (2020-2028) ($MN)
47 Europe Collimating Lens Market Outlook, By LED (2020-2028) ($MN)
48 Europe Collimating Lens Market Outlook, By Laser (2020-2028) ($MN)
49 Europe Collimating Lens Market Outlook, By Others Light sources (2020-2028) ($MN)
50 Europe Collimating Lens Market Outlook, By Material (2020-2028) ($MN)
51 Europe Collimating Lens Market Outlook, By Glass (2020-2028) ($MN)
52 Europe Collimating Lens Market Outlook, By Plastic (2020-2028) ($MN)
53 Europe Collimating Lens Market Outlook, By Others materials (2020-2028) ($MN)
54 Europe Collimating Lens Market Outlook, By Wavelength (2020-2028) ($MN)
55 Europe Collimating Lens Market Outlook, By <1,000 (2020-2028) ($MN)
56 Europe Collimating Lens Market Outlook, By 1,000-1,500 (2020-2028) ($MN)
57 Europe Collimating Lens Market Outlook, By 1,500-2,000 (2020-2028) ($MN)
58 Europe Collimating Lens Market Outlook, By >2,000 (2020-2028) ($MN)
59 Europe Collimating Lens Market Outlook, By End User (2020-2028) ($MN)
60 Europe Collimating Lens Market Outlook, By Automobile (2020-2028) ($MN)
61 Europe Collimating Lens Market Outlook, By Medical (2020-2028) ($MN)
62 Europe Collimating Lens Market Outlook, By LiDAR (2020-2028) ($MN)
63 Europe Collimating Lens Market Outlook, By Light and Display Measurement (2020-2028) ($MN)
64 Europe Collimating Lens Market Outlook, By Spectroscopy (2020-2028) ($MN)
65 Europe Collimating Lens Market Outlook, By Interferometry (2020-2028) ($MN)
66 Europe Collimating Lens Market Outlook, By Other End Users (2020-2028) ($MN)
67 Asia Pacific Collimating Lens Market Outlook, By Country (2020-2028) ($MN)
68 Asia Pacific Collimating Lens Market Outlook, By Light Source (2020-2028) ($MN)
69 Asia Pacific Collimating Lens Market Outlook, By LED (2020-2028) ($MN)
70 Asia Pacific Collimating Lens Market Outlook, By Laser (2020-2028) ($MN)
71 Asia Pacific Collimating Lens Market Outlook, By Others Light sources (2020-2028) ($MN)
72 Asia Pacific Collimating Lens Market Outlook, By Material (2020-2028) ($MN)
73 Asia Pacific Collimating Lens Market Outlook, By Glass (2020-2028) ($MN)
74 Asia Pacific Collimating Lens Market Outlook, By Plastic (2020-2028) ($MN)
75 Asia Pacific Collimating Lens Market Outlook, By Others materials (2020-2028) ($MN)
76 Asia Pacific Collimating Lens Market Outlook, By Wavelength (2020-2028) ($MN)
77 Asia Pacific Collimating Lens Market Outlook, By <1,000 (2020-2028) ($MN)
78 Asia Pacific Collimating Lens Market Outlook, By 1,000-1,500 (2020-2028) ($MN)
79 Asia Pacific Collimating Lens Market Outlook, By 1,500-2,000 (2020-2028) ($MN)
80 Asia Pacific Collimating Lens Market Outlook, By >2,000 (2020-2028) ($MN)
81 Asia Pacific Collimating Lens Market Outlook, By End User (2020-2028) ($MN)
82 Asia Pacific Collimating Lens Market Outlook, By Automobile (2020-2028) ($MN)
83 Asia Pacific Collimating Lens Market Outlook, By Medical (2020-2028) ($MN)
84 Asia Pacific Collimating Lens Market Outlook, By LiDAR (2020-2028) ($MN)
85 Asia Pacific Collimating Lens Market Outlook, By Light and Display Measurement (2020-2028) ($MN)
86 Asia Pacific Collimating Lens Market Outlook, By Spectroscopy (2020-2028) ($MN)
87 Asia Pacific Collimating Lens Market Outlook, By Interferometry (2020-2028) ($MN)
88 Asia Pacific Collimating Lens Market Outlook, By Other End Users (2020-2028) ($MN)
89 South America Collimating Lens Market Outlook, By Country (2020-2028) ($MN)
90 South America Collimating Lens Market Outlook, By Light Source (2020-2028) ($MN)
91 South America Collimating Lens Market Outlook, By LED (2020-2028) ($MN)
92 South America Collimating Lens Market Outlook, By Laser (2020-2028) ($MN)
93 South America Collimating Lens Market Outlook, By Others Light sources (2020-2028) ($MN)
94 South America Collimating Lens Market Outlook, By Material (2020-2028) ($MN)
95 South America Collimating Lens Market Outlook, By Glass (2020-2028) ($MN)
96 South America Collimating Lens Market Outlook, By Plastic (2020-2028) ($MN)
97 South America Collimating Lens Market Outlook, By Others materials (2020-2028) ($MN)
98 South America Collimating Lens Market Outlook, By Wavelength (2020-2028) ($MN)
99 South America Collimating Lens Market Outlook, By <1,000 (2020-2028) ($MN)
100 South America Collimating Lens Market Outlook, By 1,000-1,500 (2020-2028) ($MN)
101 South America Collimating Lens Market Outlook, By 1,500-2,000 (2020-2028) ($MN)
102 South America Collimating Lens Market Outlook, By >2,000 (2020-2028) ($MN)
103 South America Collimating Lens Market Outlook, By End User (2020-2028) ($MN)
104 South America Collimating Lens Market Outlook, By Automobile (2020-2028) ($MN)
105 South America Collimating Lens Market Outlook, By Medical (2020-2028) ($MN)
106 South America Collimating Lens Market Outlook, By LiDAR (2020-2028) ($MN)
107 South America Collimating Lens Market Outlook, By Light and Display Measurement (2020-2028) ($MN)
108 South America Collimating Lens Market Outlook, By Spectroscopy (2020-2028) ($MN)
109 South America Collimating Lens Market Outlook, By Interferometry (2020-2028) ($MN)
110 South America Collimating Lens Market Outlook, By Other End Users (2020-2028) ($MN)
111 Middle East & Africa Collimating Lens Market Outlook, By Country (2020-2028) ($MN)
112 Middle East & Africa Collimating Lens Market Outlook, By Light Source (2020-2028) ($MN)
113 Middle East & Africa Collimating Lens Market Outlook, By LED (2020-2028) ($MN)
114 Middle East & Africa Collimating Lens Market Outlook, By Laser (2020-2028) ($MN)
115 Middle East & Africa Collimating Lens Market Outlook, By Others Light sources (2020-2028) ($MN)
116 Middle East & Africa Collimating Lens Market Outlook, By Material (2020-2028) ($MN)
117 Middle East & Africa Collimating Lens Market Outlook, By Glass (2020-2028) ($MN)
118 Middle East & Africa Collimating Lens Market Outlook, By Plastic (2020-2028) ($MN)
119 Middle East & Africa Collimating Lens Market Outlook, By Others materials (2020-2028) ($MN)
120 Middle East & Africa Collimating Lens Market Outlook, By Wavelength (2020-2028) ($MN)
121 Middle East & Africa Collimating Lens Market Outlook, By <1,000 (2020-2028) ($MN)
122 Middle East & Africa Collimating Lens Market Outlook, By 1,000-1,500 (2020-2028) ($MN)
123 Middle East & Africa Collimating Lens Market Outlook, By 1,500-2,000 (2020-2028) ($MN)
124 Middle East & Africa Collimating Lens Market Outlook, By >2,000 (2020-2028) ($MN)
125 Middle East & Africa Collimating Lens Market Outlook, By End User (2020-2028) ($MN)
126 Middle East & Africa Collimating Lens Market Outlook, By Automobile (2020-2028) ($MN)
127 Middle East & Africa Collimating Lens Market Outlook, By Medical (2020-2028) ($MN)
128 Middle East & Africa Collimating Lens Market Outlook, By LiDAR (2020-2028) ($MN)
129 Middle East & Africa Collimating Lens Market Outlook, By Light and Display Measurement (2020-2028) ($MN)
130 Middle East & Africa Collimating Lens Market Outlook, By Spectroscopy (2020-2028) ($MN)
131 Middle East & Africa Collimating Lens Market Outlook, By Interferometry (2020-2028) ($MN)
132 Middle East & Africa Collimating Lens Market Outlook, By Other End Users (2020-2028) ($MN)
List of Figures
RESEARCH METHODOLOGY

We at ‘Stratistics’ opt for an extensive research approach which involves data mining, data validation, and data analysis. The various research sources include in-house repository, secondary research, competitor’s sources, social media research, client internal data, and primary research.
Our team of analysts prefers the most reliable and authenticated data sources in order to perform the comprehensive literature search. With access to most of the authenticated data bases our team highly considers the best mix of information through various sources to obtain extensive and accurate analysis.
Each report takes an average time of a month and a team of 4 industry analysts. The time may vary depending on the scope and data availability of the desired market report. The various parameters used in the market assessment are standardized in order to enhance the data accuracy.
Data Mining
The data is collected from several authenticated, reliable, paid and unpaid sources and is filtered depending on the scope & objective of the research. Our reports repository acts as an added advantage in this procedure. Data gathering from the raw material suppliers, distributors and the manufacturers is performed on a regular basis, this helps in the comprehensive understanding of the products value chain. Apart from the above mentioned sources the data is also collected from the industry consultants to ensure the objective of the study is in the right direction.
Market trends such as technological advancements, regulatory affairs, market dynamics (Drivers, Restraints, Opportunities and Challenges) are obtained from scientific journals, market related national & international associations and organizations.
Data Analysis
From the data that is collected depending on the scope & objective of the research the data is subjected for the analysis. The critical steps that we follow for the data analysis include:
- Product Lifecycle Analysis
- Competitor analysis
- Risk analysis
- Porters Analysis
- PESTEL Analysis
- SWOT Analysis
The data engineering is performed by the core industry experts considering both the Marketing Mix Modeling and the Demand Forecasting. The marketing mix modeling makes use of multiple-regression techniques to predict the optimal mix of marketing variables. Regression factor is based on a number of variables and how they relate to an outcome such as sales or profits.
Data Validation
The data validation is performed by the exhaustive primary research from the expert interviews. This includes telephonic interviews, focus groups, face to face interviews, and questionnaires to validate our research from all aspects. The industry experts we approach come from the leading firms, involved in the supply chain ranging from the suppliers, distributors to the manufacturers and consumers so as to ensure an unbiased analysis.
We are in touch with more than 15,000 industry experts with the right mix of consultants, CEO's, presidents, vice presidents, managers, experts from both supply side and demand side, executives and so on.
The data validation involves the primary research from the industry experts belonging to:
- Leading Companies
- Suppliers & Distributors
- Manufacturers
- Consumers
- Industry/Strategic Consultants
Apart from the data validation the primary research also helps in performing the fill gap research, i.e. providing solutions for the unmet needs of the research which helps in enhancing the reports quality.
For more details about research methodology, kindly write to us at info@strategymrc.com
Frequently Asked Questions
In case of any queries regarding this report, you can contact the customer service by filing the “Inquiry Before Buy” form available on the right hand side. You may also contact us through email: info@strategymrc.com or phone: +1-301-202-5929
Yes, the samples are available for all the published reports. You can request them by filling the “Request Sample” option available in this page.
Yes, you can request a sample with your specific requirements. All the customized samples will be provided as per the requirement with the real data masked.
All our reports are available in Digital PDF format. In case if you require them in any other formats, such as PPT, Excel etc you can submit a request through “Inquiry Before Buy” form available on the right hand side. You may also contact us through email: info@strategymrc.com or phone: +1-301-202-5929
We offer a free 15% customization with every purchase. This requirement can be fulfilled for both pre and post sale. You may send your customization requirements through email at info@strategymrc.com or call us on +1-301-202-5929.
We have 3 different licensing options available in electronic format.
- Single User Licence: Allows one person, typically the buyer, to have access to the ordered product. The ordered product cannot be distributed to anyone else.
- 2-5 User Licence: Allows the ordered product to be shared among a maximum of 5 people within your organisation.
- Corporate License: Allows the product to be shared among all employees of your organisation regardless of their geographical location.
All our reports are typically be emailed to you as an attachment.
To order any available report you need to register on our website. The payment can be made either through CCAvenue or PayPal payments gateways which accept all international cards.
We extend our support to 6 months post sale. A post sale customization is also provided to cover your unmet needs in the report.
Request Customization
We offer complimentary customization of up to 15% with every purchase. To share your customization requirements, feel free to email us at info@strategymrc.com or call us on +1-301-202-5929. .
Please Note: Customization within the 15% threshold is entirely free of charge. If your request exceeds this limit, we will conduct a feasibility assessment. Following that, a detailed quote and timeline will be provided.
WHY CHOOSE US ?

Assured Quality
Best in class reports with high standard of research integrity

24X7 Research Support
Continuous support to ensure the best customer experience.

Free Customization
Adding more values to your product of interest.

Safe & Secure Access
Providing a secured environment for all online transactions.

Trusted by 600+ Brands
Serving the most reputed brands across the world.