
Computed Tomography Market
Computed Tomography Market Forecasts to 2030 - Global Analysis By Modality (O-arms and C-arms), Technology (Low Slice (<64 Slices), Mid Slice (64 Slices), High Slice (>64 Slice) and Cone Beam Computed Tomography (CBCT)), Application, End User and By Geography

|
Years Covered |
2021-2030 |
|
Estimated Year Value (2023) |
US $8.82 BN |
|
Projected Year Value (2030) |
US $15.24 BN |
|
CAGR (2023 - 2030) |
8.1% |
|
Regions Covered |
North America, Europe, Asia Pacific, South America, and Middle East & Africa |
|
Countries Covered |
US, Canada, Mexico, Germany, UK, Italy, France, Spain, Japan, China, India, Australia, New Zealand, South Korea, Rest of Asia Pacific, South America, Argentina, Brazil, Chile, Middle East & Africa, Saudi Arabia, UAE, Qatar, and South Africa |
|
Largest Market |
Asia Pacific |
|
Highest Growing Market |
North America |
According to Stratistics MRC, the Global Computed Tomography Market is accounted for $8.82 billion in 2023 and is expected to reach $15.24 billion by 2030 growing at a CAGR of 8.1% during the forecast period. Computed Tomography is a medical imaging technology fine-grained cross-sectional pictures of the internal organs, blood arteries, bones, and soft tissues of the body. Compared to traditional X-ray imaging, it offers a more thorough perspective. CT scans are frequently used by surgeons to plan and direct difficult surgeries. It is most useful in emergency settings assessing the severity of injuries from mishaps or stressful occurrences.
According to Organization for Economic Co-operation and Development (OECD) statistics in 2021, around 84.5 million computed tomography scans were performed in U.S. in 2021.
Market Dynamics:
Driver:
Rising incidence of chronic diseases
Accurate diagnosis and continuous monitoring are frequently required for chronic disorders. Many chronic problems, such as cancer, cardiovascular diseases, respiratory disorders, and neurological issues, may only be diagnosed and monitored with the use of CT scans. The frequency and necessity of medical imaging, particularly cutting-edge modalities like CT scans, is rising in response to the rising prevalence of chronic illnesses. The market is expanding as a result of the increased demand for more advanced imaging technologies, such as high-resolution CT scans with complex image reconstruction and post-processing capabilities.
Restraint:
High initial investment & maintenance costs
The high initial investment required to purchase and install a CT machine can be a substantial barrier to entry for smaller healthcare facilities, especially in economically disadvantaged areas. The constant upkeep and service of CT devices can be expensive in addition to the initial expenditure. This covers costs for regular calibrations, hardware repairs, and software upgrades. These factors have an effect on how innovative and competitive the CT market is. Further impeding the market's expansion are worries about technological obsolescence and limited reimbursements.
Opportunity:
Increasing demand for point-of-care imaging
Point-of-care imaging brings CT scans closer to where patients are located, such as in emergency departments, intensive care units, and critical care settings. It can provide immediate imaging results, allowing healthcare providers to make quicker and more informed decisions about patient care. It improves patient outcomes and reduces patient transfers. It also enhances patient experience by reducing waiting times. This expands the potential market for CT scanners beyond traditional radiology departments.
Threat:
Radiation exposure concerns
The perception of radiation risk, even if not supported by scientific evidence, can influence patient preferences and clinician decision-making. Some patients may be hesitant to undergo CT scans due to concerns about radiation. Lowering radiation dose often requires longer scan times to maintain image quality. This can affect throughput in busy radiology departments, potentially reducing the number of scans that can be performed in a given time period. Therefore, this concern hinders the market demand.
Covid-19 Impact
The COVID-19 pandemic had a significant impact on the healthcare industry. During the initial stages of the pandemic, CT scans played a crucial role in diagnosing and monitoring COVID-19 cases. Portable or mobile CT scanners gained importance during the pandemic. Also, the pandemic accelerated the adoption of telemedicine and teleradiology services. Companies in the CT scanner market focused on developing advanced features like AI-powered image analysis, improved infection control measures, and dose optimization. Thereby, the epidemic raised the investments in Computed Tomography Market.
The high slice (>64 slice) segment is expected to be the largest during the forecast period
The high slice (>64 slice) segment is estimated to have a lucrative growth. A high-slice CT scanner helps reduce scan time, increase patient throughput, reduce radiation doses, and offer images with more detail and fewer artifacts. It is also preferred for advanced imaging, like in cardiovascular exams. High-slice CT is also quicker as no film images need to be developed. Also, it provides improved resolution, improved patient comfort & safety and reduces motion artifacts & contrast dose. Thus, the advantages of high-slice CT scanners may boost the market’s growth.
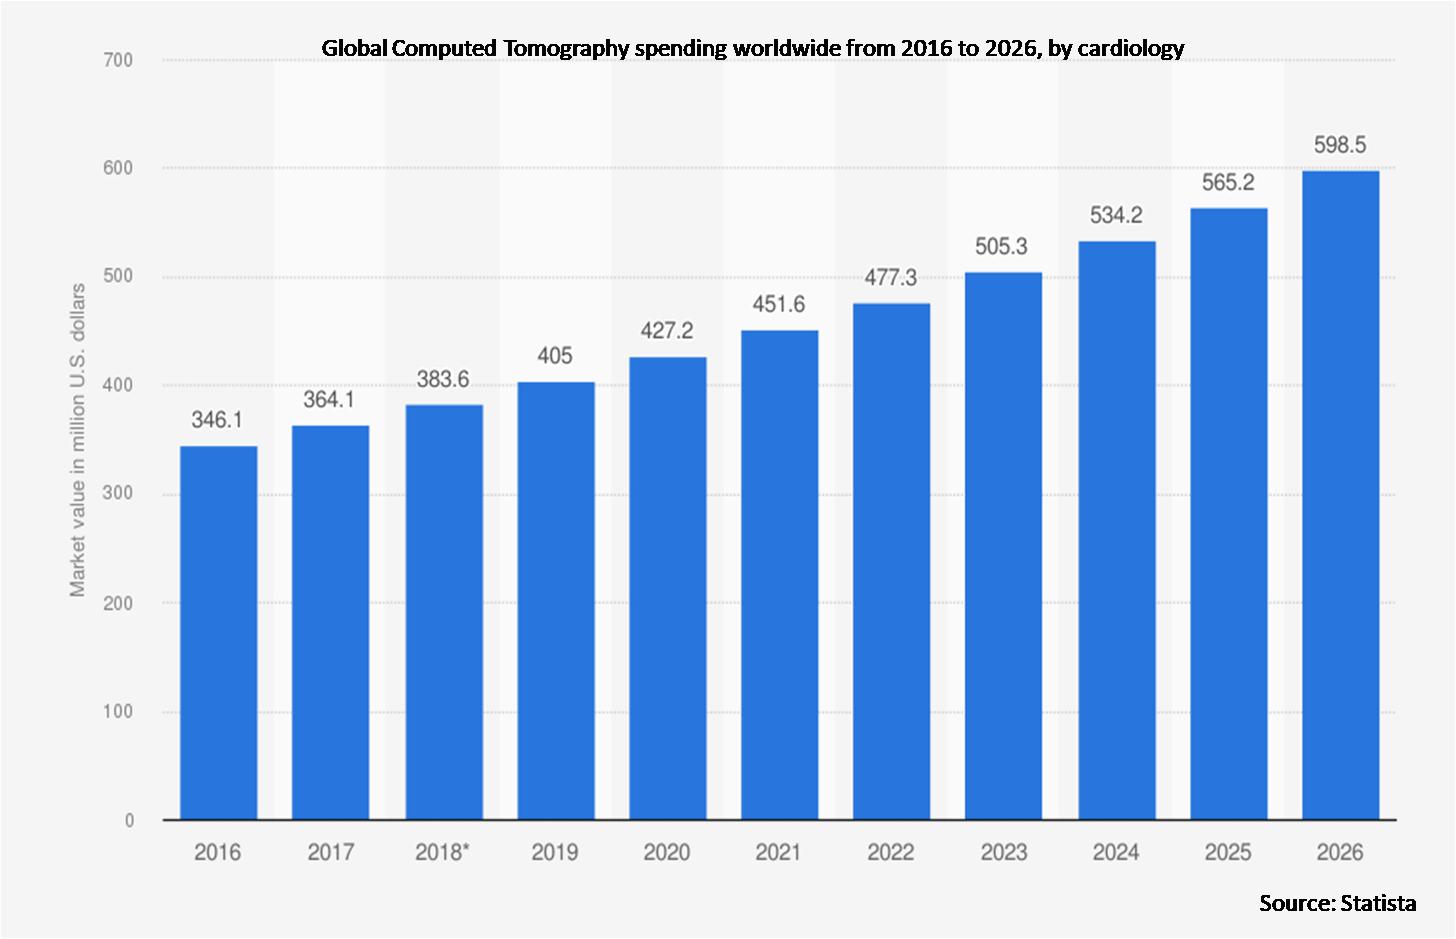
The cardiology segment is expected to have the highest CAGR during the forecast period
The cardiology segment is anticipated to witness the highest CAGR growth during the forecast period, due to its detailed imaging of the heart and blood vessels. CT in cardiology provides detailed anatomical information that is crucial for diagnosis, treatment planning, and follow-up care. It is especially valuable for patients who may not be candidates for invasive procedures or for those who need precise anatomical information prior to surgery or intervention. Its evaluations, assessments and guidance for structural interventions boost the segment demand.
Region with largest share:
Asia Pacific is projected to hold the largest market share during the forecast period owing to the growing aging population and rising healthcare expenditure. Many countries in the region have been experiencing economic growth, leading to greater investments in advanced medical imaging technologies. Countries like Singapore, Thailand, and Malaysia have become medical tourism hubs in the region. Also, the adoption of advanced CT technologies, such as multi-slice and dual-energy CT scanners, has been growing in the region. Further, the rising prevalence of chronic diseases and increasing medical imaging companies are fuelling the market growth in the region.
Region with highest CAGR:
North America is projected to have the highest CAGR over the forecast period. The United States has one of the largest and most advanced medical imaging markets in the world. Major global players like Siemens Healthineers, GE Healthcare, Philips Healthcare, Toshiba Medical Systems and Hitachi, have a strong presence in North America. The market for CT scanners and related technologies has been experiencing steady growth, driven by factors like an aging population, increasing prevalence of chronic diseases, and technological advancements in the region.

Key players in the market
Some of the key players profiled in the Computed Tomography Market include Siemens Healthineers, Carestream Health, Canon Medical Systems Corporation, Koninklijke Philips NV, Fujifilm Holdings Corporation, Stryker Corporation, GE Healthcare, Neusoft Medical Systems Co. Ltd, Shimadzu Corporation, Planmeca Group (Planmed OY), Koning Corporation, Toshiba Corporation, Hitachi Limited, Samsung Electronics Co Limited, Medtronic PLC, Accuray Incorporated, Pointnix Limited, Epica Medical Innovations, Imaging Sciences International LLC and Genoray Co Limited.
Key Developments:
In May 2023, Royal Philips, a global leader in health technology, announced the launch of the Philips CT 3500, a new high-throughput CT system targeting the needs of routine radiology and high-volume screening programs.
In March 2023, Canon Medical announced the launch of the new 80/160-slice computed tomography scanner Aquilion Serve at the European Congress of Radiology (ECR), which allows simultaneous previews of axial, lateral and AP views
In April 2022, Medtronic announced two AccuRhythm™ AI algorithms that will be applied to LINQ II™ insertable cardiac monitors (ICM) through cloud-based updates in Europe later this spring. AccuRhythm AI applies artificial intelligence (AI) to heart rhythm event data collected by LINQ II, improving the accuracy of information physicians receive so they can better diagnose and treat abnormal heart rhythms.
Modalities Covered:
• O-arms
• C-arms
Technologies Covered:
• Low Slice (<64 Slices)
• Mid Slice (64 Slices)
• High Slice (>64 Slice)
• Cone Beam Computed Tomography (CBCT)
Applications Covered:
• Neurology
• Orthopaedics
• Oncology
• Cardiology
• Other Applications
End Users Covered:
• Hospitals
• Diagnostic Imaging Centers
• Ambulatory Surgical Centers (ASCs)
• Other End Users
Regions Covered:
• North America
o US
o Canada
o Mexico
• Europe
o Germany
o UK
o Italy
o France
o Spain
o Rest of Europe
• Asia Pacific
o Japan
o China
o India
o Australia
o New Zealand
o South Korea
o Rest of Asia Pacific
• South America
o Argentina
o Brazil
o Chile
o Rest of South America
• Middle East & Africa
o Saudi Arabia
o UAE
o Qatar
o South Africa
o Rest of Middle East & Africa
What our report offers:
- Market share assessments for the regional and country-level segments
- Strategic recommendations for the new entrants
- Covers Market data for the years 2021, 2022, 2023, 2026, and 2030
- Market Trends (Drivers, Constraints, Opportunities, Threats, Challenges, Investment Opportunities, and recommendations)
- Strategic recommendations in key business segments based on the market estimations
- Competitive landscaping mapping the key common trends
- Company profiling with detailed strategies, financials, and recent developments
- Supply chain trends mapping the latest technological advancements
Free Customization Offerings:
All the customers of this report will be entitled to receive one of the following free customization options:
• Company Profiling
o Comprehensive profiling of additional market players (up to 3)
o SWOT Analysis of key players (up to 3)
• Regional Segmentation
o Market estimations, Forecasts and CAGR of any prominent country as per the client's interest (Note: Depends on feasibility check)
• Competitive Benchmarking
o Benchmarking of key players based on product portfolio, geographical presence, and strategic alliances
Table of Contents
1 Executive Summary
2 Preface
2.1 Abstract
2.2 Stake Holders
2.3 Research Scope
2.4 Research Methodology
2.4.1 Data Mining
2.4.2 Data Analysis
2.4.3 Data Validation
2.4.4 Research Approach
2.5 Research Sources
2.5.1 Primary Research Sources
2.5.2 Secondary Research Sources
2.5.3 Assumptions
3 Market Trend Analysis
3.1 Introduction
3.2 Drivers
3.3 Restraints
3.4 Opportunities
3.5 Threats
3.6 Technology Analysis
3.7 Application Analysis
3.8 End User Analysis
3.9 Emerging Markets
3.10 Impact of Covid-19
4 Porters Five Force Analysis
4.1 Bargaining power of suppliers
4.2 Bargaining power of buyers
4.3 Threat of substitutes
4.4 Threat of new entrants
4.5 Competitive rivalry
5 Global Computed Tomography Market, By Modality
5.1 Introduction
5.2 O-arms
5.3 C-arms
6 Global Computed Tomography Market, By Technology
6.1 Introduction
6.2 Low Slice (<64 Slices)
6.3 Mid Slice (64 Slices)
6.4 High Slice (>64 Slice)
6.5 Cone Beam Computed Tomography (CBCT)
7 Global Computed Tomography Market, By Application
7.1 Introduction
7.2 Neurology
7.3 Orthopaedics
7.4 Oncology
7.5 Cardiology
7.6 Other Applications
8 Global Computed Tomography Market, By End User
8.1 Introduction
8.2 Hospitals
8.3 Diagnostic Imaging Centers
8.4 Ambulatory Surgical Centers (ASCs)
8.5 Other End Users
9 Global Computed Tomography Market, By Geography
9.1 Introduction
9.2 North America
9.2.1 US
9.2.2 Canada
9.2.3 Mexico
9.3 Europe
9.3.1 Germany
9.3.2 UK
9.3.3 Italy
9.3.4 France
9.3.5 Spain
9.3.6 Rest of Europe
9.4 Asia Pacific
9.4.1 Japan
9.4.2 China
9.4.3 India
9.4.4 Australia
9.4.5 New Zealand
9.4.6 South Korea
9.4.7 Rest of Asia Pacific
9.5 South America
9.5.1 Argentina
9.5.2 Brazil
9.5.3 Chile
9.5.4 Rest of South America
9.6 Middle East & Africa
9.6.1 Saudi Arabia
9.6.2 UAE
9.6.3 Qatar
9.6.4 South Africa
9.6.5 Rest of Middle East & Africa
10 Key Developments
10.1 Agreements, Partnerships, Collaborations and Joint Ventures
10.2 Acquisitions & Mergers
10.3 New Product Launch
10.4 Expansions
10.5 Other Key Strategies
11 Company Profiling
11.1 Siemens Healthineers
11.2 Carestream Health
11.3 Canon Medical Systems Corporation
11.4 Koninklijke Philips NV
11.5 Fujifilm Holdings Corporation
11.6 Stryker Corporation
11.7 GE Healthcare
11.8 Neusoft Medical Systems Co. Ltd
11.9 Shimadzu Corporation
11.10 Planmeca Group (Planmed OY)
11.11 Koning Corporation
11.12 Toshiba Corporation
11.13 Hitachi Limited
11.14 Samsung Electronics Co Limited
11.15 Medtronic PLC
11.16 Accuray Incorporated
11.17 Pointnix Limited
11.18 Epica Medical Innovations
11.19 Imaging Sciences International LLC
11.20 Genoray Co Limited
List of Tables
1 Global Computed Tomography Market Outlook, By Region (2021-2030) ($MN)
2 Global Computed Tomography Market Outlook, By Modality (2021-2030) ($MN)
3 Global Computed Tomography Market Outlook, By O-arms (2021-2030) ($MN)
4 Global Computed Tomography Market Outlook, By C-arms (2021-2030) ($MN)
5 Global Computed Tomography Market Outlook, By Technology (2021-2030) ($MN)
6 Global Computed Tomography Market Outlook, By Low Slice (<64 Slices) (2021-2030) ($MN)
7 Global Computed Tomography Market Outlook, By Mid Slice (64 Slices) (2021-2030) ($MN)
8 Global Computed Tomography Market Outlook, By High Slice (>64 Slice) (2021-2030) ($MN)
9 Global Computed Tomography Market Outlook, By Cone Beam Computed Tomography (CBCT) (2021-2030) ($MN)
10 Global Computed Tomography Market Outlook, By Application (2021-2030) ($MN)
11 Global Computed Tomography Market Outlook, By Neurology (2021-2030) ($MN)
12 Global Computed Tomography Market Outlook, By Orthopaedics (2021-2030) ($MN)
13 Global Computed Tomography Market Outlook, By Oncology (2021-2030) ($MN)
14 Global Computed Tomography Market Outlook, By Cardiology (2021-2030) ($MN)
15 Global Computed Tomography Market Outlook, By Other Applications (2021-2030) ($MN)
16 Global Computed Tomography Market Outlook, By End User (2021-2030) ($MN)
17 Global Computed Tomography Market Outlook, By Hospitals (2021-2030) ($MN)
18 Global Computed Tomography Market Outlook, By Diagnostic Imaging Centers (2021-2030) ($MN)
19 Global Computed Tomography Market Outlook, By Ambulatory Surgical Centers (ASCs) (2021-2030) ($MN)
20 Global Computed Tomography Market Outlook, By Other End Users (2021-2030) ($MN)
21 North America Computed Tomography Market Outlook, By Country (2021-2030) ($MN)
22 North America Computed Tomography Market Outlook, By Modality (2021-2030) ($MN)
23 North America Computed Tomography Market Outlook, By O-arms (2021-2030) ($MN)
24 North America Computed Tomography Market Outlook, By C-arms (2021-2030) ($MN)
25 North America Computed Tomography Market Outlook, By Technology (2021-2030) ($MN)
26 North America Computed Tomography Market Outlook, By Low Slice (<64 Slices) (2021-2030) ($MN)
27 North America Computed Tomography Market Outlook, By Mid Slice (64 Slices) (2021-2030) ($MN)
28 North America Computed Tomography Market Outlook, By High Slice (>64 Slice) (2021-2030) ($MN)
29 North America Computed Tomography Market Outlook, By Cone Beam Computed Tomography (CBCT) (2021-2030) ($MN)
30 North America Computed Tomography Market Outlook, By Application (2021-2030) ($MN)
31 North America Computed Tomography Market Outlook, By Neurology (2021-2030) ($MN)
32 North America Computed Tomography Market Outlook, By Orthopaedics (2021-2030) ($MN)
33 North America Computed Tomography Market Outlook, By Oncology (2021-2030) ($MN)
34 North America Computed Tomography Market Outlook, By Cardiology (2021-2030) ($MN)
35 North America Computed Tomography Market Outlook, By Other Applications (2021-2030) ($MN)
36 North America Computed Tomography Market Outlook, By End User (2021-2030) ($MN)
37 North America Computed Tomography Market Outlook, By Hospitals (2021-2030) ($MN)
38 North America Computed Tomography Market Outlook, By Diagnostic Imaging Centers (2021-2030) ($MN)
39 North America Computed Tomography Market Outlook, By Ambulatory Surgical Centers (ASCs) (2021-2030) ($MN)
40 North America Computed Tomography Market Outlook, By Other End Users (2021-2030) ($MN)
41 Europe Computed Tomography Market Outlook, By Country (2021-2030) ($MN)
42 Europe Computed Tomography Market Outlook, By Modality (2021-2030) ($MN)
43 Europe Computed Tomography Market Outlook, By O-arms (2021-2030) ($MN)
44 Europe Computed Tomography Market Outlook, By C-arms (2021-2030) ($MN)
45 Europe Computed Tomography Market Outlook, By Technology (2021-2030) ($MN)
46 Europe Computed Tomography Market Outlook, By Low Slice (<64 Slices) (2021-2030) ($MN)
47 Europe Computed Tomography Market Outlook, By Mid Slice (64 Slices) (2021-2030) ($MN)
48 Europe Computed Tomography Market Outlook, By High Slice (>64 Slice) (2021-2030) ($MN)
49 Europe Computed Tomography Market Outlook, By Cone Beam Computed Tomography (CBCT) (2021-2030) ($MN)
50 Europe Computed Tomography Market Outlook, By Application (2021-2030) ($MN)
51 Europe Computed Tomography Market Outlook, By Neurology (2021-2030) ($MN)
52 Europe Computed Tomography Market Outlook, By Orthopaedics (2021-2030) ($MN)
53 Europe Computed Tomography Market Outlook, By Oncology (2021-2030) ($MN)
54 Europe Computed Tomography Market Outlook, By Cardiology (2021-2030) ($MN)
55 Europe Computed Tomography Market Outlook, By Other Applications (2021-2030) ($MN)
56 Europe Computed Tomography Market Outlook, By End User (2021-2030) ($MN)
57 Europe Computed Tomography Market Outlook, By Hospitals (2021-2030) ($MN)
58 Europe Computed Tomography Market Outlook, By Diagnostic Imaging Centers (2021-2030) ($MN)
59 Europe Computed Tomography Market Outlook, By Ambulatory Surgical Centers (ASCs) (2021-2030) ($MN)
60 Europe Computed Tomography Market Outlook, By Other End Users (2021-2030) ($MN)
61 Asia Pacific Computed Tomography Market Outlook, By Country (2021-2030) ($MN)
62 Asia Pacific Computed Tomography Market Outlook, By Modality (2021-2030) ($MN)
63 Asia Pacific Computed Tomography Market Outlook, By O-arms (2021-2030) ($MN)
64 Asia Pacific Computed Tomography Market Outlook, By C-arms (2021-2030) ($MN)
65 Asia Pacific Computed Tomography Market Outlook, By Technology (2021-2030) ($MN)
66 Asia Pacific Computed Tomography Market Outlook, By Low Slice (<64 Slices) (2021-2030) ($MN)
67 Asia Pacific Computed Tomography Market Outlook, By Mid Slice (64 Slices) (2021-2030) ($MN)
68 Asia Pacific Computed Tomography Market Outlook, By High Slice (>64 Slice) (2021-2030) ($MN)
69 Asia Pacific Computed Tomography Market Outlook, By Cone Beam Computed Tomography (CBCT) (2021-2030) ($MN)
70 Asia Pacific Computed Tomography Market Outlook, By Application (2021-2030) ($MN)
71 Asia Pacific Computed Tomography Market Outlook, By Neurology (2021-2030) ($MN)
72 Asia Pacific Computed Tomography Market Outlook, By Orthopaedics (2021-2030) ($MN)
73 Asia Pacific Computed Tomography Market Outlook, By Oncology (2021-2030) ($MN)
74 Asia Pacific Computed Tomography Market Outlook, By Cardiology (2021-2030) ($MN)
75 Asia Pacific Computed Tomography Market Outlook, By Other Applications (2021-2030) ($MN)
76 Asia Pacific Computed Tomography Market Outlook, By End User (2021-2030) ($MN)
77 Asia Pacific Computed Tomography Market Outlook, By Hospitals (2021-2030) ($MN)
78 Asia Pacific Computed Tomography Market Outlook, By Diagnostic Imaging Centers (2021-2030) ($MN)
79 Asia Pacific Computed Tomography Market Outlook, By Ambulatory Surgical Centers (ASCs) (2021-2030) ($MN)
80 Asia Pacific Computed Tomography Market Outlook, By Other End Users (2021-2030) ($MN)
81 South America Computed Tomography Market Outlook, By Country (2021-2030) ($MN)
82 South America Computed Tomography Market Outlook, By Modality (2021-2030) ($MN)
83 South America Computed Tomography Market Outlook, By O-arms (2021-2030) ($MN)
84 South America Computed Tomography Market Outlook, By C-arms (2021-2030) ($MN)
85 South America Computed Tomography Market Outlook, By Technology (2021-2030) ($MN)
86 South America Computed Tomography Market Outlook, By Low Slice (<64 Slices) (2021-2030) ($MN)
87 South America Computed Tomography Market Outlook, By Mid Slice (64 Slices) (2021-2030) ($MN)
88 South America Computed Tomography Market Outlook, By High Slice (>64 Slice) (2021-2030) ($MN)
89 South America Computed Tomography Market Outlook, By Cone Beam Computed Tomography (CBCT) (2021-2030) ($MN)
90 South America Computed Tomography Market Outlook, By Application (2021-2030) ($MN)
91 South America Computed Tomography Market Outlook, By Neurology (2021-2030) ($MN)
92 South America Computed Tomography Market Outlook, By Orthopaedics (2021-2030) ($MN)
93 South America Computed Tomography Market Outlook, By Oncology (2021-2030) ($MN)
94 South America Computed Tomography Market Outlook, By Cardiology (2021-2030) ($MN)
95 South America Computed Tomography Market Outlook, By Other Applications (2021-2030) ($MN)
96 South America Computed Tomography Market Outlook, By End User (2021-2030) ($MN)
97 South America Computed Tomography Market Outlook, By Hospitals (2021-2030) ($MN)
98 South America Computed Tomography Market Outlook, By Diagnostic Imaging Centers (2021-2030) ($MN)
99 South America Computed Tomography Market Outlook, By Ambulatory Surgical Centers (ASCs) (2021-2030) ($MN)
100 South America Computed Tomography Market Outlook, By Other End Users (2021-2030) ($MN)
101 Middle East & Africa Computed Tomography Market Outlook, By Country (2021-2030) ($MN)
102 Middle East & Africa Computed Tomography Market Outlook, By Modality (2021-2030) ($MN)
103 Middle East & Africa Computed Tomography Market Outlook, By O-arms (2021-2030) ($MN)
104 Middle East & Africa Computed Tomography Market Outlook, By C-arms (2021-2030) ($MN)
105 Middle East & Africa Computed Tomography Market Outlook, By Technology (2021-2030) ($MN)
106 Middle East & Africa Computed Tomography Market Outlook, By Low Slice (<64 Slices) (2021-2030) ($MN)
107 Middle East & Africa Computed Tomography Market Outlook, By Mid Slice (64 Slices) (2021-2030) ($MN)
108 Middle East & Africa Computed Tomography Market Outlook, By High Slice (>64 Slice) (2021-2030) ($MN)
109 Middle East & Africa Computed Tomography Market Outlook, By Cone Beam Computed Tomography (CBCT) (2021-2030) ($MN)
110 Middle East & Africa Computed Tomography Market Outlook, By Application (2021-2030) ($MN)
111 Middle East & Africa Computed Tomography Market Outlook, By Neurology (2021-2030) ($MN)
112 Middle East & Africa Computed Tomography Market Outlook, By Orthopaedics (2021-2030) ($MN)
113 Middle East & Africa Computed Tomography Market Outlook, By Oncology (2021-2030) ($MN)
114 Middle East & Africa Computed Tomography Market Outlook, By Cardiology (2021-2030) ($MN)
115 Middle East & Africa Computed Tomography Market Outlook, By Other Applications (2021-2030) ($MN)
116 Middle East & Africa Computed Tomography Market Outlook, By End User (2021-2030) ($MN)
117 Middle East & Africa Computed Tomography Market Outlook, By Hospitals (2021-2030) ($MN)
118 Middle East & Africa Computed Tomography Market Outlook, By Diagnostic Imaging Centers (2021-2030) ($MN)
119 Middle East & Africa Computed Tomography Market Outlook, By Ambulatory Surgical Centers (ASCs) (2021-2030) ($MN)
120 Middle East & Africa Computed Tomography Market Outlook, By Other End Users (2021-2030) ($MN)
List of Figures
List of Figures
Figure 1 Global Computed Tomography Market Outlook (2021-2030) ($MN)
Figure 2 North America Computed Tomography Market Outlook (2021-2030) ($MN)
Figure 3 US Computed Tomography Market Outlook (2021-2030) ($MN)
Figure 4 Canada Computed Tomography Market Outlook (2021-2030) ($MN)
Figure 5 Mexico Computed Tomography Market Outlook (2021-2030) ($MN)
Figure 6 Europe Computed Tomography Market Outlook (2021-2030) ($MN)
Figure 7 Germany Computed Tomography Market Outlook (2021-2030) ($MN)
Figure 8 UK Computed Tomography Market Outlook (2021-2030) ($MN)
Figure 9 Italy Computed Tomography Market Outlook (2021-2030) ($MN)
Figure 10 France Computed Tomography Market Outlook (2021-2030) ($MN)
Figure 11 Spain Computed Tomography Market Outlook (2021-2030) ($MN)
Figure 12 Rest of Europe Computed Tomography Market Outlook (2021-2030) ($MN)
Figure 13 Asia Pacific Computed Tomography Market Outlook (2021-2030) ($MN)
Figure 14 Japan Computed Tomography Market Outlook (2021-2030) ($MN)
Figure 15 China Computed Tomography Market Outlook (2021-2030) ($MN)
Figure 16 India Computed Tomography Market Outlook (2021-2030) ($MN)
Figure 17 Australia Computed Tomography Market Outlook (2021-2030) ($MN)
Figure 18 New Zealand Computed Tomography Market Outlook (2021-2030) ($MN)
Figure 19 South Korea Computed Tomography Market Outlook (2021-2030) ($MN)
Figure 20 Rest of Asia Pacific Computed Tomography Market Outlook (2021-2030) ($MN)
Figure 21 South America Computed Tomography Market Outlook (2021-2030) ($MN)
Figure 22 Argentina Computed Tomography Market Outlook (2021-2030) ($MN)
Figure 23 Brazil Computed Tomography Market Outlook (2021-2030) ($MN)
Figure 24 Chile Computed Tomography Market Outlook (2021-2030) ($MN)
Figure 25 Rest of South America Computed Tomography Market Outlook (2021-2030) ($MN)
Figure 26 Middle East & Africa Computed Tomography Market Outlook (2021-2030) ($MN)
Figure 27 Saudi Arabia Computed Tomography Market Outlook (2021-2030) ($MN)
Figure 28 UAE Computed Tomography Market Outlook (2021-2030) ($MN)
Figure 29 Qatar Computed Tomography Market Outlook (2021-2030) ($MN)
Figure 30 South Africa Computed Tomography Market Outlook (2021-2030) ($MN)
Figure 31 Rest of Middle East & Africa Computed Tomography Market Outlook (2021-2030) ($MN)
RESEARCH METHODOLOGY

We at ‘Stratistics’ opt for an extensive research approach which involves data mining, data validation, and data analysis. The various research sources include in-house repository, secondary research, competitor’s sources, social media research, client internal data, and primary research.
Our team of analysts prefers the most reliable and authenticated data sources in order to perform the comprehensive literature search. With access to most of the authenticated data bases our team highly considers the best mix of information through various sources to obtain extensive and accurate analysis.
Each report takes an average time of a month and a team of 4 industry analysts. The time may vary depending on the scope and data availability of the desired market report. The various parameters used in the market assessment are standardized in order to enhance the data accuracy.
Data Mining
The data is collected from several authenticated, reliable, paid and unpaid sources and is filtered depending on the scope & objective of the research. Our reports repository acts as an added advantage in this procedure. Data gathering from the raw material suppliers, distributors and the manufacturers is performed on a regular basis, this helps in the comprehensive understanding of the products value chain. Apart from the above mentioned sources the data is also collected from the industry consultants to ensure the objective of the study is in the right direction.
Market trends such as technological advancements, regulatory affairs, market dynamics (Drivers, Restraints, Opportunities and Challenges) are obtained from scientific journals, market related national & international associations and organizations.
Data Analysis
From the data that is collected depending on the scope & objective of the research the data is subjected for the analysis. The critical steps that we follow for the data analysis include:
- Product Lifecycle Analysis
- Competitor analysis
- Risk analysis
- Porters Analysis
- PESTEL Analysis
- SWOT Analysis
The data engineering is performed by the core industry experts considering both the Marketing Mix Modeling and the Demand Forecasting. The marketing mix modeling makes use of multiple-regression techniques to predict the optimal mix of marketing variables. Regression factor is based on a number of variables and how they relate to an outcome such as sales or profits.
Data Validation
The data validation is performed by the exhaustive primary research from the expert interviews. This includes telephonic interviews, focus groups, face to face interviews, and questionnaires to validate our research from all aspects. The industry experts we approach come from the leading firms, involved in the supply chain ranging from the suppliers, distributors to the manufacturers and consumers so as to ensure an unbiased analysis.
We are in touch with more than 15,000 industry experts with the right mix of consultants, CEO's, presidents, vice presidents, managers, experts from both supply side and demand side, executives and so on.
The data validation involves the primary research from the industry experts belonging to:
- Leading Companies
- Suppliers & Distributors
- Manufacturers
- Consumers
- Industry/Strategic Consultants
Apart from the data validation the primary research also helps in performing the fill gap research, i.e. providing solutions for the unmet needs of the research which helps in enhancing the reports quality.
For more details about research methodology, kindly write to us at info@strategymrc.com
Frequently Asked Questions
In case of any queries regarding this report, you can contact the customer service by filing the “Inquiry Before Buy” form available on the right hand side. You may also contact us through email: info@strategymrc.com or phone: +1-301-202-5929
Yes, the samples are available for all the published reports. You can request them by filling the “Request Sample” option available in this page.
Yes, you can request a sample with your specific requirements. All the customized samples will be provided as per the requirement with the real data masked.
All our reports are available in Digital PDF format. In case if you require them in any other formats, such as PPT, Excel etc you can submit a request through “Inquiry Before Buy” form available on the right hand side. You may also contact us through email: info@strategymrc.com or phone: +1-301-202-5929
We offer a free 15% customization with every purchase. This requirement can be fulfilled for both pre and post sale. You may send your customization requirements through email at info@strategymrc.com or call us on +1-301-202-5929.
We have 3 different licensing options available in electronic format.
- Single User Licence: Allows one person, typically the buyer, to have access to the ordered product. The ordered product cannot be distributed to anyone else.
- 2-5 User Licence: Allows the ordered product to be shared among a maximum of 5 people within your organisation.
- Corporate License: Allows the product to be shared among all employees of your organisation regardless of their geographical location.
All our reports are typically be emailed to you as an attachment.
To order any available report you need to register on our website. The payment can be made either through CCAvenue or PayPal payments gateways which accept all international cards.
We extend our support to 6 months post sale. A post sale customization is also provided to cover your unmet needs in the report.
Request Customization
We offer complimentary customization of up to 15% with every purchase. To share your customization requirements, feel free to email us at info@strategymrc.com or call us on +1-301-202-5929. .
Please Note: Customization within the 15% threshold is entirely free of charge. If your request exceeds this limit, we will conduct a feasibility assessment. Following that, a detailed quote and timeline will be provided.
WHY CHOOSE US ?

Assured Quality
Best in class reports with high standard of research integrity

24X7 Research Support
Continuous support to ensure the best customer experience.

Free Customization
Adding more values to your product of interest.

Safe & Secure Access
Providing a secured environment for all online transactions.

Trusted by 600+ Brands
Serving the most reputed brands across the world.