
Confectionery Packaging Market
Confectionery Packaging Market Forecasts to 2032 - Global Analysis By Product Type (Chocolate Confectionery, Sugar Confectionery, Gum and Other Product Types), Packaging Type (Flexible Packaging and Rigid Packaging), Material Type, Distribution Channel, End User and By Geography

|
Years Covered |
2024-2032 |
|
Estimated Year Value (2025) |
US $15.8 BN |
|
Projected Year Value (2030) |
US $24.8 BN |
|
CAGR (2025- 2032) |
6.6% |
|
Regions Covered |
North America, Europe, Asia Pacific, South America, and Middle East & Africa |
|
Countries Covered |
US, Canada, Mexico, Germany, UK, Italy, France, Spain, Japan, China, India, Australia, New Zealand, South Korea, Rest of Asia Pacific, South America, Argentina, Brazil, Chile, Middle East & Africa, Saudi Arabia, UAE, Qatar, and South Africa |
|
Largest Market |
Asia Pacific |
|
Highest Growing Market |
North America |
According to Stratistics MRC, the Global Confectionery Packaging Market is accounted for $15.8 billion in 2025 and is expected to reach $24.8 billion by 2032 growing at a CAGR of 6.6% during the forecast period. Confectionery packagings are the specialized wrapping and protection of sweet products to maintain their freshness, appeal, and safe transport. It employs materials such as plastic, foil, paper, and biodegradable alternatives to shield items from moisture, contamination, and external damage. Thoughtfully designed packaging enhances branding by attracting consumers through creative visuals and functional innovations. The industry is increasingly adopting sustainable materials, aligning with eco-friendly initiatives to reduce environmental impact. Beyond protection, confectionery packaging plays a vital role in consumer engagement and market competitiveness within the industry.

Market Dynamics:
Driver:
Growth in on-the-go consumption
Consumers, particularly those with busy lifestyles, seek easy-to-carry, resealable, and lightweight packaging for chocolates, candies, and other sweets. This trend has encouraged manufacturers to develop innovative formats that enhance product accessibility and shelf appeal. Additionally, growing urbanization and changing dietary habits are contributing to the expansion of single-serve packaging, allowing portion control and extended freshness.
Restraint:
Complex compliance processes
Adhering to global and regional guidelines mandates continuous investment in high-quality materials and testing procedures, adding to production costs. Packaging designs must comply with hygiene standards while maintaining product integrity, requiring specialized solutions. Additionally, restrictions on single-use plastics and non-biodegradable materials compel companies to seek alternatives, further complicating compliance efforts hampering the market growth.
Opportunity:
Advancements in smart packaging technologies
Smart packaging incorporates features such as freshness indicators, QR codes for traceability, and interactive elements that improve the buying experience. Temperature-sensitive packaging ensures optimal storage conditions, preventing spoilage while maintaining quality. Furthermore, brands are leveraging digital connectivity to offer personalized promotions and product insights through smart labels. Thus as technology continues to evolve, confectionery companies can integrate IoT-based solutions to enhance packaging functionalities.
Threat:
Intense market competition
Established brands and new entrants continually innovate to attract consumers, leading to price pressures and shifting market dynamics. Private-label brands are gaining traction, offering cost-effective alternatives that challenge premium packaging formats. Additionally, evolving consumer preferences demand constant adaptation, requiring companies to invest in research and development to stay ahead.
Covid-19 Impact:
The COVID-19 pandemic significantly influenced the confectionery packaging market, impacting supply chains, consumer behavior, and production efficiency. Lockdowns and restrictions led to increased demand for individually wrapped and hygienically packaged products, driving growth in single-serve and protective materials. Simultaneously, logistical disruptions affected the availability of raw materials, leading to supply shortages and delayed manufacturing schedules.
The chocolate confectionery segment is expected to be the largest during the forecast period
The chocolate confectionery segment is expected to account for the largest market share during the forecast period driven by its widespread global consumption and diverse packaging formats. Chocolates require specialized packaging to prevent melting, maintain texture, and preserve flavor, making advancements in protective materials crucial. Brands focus on visually appealing designs and premium packaging solutions to enhance product differentiation encouraging the development of innovative packaging techniques that support freshness and sustainability.
The flexible packaging segment is expected to have the highest CAGR during the forecast period
Over the forecast period, the flexible packaging segment is predicted to witness the highest growth rate Flexible packaging offers lightweight, cost-effective, and eco-friendly solutions that cater to various confectionery products. Its adaptability across multiple formats, including pouches, wrappers, and resealable packs, enhances convenience and consumer appeal. Growing sustainability concerns have prompted manufacturers to explore recyclable and compostable flexible materials, further fueling market expansion.
Region with largest share:
During the forecast period, the Asia Pacific region is expected to hold the largest market share owing to high confectionery consumption, rising disposable incomes, and expanding retail channels. Countries such as China, India, and Japan exhibit strong demand for diverse confectionery products, necessitating innovative packaging solutions. Additionally, rapid urbanization and changing consumer habits are driving investments in premium and functional packaging formats.
Region with highest CAGR:
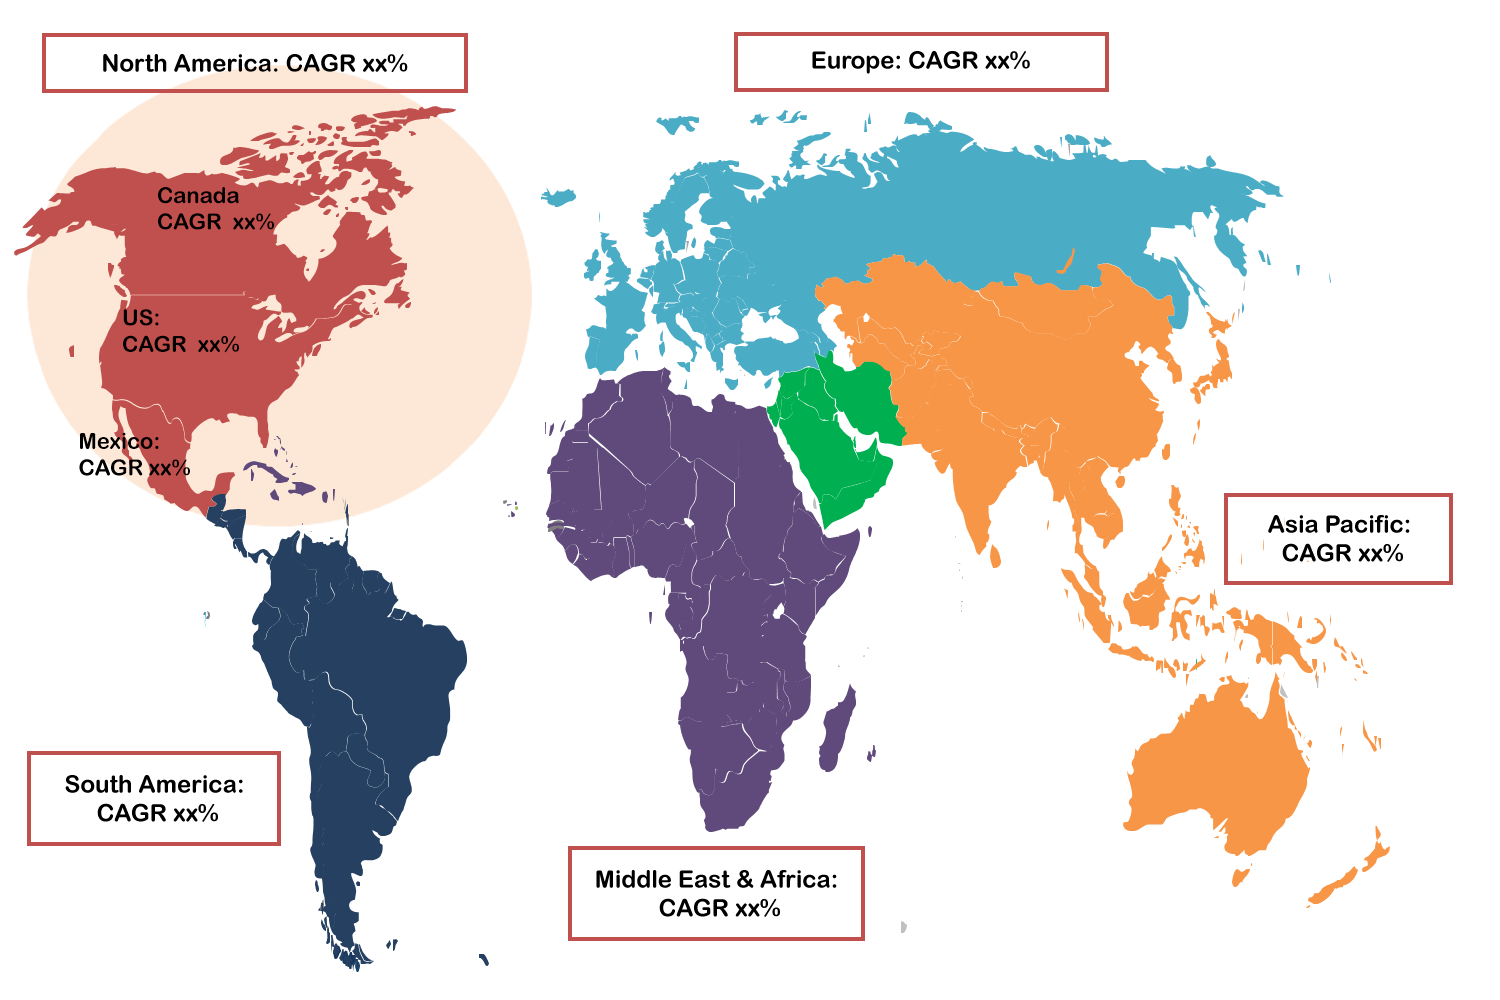
Over the forecast period, the North America region is anticipated to exhibit the highest CAGR fueled by technological advancements in packaging and growing preferences for sustainable solutions. Strong regulatory initiatives promoting eco-friendly packaging are shaping market trends, encouraging brands to develop biodegradable and recyclable formats. The region's established confectionery industry, combined with increasing demand for premium chocolates and specialty sweets, is accelerating growth in advanced packaging solutions.
Key players in the market
Some of the key players in Confectionery Packaging Market include Amcor PLC, Smurfit Kappa Group PLC, Coveris, Huhtamaki, Constantia Flexibles, Printpack, Toppan Holdings Inc., Berry Global Inc., Mondi Group, Sonoco Products Company, Solo Cup, Sweetheart Holdings, International Paper Company, Sealed Air Corporation, Bomarko Inc., and Stanpac Inc.
Key Developments:
In April 2025, Mondi Group announced the expansion of its containerboard portfolio to address the growing need for sustainable and high-performance packaging solutions. The move aims to support industries seeking eco-friendly alternatives without compromising on strength or efficiency.
In April 2025, Amcor announced plans to build a state-of-the-art coating facility aimed at enhancing its healthcare packaging capabilities in the Asia Pacific region. This facility will strengthen regional supply chains and support growing demand for high-quality, medical-grade packaging.
In January 2025, International Paper Companyonditionally approved its $7.16 billion acquisition of DS Smith, with commitments to divest five European corrugated box plants to satisfy regulatory requirements.
Product Types Covered:
• Chocolate Confectionery
• Sugar Confectionery
• Gum
• Other Product Types
Packaging Types Covered:
• Flexible Packaging
• Rigid Packaging
Material Types Covered:
• Plastic
• Paper & Paperboard
• Biodegradable Materials
• Metal
• Glass
Distribution Channels Covered:
• Online Retail
• Specialty Stores
• Supermarkets/Hypermarkets
• Convenience Stores
End Users Covered:
• Recyclable
• Conventional
• Compostable/Biodegradable
• Reusable
• Other End Users
Regions Covered:
• North America
o US
o Canada
o Mexico
• Europe
o Germany
o UK
o Italy
o France
o Spain
o Rest of Europe
• Asia Pacific
o Japan
o China
o India
o Australia
o New Zealand
o South Korea
o Rest of Asia Pacific
• South America
o Argentina
o Brazil
o Chile
o Rest of South America
• Middle East & Africa
o Saudi Arabia
o UAE
o Qatar
o South Africa
o Rest of Middle East & Africa
What our report offers:
- Market share assessments for the regional and country-level segments
- Strategic recommendations for the new entrants
- Covers Market data for the years 2024, 2025, 2026, 2028, and 2032
- Market Trends (Drivers, Constraints, Opportunities, Threats, Challenges, Investment Opportunities, and recommendations)
- Strategic recommendations in key business segments based on the market estimations
- Competitive landscaping mapping the key common trends
- Company profiling with detailed strategies, financials, and recent developments
- Supply chain trends mapping the latest technological advancements
Free Customization Offerings:
All the customers of this report will be entitled to receive one of the following free customization options:
• Company Profiling
o Comprehensive profiling of additional market players (up to 3)
o SWOT Analysis of key players (up to 3)
• Regional Segmentation
o Market estimations, Forecasts and CAGR of any prominent country as per the client's interest (Note: Depends on feasibility check)
• Competitive Benchmarking
o Benchmarking of key players based on product portfolio, geographical presence, and strategic alliances
Table of Contents
1 Executive Summary
2 Preface
2.1 Abstract
2.2 Stake Holders
2.3 Research Scope
2.4 Research Methodology
2.4.1 Data Mining
2.4.2 Data Analysis
2.4.3 Data Validation
2.4.4 Research Approach
2.5 Research Sources
2.5.1 Primary Research Sources
2.5.2 Secondary Research Sources
2.5.3 Assumptions
3 Market Trend Analysis
3.1 Introduction
3.2 Drivers
3.3 Restraints
3.4 Opportunities
3.5 Threats
3.6 Product Analysis
3.7 End User Analysis
3.8 Emerging Markets
3.9 Impact of Covid-19
4 Porters Five Force Analysis
4.1 Bargaining power of suppliers
4.2 Bargaining power of buyers
4.3 Threat of substitutes
4.4 Threat of new entrants
4.5 Competitive rivalry
5 Global Confectionery Packaging Market, By Product Type
5.1 Introduction
5.2 Chocolate Confectionery
5.2.1 Bars
5.2.2 Seasonal chocolate
5.2.3 Pralines
5.3 Sugar Confectionery
5.3.1 Gummies
5.3.2 Mints
5.3.3 Hard candy
5.3.4 Lollipops
5.4 Gum
5.4.1 Chewing gum
5.4.2 Bubble gum
5.5 Other Product Types
6 Global Confectionery Packaging Market, By Packaging Type
6.1 Introduction
6.2 Flexible Packaging
6.2.1 Wrappers
6.2.2 Foils
6.2.3 Sachets
6.2.4 Pouches
6.3 Rigid Packaging
6.3.1 Boxes
6.3.2 Tins
6.3.3 Trays
6.3.4 Blister packs
6.3.5 Jars
7 Global Confectionery Packaging Market, By Material Type
7.1 Introduction
7.2 Plastic
7.2.1 Polypropylene (PP)
7.2.2 Polystyrene (PS)
7.2.3 Polyethylene (PE)
7.2.4 Polyethylene Terephthalate (PET)
7.3 Paper & Paperboard
7.4 Biodegradable Materials
7.5 Metal
7.6 Glass
8 Global Confectionery Packaging Market, By Distribution Channel
8.1 Introduction
8.2 Online Retail
8.3 Specialty Stores
8.4 Supermarkets/Hypermarkets
8.5 Convenience Stores
9 Global Confectionery Packaging Market, By End User
9.1 Introduction
9.2 Recyclable
9.3 Conventional
9.4 Compostable/Biodegradable
9.5 Reusable
9.6 Other End Users
10 Global Confectionery Packaging Market, By Geography
10.1 Introduction
10.2 North America
10.2.1 US
10.2.2 Canada
10.2.3 Mexico
10.3 Europe
10.3.1 Germany
10.3.2 UK
10.3.3 Italy
10.3.4 France
10.3.5 Spain
10.3.6 Rest of Europe
10.4 Asia Pacific
10.4.1 Japan
10.4.2 China
10.4.3 India
10.4.4 Australia
10.4.5 New Zealand
10.4.6 South Korea
10.4.7 Rest of Asia Pacific
10.5 South America
10.5.1 Argentina
10.5.2 Brazil
10.5.3 Chile
10.5.4 Rest of South America
10.6 Middle East & Africa
10.6.1 Saudi Arabia
10.6.2 UAE
10.6.3 Qatar
10.6.4 South Africa
10.6.5 Rest of Middle East & Africa
11 Key Developments
11.1 Agreements, Partnerships, Collaborations and Joint Ventures
11.2 Acquisitions & Mergers
11.3 New Product Launch
11.4 Expansions
11.5 Other Key Strategies
12 Company Profiling
12.1 Amcor PLC
12.2 Smurfit Kappa Group PLC
12.3 Coveris
12.4 Huhtamaki
12.5 Constantia Flexibles
12.6 Printpack
12.7 Toppan Holdings Inc.
12.8 Berry Global Inc.
12.9 Mondi Group
12.10 Sonoco Products Company
12.11 Solo Cup
12.12 Sweetheart Holdings
12.13 International Paper Company
12.14 Sealed Air Corporation
12.15 Bomarko Inc.
12.16 Stanpac Inc.
List of Tables
1 Global Confectionery Packaging Market Outlook, By Region (2024-2032) ($MN)
2 Global Confectionery Packaging Market Outlook, By Product Type (2024-2032) ($MN)
3 Global Confectionery Packaging Market Outlook, By Chocolate Confectionery (2024-2032) ($MN)
4 Global Confectionery Packaging Market Outlook, By Bars (2024-2032) ($MN)
5 Global Confectionery Packaging Market Outlook, By Seasonal chocolate (2024-2032) ($MN)
6 Global Confectionery Packaging Market Outlook, By Pralines (2024-2032) ($MN)
7 Global Confectionery Packaging Market Outlook, By Sugar Confectionery (2024-2032) ($MN)
8 Global Confectionery Packaging Market Outlook, By Gummies (2024-2032) ($MN)
9 Global Confectionery Packaging Market Outlook, By Mints (2024-2032) ($MN)
10 Global Confectionery Packaging Market Outlook, By Hard candy (2024-2032) ($MN)
11 Global Confectionery Packaging Market Outlook, By Lollipops (2024-2032) ($MN)
12 Global Confectionery Packaging Market Outlook, By Gum (2024-2032) ($MN)
13 Global Confectionery Packaging Market Outlook, By Chewing gum (2024-2032) ($MN)
14 Global Confectionery Packaging Market Outlook, By Bubble gum (2024-2032) ($MN)
15 Global Confectionery Packaging Market Outlook, By Other Product Types (2024-2032) ($MN)
16 Global Confectionery Packaging Market Outlook, By Packaging Type (2024-2032) ($MN)
17 Global Confectionery Packaging Market Outlook, By Flexible Packaging (2024-2032) ($MN)
18 Global Confectionery Packaging Market Outlook, By Wrappers (2024-2032) ($MN)
19 Global Confectionery Packaging Market Outlook, By Foils (2024-2032) ($MN)
20 Global Confectionery Packaging Market Outlook, By Sachets (2024-2032) ($MN)
21 Global Confectionery Packaging Market Outlook, By Pouches (2024-2032) ($MN)
22 Global Confectionery Packaging Market Outlook, By Rigid Packaging (2024-2032) ($MN)
23 Global Confectionery Packaging Market Outlook, By Boxes (2024-2032) ($MN)
24 Global Confectionery Packaging Market Outlook, By Tins (2024-2032) ($MN)
25 Global Confectionery Packaging Market Outlook, By Trays (2024-2032) ($MN)
26 Global Confectionery Packaging Market Outlook, By Blister packs (2024-2032) ($MN)
27 Global Confectionery Packaging Market Outlook, By Jars (2024-2032) ($MN)
28 Global Confectionery Packaging Market Outlook, By Material Type (2024-2032) ($MN)
29 Global Confectionery Packaging Market Outlook, By Plastic (2024-2032) ($MN)
30 Global Confectionery Packaging Market Outlook, By Polypropylene (PP) (2024-2032) ($MN)
31 Global Confectionery Packaging Market Outlook, By Polystyrene (PS) (2024-2032) ($MN)
32 Global Confectionery Packaging Market Outlook, By Polyethylene (PE) (2024-2032) ($MN)
33 Global Confectionery Packaging Market Outlook, By Polyethylene Terephthalate (PET) (2024-2032) ($MN)
34 Global Confectionery Packaging Market Outlook, By Paper & Paperboard (2024-2032) ($MN)
35 Global Confectionery Packaging Market Outlook, By Biodegradable Materials (2024-2032) ($MN)
36 Global Confectionery Packaging Market Outlook, By Metal (2024-2032) ($MN)
37 Global Confectionery Packaging Market Outlook, By Glass (2024-2032) ($MN)
38 Global Confectionery Packaging Market Outlook, By Distribution Channel (2024-2032) ($MN)
39 Global Confectionery Packaging Market Outlook, By Online Retail (2024-2032) ($MN)
40 Global Confectionery Packaging Market Outlook, By Specialty Stores (2024-2032) ($MN)
41 Global Confectionery Packaging Market Outlook, By Supermarkets/Hypermarkets (2024-2032) ($MN)
42 Global Confectionery Packaging Market Outlook, By Convenience Stores (2024-2032) ($MN)
43 Global Confectionery Packaging Market Outlook, By End User (2024-2032) ($MN)
44 Global Confectionery Packaging Market Outlook, By Recyclable (2024-2032) ($MN)
45 Global Confectionery Packaging Market Outlook, By Conventional (2024-2032) ($MN)
46 Global Confectionery Packaging Market Outlook, By Compostable/Biodegradable (2024-2032) ($MN)
47 Global Confectionery Packaging Market Outlook, By Reusable (2024-2032) ($MN)
48 Global Confectionery Packaging Market Outlook, By Other End Users (2024-2032) ($MN)
Note: Tables for North America, Europe, APAC, South America, and Middle East & Africa Regions are also represented in the same manner as above.
List of Figures
RESEARCH METHODOLOGY

We at ‘Stratistics’ opt for an extensive research approach which involves data mining, data validation, and data analysis. The various research sources include in-house repository, secondary research, competitor’s sources, social media research, client internal data, and primary research.
Our team of analysts prefers the most reliable and authenticated data sources in order to perform the comprehensive literature search. With access to most of the authenticated data bases our team highly considers the best mix of information through various sources to obtain extensive and accurate analysis.
Each report takes an average time of a month and a team of 4 industry analysts. The time may vary depending on the scope and data availability of the desired market report. The various parameters used in the market assessment are standardized in order to enhance the data accuracy.
Data Mining
The data is collected from several authenticated, reliable, paid and unpaid sources and is filtered depending on the scope & objective of the research. Our reports repository acts as an added advantage in this procedure. Data gathering from the raw material suppliers, distributors and the manufacturers is performed on a regular basis, this helps in the comprehensive understanding of the products value chain. Apart from the above mentioned sources the data is also collected from the industry consultants to ensure the objective of the study is in the right direction.
Market trends such as technological advancements, regulatory affairs, market dynamics (Drivers, Restraints, Opportunities and Challenges) are obtained from scientific journals, market related national & international associations and organizations.
Data Analysis
From the data that is collected depending on the scope & objective of the research the data is subjected for the analysis. The critical steps that we follow for the data analysis include:
- Product Lifecycle Analysis
- Competitor analysis
- Risk analysis
- Porters Analysis
- PESTEL Analysis
- SWOT Analysis
The data engineering is performed by the core industry experts considering both the Marketing Mix Modeling and the Demand Forecasting. The marketing mix modeling makes use of multiple-regression techniques to predict the optimal mix of marketing variables. Regression factor is based on a number of variables and how they relate to an outcome such as sales or profits.
Data Validation
The data validation is performed by the exhaustive primary research from the expert interviews. This includes telephonic interviews, focus groups, face to face interviews, and questionnaires to validate our research from all aspects. The industry experts we approach come from the leading firms, involved in the supply chain ranging from the suppliers, distributors to the manufacturers and consumers so as to ensure an unbiased analysis.
We are in touch with more than 15,000 industry experts with the right mix of consultants, CEO's, presidents, vice presidents, managers, experts from both supply side and demand side, executives and so on.
The data validation involves the primary research from the industry experts belonging to:
- Leading Companies
- Suppliers & Distributors
- Manufacturers
- Consumers
- Industry/Strategic Consultants
Apart from the data validation the primary research also helps in performing the fill gap research, i.e. providing solutions for the unmet needs of the research which helps in enhancing the reports quality.
For more details about research methodology, kindly write to us at info@strategymrc.com
Frequently Asked Questions
In case of any queries regarding this report, you can contact the customer service by filing the “Inquiry Before Buy” form available on the right hand side. You may also contact us through email: info@strategymrc.com or phone: +1-301-202-5929
Yes, the samples are available for all the published reports. You can request them by filling the “Request Sample” option available in this page.
Yes, you can request a sample with your specific requirements. All the customized samples will be provided as per the requirement with the real data masked.
All our reports are available in Digital PDF format. In case if you require them in any other formats, such as PPT, Excel etc you can submit a request through “Inquiry Before Buy” form available on the right hand side. You may also contact us through email: info@strategymrc.com or phone: +1-301-202-5929
We offer a free 15% customization with every purchase. This requirement can be fulfilled for both pre and post sale. You may send your customization requirements through email at info@strategymrc.com or call us on +1-301-202-5929.
We have 3 different licensing options available in electronic format.
- Single User Licence: Allows one person, typically the buyer, to have access to the ordered product. The ordered product cannot be distributed to anyone else.
- 2-5 User Licence: Allows the ordered product to be shared among a maximum of 5 people within your organisation.
- Corporate License: Allows the product to be shared among all employees of your organisation regardless of their geographical location.
All our reports are typically be emailed to you as an attachment.
To order any available report you need to register on our website. The payment can be made either through CCAvenue or PayPal payments gateways which accept all international cards.
We extend our support to 6 months post sale. A post sale customization is also provided to cover your unmet needs in the report.
Request Customization
We offer complimentary customization of up to 15% with every purchase. To share your customization requirements, feel free to email us at info@strategymrc.com or call us on +1-301-202-5929. .
Please Note: Customization within the 15% threshold is entirely free of charge. If your request exceeds this limit, we will conduct a feasibility assessment. Following that, a detailed quote and timeline will be provided.
WHY CHOOSE US ?

Assured Quality
Best in class reports with high standard of research integrity

24X7 Research Support
Continuous support to ensure the best customer experience.

Free Customization
Adding more values to your product of interest.

Safe & Secure Access
Providing a secured environment for all online transactions.

Trusted by 600+ Brands
Serving the most reputed brands across the world.
