
Digital Tv Soc Market
Digital TV Soc Market Forecasts to 2030 - Global Analysis By Type (High-definition (HD) SoCs, Ultra-high-definition (UHD) SoCs, Smart TV SoCs, Hybrid TV SoCs and Other Types), Application (LCD(Liquid Crystal Display), LED(Light Emitting Diode), OLED(Organic Light Emitting Diodes), QLED(Quantum-dot Light Emitting Diode) and Other Applications), End User (Residential, Commercial, Television manufacturers, Set-top box manufacturers, System integrators, Content providers, Broadcasting companies and Other End Users) and By Geography

|
Years Covered |
2021-2030 |
|
Estimated Year Value (2023) |
US $11.33 BN |
|
Projected Year Value (2030) |
US $29.78 BN |
|
CAGR (2023 - 2030) |
14.8% |
|
Regions Covered |
North America, Europe, Asia Pacific, South America, and Middle East & Africa |
|
Countries Covered |
US, Canada, Mexico, Germany, UK, Italy, France, Spain, Japan, China, India, Australia, New Zealand, South Korea, Rest of Asia Pacific, South America, Argentina, Brazil, Chile, Middle East & Africa, Saudi Arabia, UAE, Qatar, and South Africa |
|
Largest Market |
Asia Pacific |
|
Highest Growing Market |
North America |
According to Stratistics MRC, the Global Digital TV Soc Market is accounted for $11.33 billion in 2023 and is expected to reach $29.78 billion by 2030 growing at a CAGR of 14.8% during the forecast period. Modern chips for digital TV devices, such as smart TVs, set-top boxes, and streaming media players, are made by a crucial sector of the economy called the digital TV SoC market. To create more sophisticated SoCs that can support the newest features and technologies, including high dynamic range (HDR), advanced codecs, and voice control, manufacturers make significant investments in research and development. Moreover, Intense competition dominates the market, which is anticipated to grow as a result of rising demand for digital TV equipment and services in emerging economies.
According to a recent press release by Broadcom, the demand for advanced digital TV devices and services is driving the growth of the digital TV SoC market. The company has invested heavily in research and development to develop more advanced SoCs that can support the latest features and technologies, including advanced codecs, 4K and 8K resolution, and high-speed connectivity
Market Dynamics:
Driver:
Demand for excellent video content is rising
The global Digital TV Soc market expected to drive growth during the forecast period. Consumer expectations for seamless streaming have increased in recent years, driving up demand for high-quality video content. The demand for sophisticated SoCs that can support intricate features and functionalities is being driven by this. These SoCs are made to deliver high-quality video content with the least amount of buffering and latency. Additionally, they support cutting-edge video codecs like AV1 and H.265/HEVC, which allow for high-quality video streaming even at very low bitrates.
Restraint:
High cost of development
The global Digital TV Soc market expected to hinder growth during the forecast period. The design and fabrication of the chip itself, as well as significant investment in research and development, are all necessary to create advanced digital TV SoCs. For smaller businesses that lack the resources to compete with bigger players in the market, this can be a significant barrier. Additionally, the high development costs may lead to higher prices for digital TV SoCs, which may limit their uptake in markets with limited purchasing power.
Opportunity:
Advancements in semiconductor manufacturing technology
The global Digital TV Soc market expected to drive growth during the forecast period. More advanced SoCs for the digital TV market are being developed as a result of technological developments in semiconductor manufacturing, such as the creation of FinFET and multi-die packaging technologies. More transistors and components can be integrated using these technologies onto a single chip, increasing performance and enabling more sophisticated features. For instance, compared to conventional planar CMOS technology, FinFET technology enables lower power consumption and higher performance.
Threat:
Competition from substitute technologies
The global Digital TV Soc market expected to hamper growth during the forecast period. Alternative technologies, including streaming media players and smart TVs with integrated SoCs, compete with the digital TV SoC market. The widespread adoption of these technologies could impede the market expansion for digital TV SoCs, even though they might provide features and functionalities that are comparable to those of digital TV SoCs. Furthermore, the fact that these technologies are more affordable may appeal to consumers who are concerned about costs.
Covid-19 Impact:
The COVID-19 pandemic has affected the digital TV SoC market in both positive and negative ways. On the one hand, people are spending more time at home as a result of the pandemic, which has increased demand for digital TV equipment. As a result, demand for digital TV SoCs has increased. On the other hand, the pandemic has hampered supply chains, increased market competition, and brought about economic uncertainty. Key component shortages and shipment delays are causing manufacturers problems, and consumers are switching to less expensive devices. Despite these difficulties, the pandemic has also encouraged increased spending on R&D to create more sophisticated SoCs that can support cutting-edge features and technologies.
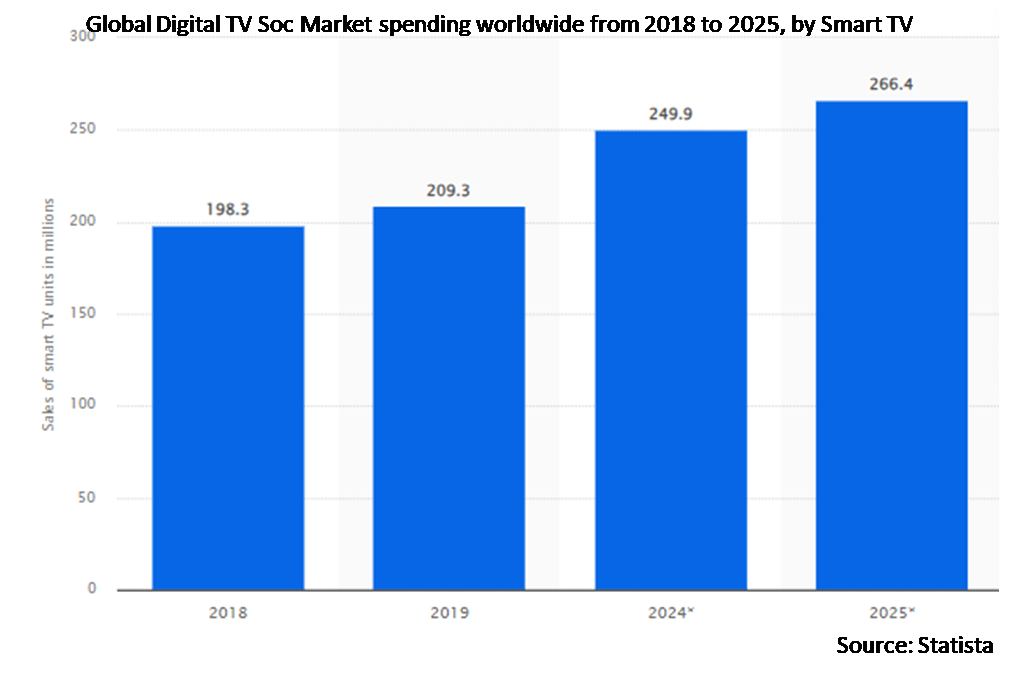
The smart TV segment is expected to be the largest during the forecast period
The digital TV SoC (System-on-a-Chip) market has the largest share of the smart TV segment during the forecast period. Smart TVs are digital TVs with integrated internet connectivity and sophisticated software that let users access a range of online content and services, such as streaming video, music, and games. Due to their convenience and adaptability, smart TVs are growing in popularity, and manufacturers are making more sophisticated digital TV SoCs that can support these features. In the upcoming years, manufacturers will concentrate on developing more sophisticated chips that can support the newest features and technologies, as the demand for smart TVs is expected to continue to drive the growth of the digital TV SoC market.
The Set-top box manufacturers segment is expected to have the highest CAGR during the forecast period
The Set-top box manufacturers segment is anticipated to witness the fastest CAGR growth during the forecast period. The use of set-top boxes allows for the reception of digital TV signals and the conversion of those signals into a form that can be viewed on a TV. In order to provide their subscribers with digital TV content, cable and satellite TV providers use these devices. The STB market is anticipated to grow significantly over the next few years, especially in emerging markets where there is an increasing demand for digital TV services. The latest video codecs as well as cutting-edge features like voice control and artificial intelligence can all be supported by manufacturers' more sophisticated digital TV SoCs.
Region with largest share:
The region with the largest market share during the forecast period for digital TV SoCs is Asia Pacific (APAC). Several significant digital TV SoC producers, including MediaTek, MStar Semiconductor, and HiSilicon Technologies, are based in the area. Due to its sizable population and expanding middle class, the APAC region has seen an increase in demand for digital TV equipment and services. Additionally, the area has a digital infrastructure that is rapidly expanding, with more people having access to high-speed internet and digital content.
Region with highest CAGR:
The digital TV SoC (System-on-a-Chip) market in North America has the highest CAGR during the forecast period. This is brought on by the region's rising demand for cutting-edge digital TV products and services, as well as the presence of several significant SoC producers for digital TV, such as Qualcomm and Broadcom. A strong digital infrastructure with high-speed internet and widespread access to digital content is also present in the area. In the upcoming years, it is anticipated that the market for digital TV SoCs in North America will continue to expand due to the rising adoption of cutting-edge technologies like 4K and 8K resolution, HDR, and high-speed connectivity.

Key players in the market
Some of the key players in Digital TV Soc market include Amlogic, Apple, Inc., Broadcom, Inc., Intel Corporation, LG Electronics Inc., MediaTek Inc, Novatek Microelectronics, NXP Semiconductors N.V., Qualcomm Technologies, Inc., Realtek Semiconductor Corp., Samsung Electronics Co., Ltd., Sony Corporation, STMicroelectronics N.V., Taiwan Semiconductor Manufacturing Company Limited and Toshiba Corporation.
Key Developments:
In September 2022, Toshiba announced the release of two products. The N300 Pro and X300 Pro HDDs are excellent solutions for business owners and creative professionals, respectively, seeking a hard disk drive built for high performance and reliability. Both HDDs boast capacities of up to 18TB1 with workloads up to 300TB/year2 and come with a limited 5-year warranty.
In July 2022, Intel and MediaTek announced a strategic partnership to manufacture chips using Intel Foundry Services’ (IFS) advanced process technologies. The agreement was designed to help MediaTek build a more balanced, resilient supply chain through the addition of a new foundry partner with significant capacity in the United States and Europe.
In March 2022, MediaTek announced its TV SoC Dolby Vision IQ with Precision Detail. Precision Detail is a new innovative feature introduced for TVs with Dolby Vision IQ, which supports MediaTek’s Pentatonic series for 8K and 4K smart TVs.
Types Covered:
• High-definition (HD) SoCs
• Ultra-high-definition (UHD) SoCs
• Smart TV SoCs
• Hybrid TV SoCs
• Other Types
Applications Covered:
• LCD (Liquid Crystal Display)
• LED (Light Emitting Diode)
• OLED (Organic Light Emitting Diodes)
• QLED (Quantum-dot Light Emitting Diode)
• Other Applications
End Users Covered:
• Residential
• Commercial
• Television Manufacturers
• Set-Top Box Manufacturers
• System Integrators
• Content Providers
• Broadcasting Companies
• Other End Users
Regions Covered:
• North America
o US
o Canada
o Mexico
• Europe
o Germany
o UK
o Italy
o France
o Spain
o Rest of Europe
• Asia Pacific
o Japan
o China
o India
o Australia
o New Zealand
o South Korea
o Rest of Asia Pacific
• South America
o Argentina
o Brazil
o Chile
o Rest of South America
• Middle East & Africa
o Saudi Arabia
o UAE
o Qatar
o South Africa
o Rest of Middle East & Africa
What our report offers:
- Market share assessments for the regional and country-level segments
- Strategic recommendations for the new entrants
- Covers Market data for the years 2021, 2022, 2023, 2026, and 2030
- Market Trends (Drivers, Constraints, Opportunities, Threats, Challenges, Investment Opportunities, and recommendations)
- Strategic recommendations in key business segments based on the market estimations
- Competitive landscaping mapping the key common trends
- Company profiling with detailed strategies, financials, and recent developments
- Supply chain trends mapping the latest technological advancements
Free Customization Offerings:
All the customers of this report will be entitled to receive one of the following free customization options:
• Company Profiling
o Comprehensive profiling of additional market players (up to 3)
o SWOT Analysis of key players (up to 3)
• Regional Segmentation
o Market estimations, Forecasts and CAGR of any prominent country as per the client's interest (Note: Depends on feasibility check)
• Competitive Benchmarking
Benchmarking of key players based on product portfolio, geographical presence, and strategic alliances
Table of Contents
1 Executive Summary
2 Preface
2.1 Abstract
2.2 Stake Holders
2.3 Research Scope
2.4 Research Methodology
2.4.1 Data Mining
2.4.2 Data Analysis
2.4.3 Data Validation
2.4.4 Research Approach
2.5 Research Sources
2.5.1 Primary Research Sources
2.5.2 Secondary Research Sources
2.5.3 Assumptions
3 Market Trend Analysis
3.1 Introduction
3.2 Drivers
3.3 Restraints
3.4 Opportunities
3.5 Threats
3.6 Application Analysis
3.7 End User Analysis
3.8 Emerging Markets
3.9 Impact of Covid-19
4 Porters Five Force Analysis
4.1 Bargaining power of suppliers
4.2 Bargaining power of buyers
4.3 Threat of substitutes
4.4 Threat of new entrants
4.5 Competitive rivalry
5 Global Digital TV Soc Market, By Type
5.1 Introduction
5.2 High-definition (HD) SoCs
5.3 Ultra-high-definition (UHD) SoCs
5.4 Smart TV SoCs
5.5 Hybrid TV SoCs
5.6 Other Types
6 Global Digital TV Soc Market, By Application
6.1 Introduction
6.2 LCD (Liquid Crystal Display)
6.3 LED (Light Emitting Diode)
6.4 OLED (Organic Light Emitting Diodes)
6.5 QLED (Quantum-dot Light Emitting Diode)
6.6 Other Applications
7 Global Digital TV Soc Market, By End User
7.1 Introduction
7.2 Residential
7.3 Commercial
7.4 Television Manufacturers
7.5 Set-Top Box Manufacturers
7.6 System Integrators
7.7 Content Providers
7.8 Broadcasting Companies
7.9 Other End Users
8 Global Digital TV Soc Market, By Geography
8.1 Introduction
8.2 North America
8.2.1 US
8.2.2 Canada
8.2.3 Mexico
8.3 Europe
8.3.1 Germany
8.3.2 UK
8.3.3 Italy
8.3.4 France
8.3.5 Spain
8.3.6 Rest of Europe
8.4 Asia Pacific
8.4.1 Japan
8.4.2 China
8.4.3 India
8.4.4 Australia
8.4.5 New Zealand
8.4.6 South Korea
8.4.7 Rest of Asia Pacific
8.5 South America
8.5.1 Argentina
8.5.2 Brazil
8.5.3 Chile
8.5.4 Rest of South America
8.6 Middle East & Africa
8.6.1 Saudi Arabia
8.6.2 UAE
8.6.3 Qatar
8.6.4 South Africa
8.6.5 Rest of Middle East & Africa
9 Key Developments
9.1 Agreements, Partnerships, Collaborations and Joint Ventures
9.2 Acquisitions & Mergers
9.3 New Product Launch
9.4 Expansions
9.5 Other Key Strategies
10 Company Profiling
10.1 Amlogic
10.2 Apple, Inc.
10.3 Broadcom, Inc.
10.4 Intel Corporation
10.5 LG Electronics Inc.
10.6 MediaTek Inc
10.7 Novatek Microelectronics
10.8 NXP Semiconductors N.V.
10.9 Qualcomm Technologies, Inc.
10.10 Realtek Semiconductor Corp.
10.11 Samsung Electronics Co., Ltd.
10.12 Sony Corporation
10.13 STMicroelectronics N.V.
10.14 Taiwan Semiconductor Manufacturing Company Limited
10.15 Toshiba Corporation
List of Tables
1 Global Digital TV Soc Market Outlook, By Region (2021-2030) ($MN)
2 Global Digital TV Soc Market Outlook, By Type (2021-2030) ($MN)
3 Global Digital TV Soc Market Outlook, By High-definition (HD) SoCs (2021-2030) ($MN)
4 Global Digital TV Soc Market Outlook, By Ultra-high-definition (UHD) SoCs (2021-2030) ($MN)
5 Global Digital TV Soc Market Outlook, By Smart TV SoCs (2021-2030) ($MN)
6 Global Digital TV Soc Market Outlook, By Hybrid TV SoCs (2021-2030) ($MN)
7 Global Digital TV Soc Market Outlook, By Other Types (2021-2030) ($MN)
8 Global Digital TV Soc Market Outlook, By Application (2021-2030) ($MN)
9 Global Digital TV Soc Market Outlook, By LCD (Liquid Crystal Display) (2021-2030) ($MN)
10 Global Digital TV Soc Market Outlook, By LED (Light Emitting Diode) (2021-2030) ($MN)
11 Global Digital TV Soc Market Outlook, By OLED (Organic Light Emitting Diodes) (2021-2030) ($MN)
12 Global Digital TV Soc Market Outlook, By QLED (Quantum-dot Light Emitting Diode) (2021-2030) ($MN)
13 Global Digital TV Soc Market Outlook, By Other Applications (2021-2030) ($MN)
14 Global Digital TV Soc Market Outlook, By End User (2021-2030) ($MN)
15 Global Digital TV Soc Market Outlook, By Residential (2021-2030) ($MN)
16 Global Digital TV Soc Market Outlook, By Commercial (2021-2030) ($MN)
17 Global Digital TV Soc Market Outlook, By Television Manufacturers (2021-2030) ($MN)
18 Global Digital TV Soc Market Outlook, By Set-Top Box Manufacturers (2021-2030) ($MN)
19 Global Digital TV Soc Market Outlook, By System Integrators (2021-2030) ($MN)
20 Global Digital TV Soc Market Outlook, By Content Providers (2021-2030) ($MN)
21 Global Digital TV Soc Market Outlook, By Broadcasting Companies (2021-2030) ($MN)
22 Global Digital TV Soc Market Outlook, By Other End Users (2021-2030) ($MN)
23 North America Digital TV Soc Market Outlook, By Country (2021-2030) ($MN)
24 North America Digital TV Soc Market Outlook, By Type (2021-2030) ($MN)
25 North America Digital TV Soc Market Outlook, By High-definition (HD) SoCs (2021-2030) ($MN)
26 North America Digital TV Soc Market Outlook, By Ultra-high-definition (UHD) SoCs (2021-2030) ($MN)
27 North America Digital TV Soc Market Outlook, By Smart TV SoCs (2021-2030) ($MN)
28 North America Digital TV Soc Market Outlook, By Hybrid TV SoCs (2021-2030) ($MN)
29 North America Digital TV Soc Market Outlook, By Other Types (2021-2030) ($MN)
30 North America Digital TV Soc Market Outlook, By Application (2021-2030) ($MN)
31 North America Digital TV Soc Market Outlook, By LCD (Liquid Crystal Display) (2021-2030) ($MN)
32 North America Digital TV Soc Market Outlook, By LED (Light Emitting Diode) (2021-2030) ($MN)
33 North America Digital TV Soc Market Outlook, By OLED (Organic Light Emitting Diodes) (2021-2030) ($MN)
34 North America Digital TV Soc Market Outlook, By QLED (Quantum-dot Light Emitting Diode) (2021-2030) ($MN)
35 North America Digital TV Soc Market Outlook, By Other Applications (2021-2030) ($MN)
36 North America Digital TV Soc Market Outlook, By End User (2021-2030) ($MN)
37 North America Digital TV Soc Market Outlook, By Residential (2021-2030) ($MN)
38 North America Digital TV Soc Market Outlook, By Commercial (2021-2030) ($MN)
39 North America Digital TV Soc Market Outlook, By Television Manufacturers (2021-2030) ($MN)
40 North America Digital TV Soc Market Outlook, By Set-Top Box Manufacturers (2021-2030) ($MN)
41 North America Digital TV Soc Market Outlook, By System Integrators (2021-2030) ($MN)
42 North America Digital TV Soc Market Outlook, By Content Providers (2021-2030) ($MN)
43 North America Digital TV Soc Market Outlook, By Broadcasting Companies (2021-2030) ($MN)
44 North America Digital TV Soc Market Outlook, By Other End Users (2021-2030) ($MN)
45 Europe Digital TV Soc Market Outlook, By Country (2021-2030) ($MN)
46 Europe Digital TV Soc Market Outlook, By Type (2021-2030) ($MN)
47 Europe Digital TV Soc Market Outlook, By High-definition (HD) SoCs (2021-2030) ($MN)
48 Europe Digital TV Soc Market Outlook, By Ultra-high-definition (UHD) SoCs (2021-2030) ($MN)
49 Europe Digital TV Soc Market Outlook, By Smart TV SoCs (2021-2030) ($MN)
50 Europe Digital TV Soc Market Outlook, By Hybrid TV SoCs (2021-2030) ($MN)
51 Europe Digital TV Soc Market Outlook, By Other Types (2021-2030) ($MN)
52 Europe Digital TV Soc Market Outlook, By Application (2021-2030) ($MN)
53 Europe Digital TV Soc Market Outlook, By LCD (Liquid Crystal Display) (2021-2030) ($MN)
54 Europe Digital TV Soc Market Outlook, By LED (Light Emitting Diode) (2021-2030) ($MN)
55 Europe Digital TV Soc Market Outlook, By OLED (Organic Light Emitting Diodes) (2021-2030) ($MN)
56 Europe Digital TV Soc Market Outlook, By QLED (Quantum-dot Light Emitting Diode) (2021-2030) ($MN)
57 Europe Digital TV Soc Market Outlook, By Other Applications (2021-2030) ($MN)
58 Europe Digital TV Soc Market Outlook, By End User (2021-2030) ($MN)
59 Europe Digital TV Soc Market Outlook, By Residential (2021-2030) ($MN)
60 Europe Digital TV Soc Market Outlook, By Commercial (2021-2030) ($MN)
61 Europe Digital TV Soc Market Outlook, By Television Manufacturers (2021-2030) ($MN)
62 Europe Digital TV Soc Market Outlook, By Set-Top Box Manufacturers (2021-2030) ($MN)
63 Europe Digital TV Soc Market Outlook, By System Integrators (2021-2030) ($MN)
64 Europe Digital TV Soc Market Outlook, By Content Providers (2021-2030) ($MN)
65 Europe Digital TV Soc Market Outlook, By Broadcasting Companies (2021-2030) ($MN)
66 Europe Digital TV Soc Market Outlook, By Other End Users (2021-2030) ($MN)
67 Asia Pacific Digital TV Soc Market Outlook, By Country (2021-2030) ($MN)
68 Asia Pacific Digital TV Soc Market Outlook, By Type (2021-2030) ($MN)
69 Asia Pacific Digital TV Soc Market Outlook, By High-definition (HD) SoCs (2021-2030) ($MN)
70 Asia Pacific Digital TV Soc Market Outlook, By Ultra-high-definition (UHD) SoCs (2021-2030) ($MN)
71 Asia Pacific Digital TV Soc Market Outlook, By Smart TV SoCs (2021-2030) ($MN)
72 Asia Pacific Digital TV Soc Market Outlook, By Hybrid TV SoCs (2021-2030) ($MN)
73 Asia Pacific Digital TV Soc Market Outlook, By Other Types (2021-2030) ($MN)
74 Asia Pacific Digital TV Soc Market Outlook, By Application (2021-2030) ($MN)
75 Asia Pacific Digital TV Soc Market Outlook, By LCD (Liquid Crystal Display) (2021-2030) ($MN)
76 Asia Pacific Digital TV Soc Market Outlook, By LED (Light Emitting Diode) (2021-2030) ($MN)
77 Asia Pacific Digital TV Soc Market Outlook, By OLED (Organic Light Emitting Diodes) (2021-2030) ($MN)
78 Asia Pacific Digital TV Soc Market Outlook, By QLED (Quantum-dot Light Emitting Diode) (2021-2030) ($MN)
79 Asia Pacific Digital TV Soc Market Outlook, By Other Applications (2021-2030) ($MN)
80 Asia Pacific Digital TV Soc Market Outlook, By End User (2021-2030) ($MN)
81 Asia Pacific Digital TV Soc Market Outlook, By Residential (2021-2030) ($MN)
82 Asia Pacific Digital TV Soc Market Outlook, By Commercial (2021-2030) ($MN)
83 Asia Pacific Digital TV Soc Market Outlook, By Television Manufacturers (2021-2030) ($MN)
84 Asia Pacific Digital TV Soc Market Outlook, By Set-Top Box Manufacturers (2021-2030) ($MN)
85 Asia Pacific Digital TV Soc Market Outlook, By System Integrators (2021-2030) ($MN)
86 Asia Pacific Digital TV Soc Market Outlook, By Content Providers (2021-2030) ($MN)
87 Asia Pacific Digital TV Soc Market Outlook, By Broadcasting Companies (2021-2030) ($MN)
88 Asia Pacific Digital TV Soc Market Outlook, By Other End Users (2021-2030) ($MN)
89 South America Digital TV Soc Market Outlook, By Country (2021-2030) ($MN)
90 South America Digital TV Soc Market Outlook, By Type (2021-2030) ($MN)
91 South America Digital TV Soc Market Outlook, By High-definition (HD) SoCs (2021-2030) ($MN)
92 South America Digital TV Soc Market Outlook, By Ultra-high-definition (UHD) SoCs (2021-2030) ($MN)
93 South America Digital TV Soc Market Outlook, By Smart TV SoCs (2021-2030) ($MN)
94 South America Digital TV Soc Market Outlook, By Hybrid TV SoCs (2021-2030) ($MN)
95 South America Digital TV Soc Market Outlook, By Other Types (2021-2030) ($MN)
96 South America Digital TV Soc Market Outlook, By Application (2021-2030) ($MN)
97 South America Digital TV Soc Market Outlook, By LCD (Liquid Crystal Display) (2021-2030) ($MN)
98 South America Digital TV Soc Market Outlook, By LED (Light Emitting Diode) (2021-2030) ($MN)
99 South America Digital TV Soc Market Outlook, By OLED (Organic Light Emitting Diodes) (2021-2030) ($MN)
100 South America Digital TV Soc Market Outlook, By QLED (Quantum-dot Light Emitting Diode) (2021-2030) ($MN)
101 South America Digital TV Soc Market Outlook, By Other Applications (2021-2030) ($MN)
102 South America Digital TV Soc Market Outlook, By End User (2021-2030) ($MN)
103 South America Digital TV Soc Market Outlook, By Residential (2021-2030) ($MN)
104 South America Digital TV Soc Market Outlook, By Commercial (2021-2030) ($MN)
105 South America Digital TV Soc Market Outlook, By Television Manufacturers (2021-2030) ($MN)
106 South America Digital TV Soc Market Outlook, By Set-Top Box Manufacturers (2021-2030) ($MN)
107 South America Digital TV Soc Market Outlook, By System Integrators (2021-2030) ($MN)
108 South America Digital TV Soc Market Outlook, By Content Providers (2021-2030) ($MN)
109 South America Digital TV Soc Market Outlook, By Broadcasting Companies (2021-2030) ($MN)
110 South America Digital TV Soc Market Outlook, By Other End Users (2021-2030) ($MN)
111 Middle East & Africa Digital TV Soc Market Outlook, By Country (2021-2030) ($MN)
112 Middle East & Africa Digital TV Soc Market Outlook, By Type (2021-2030) ($MN)
113 Middle East & Africa Digital TV Soc Market Outlook, By High-definition (HD) SoCs (2021-2030) ($MN)
114 Middle East & Africa Digital TV Soc Market Outlook, By Ultra-high-definition (UHD) SoCs (2021-2030) ($MN)
115 Middle East & Africa Digital TV Soc Market Outlook, By Smart TV SoCs (2021-2030) ($MN)
116 Middle East & Africa Digital TV Soc Market Outlook, By Hybrid TV SoCs (2021-2030) ($MN)
117 Middle East & Africa Digital TV Soc Market Outlook, By Other Types (2021-2030) ($MN)
118 Middle East & Africa Digital TV Soc Market Outlook, By Application (2021-2030) ($MN)
119 Middle East & Africa Digital TV Soc Market Outlook, By LCD (Liquid Crystal Display) (2021-2030) ($MN)
120 Middle East & Africa Digital TV Soc Market Outlook, By LED (Light Emitting Diode) (2021-2030) ($MN)
121 Middle East & Africa Digital TV Soc Market Outlook, By OLED (Organic Light Emitting Diodes) (2021-2030) ($MN)
122 Middle East & Africa Digital TV Soc Market Outlook, By QLED (Quantum-dot Light Emitting Diode) (2021-2030) ($MN)
123 Middle East & Africa Digital TV Soc Market Outlook, By Other Applications (2021-2030) ($MN)
124 Middle East & Africa Digital TV Soc Market Outlook, By End User (2021-2030) ($MN)
125 Middle East & Africa Digital TV Soc Market Outlook, By Residential (2021-2030) ($MN)
126 Middle East & Africa Digital TV Soc Market Outlook, By Commercial (2021-2030) ($MN)
127 Middle East & Africa Digital TV Soc Market Outlook, By Television Manufacturers (2021-2030) ($MN)
128 Middle East & Africa Digital TV Soc Market Outlook, By Set-Top Box Manufacturers (2021-2030) ($MN)
129 Middle East & Africa Digital TV Soc Market Outlook, By System Integrators (2021-2030) ($MN)
130 Middle East & Africa Digital TV Soc Market Outlook, By Content Providers (2021-2030) ($MN)
131 Middle East & Africa Digital TV Soc Market Outlook, By Broadcasting Companies (2021-2030) ($MN)
132 Middle East & Africa Digital TV Soc Market Outlook, By Other End Users (2021-2030) ($MN)
List of Figures
RESEARCH METHODOLOGY

We at ‘Stratistics’ opt for an extensive research approach which involves data mining, data validation, and data analysis. The various research sources include in-house repository, secondary research, competitor’s sources, social media research, client internal data, and primary research.
Our team of analysts prefers the most reliable and authenticated data sources in order to perform the comprehensive literature search. With access to most of the authenticated data bases our team highly considers the best mix of information through various sources to obtain extensive and accurate analysis.
Each report takes an average time of a month and a team of 4 industry analysts. The time may vary depending on the scope and data availability of the desired market report. The various parameters used in the market assessment are standardized in order to enhance the data accuracy.
Data Mining
The data is collected from several authenticated, reliable, paid and unpaid sources and is filtered depending on the scope & objective of the research. Our reports repository acts as an added advantage in this procedure. Data gathering from the raw material suppliers, distributors and the manufacturers is performed on a regular basis, this helps in the comprehensive understanding of the products value chain. Apart from the above mentioned sources the data is also collected from the industry consultants to ensure the objective of the study is in the right direction.
Market trends such as technological advancements, regulatory affairs, market dynamics (Drivers, Restraints, Opportunities and Challenges) are obtained from scientific journals, market related national & international associations and organizations.
Data Analysis
From the data that is collected depending on the scope & objective of the research the data is subjected for the analysis. The critical steps that we follow for the data analysis include:
- Product Lifecycle Analysis
- Competitor analysis
- Risk analysis
- Porters Analysis
- PESTEL Analysis
- SWOT Analysis
The data engineering is performed by the core industry experts considering both the Marketing Mix Modeling and the Demand Forecasting. The marketing mix modeling makes use of multiple-regression techniques to predict the optimal mix of marketing variables. Regression factor is based on a number of variables and how they relate to an outcome such as sales or profits.
Data Validation
The data validation is performed by the exhaustive primary research from the expert interviews. This includes telephonic interviews, focus groups, face to face interviews, and questionnaires to validate our research from all aspects. The industry experts we approach come from the leading firms, involved in the supply chain ranging from the suppliers, distributors to the manufacturers and consumers so as to ensure an unbiased analysis.
We are in touch with more than 15,000 industry experts with the right mix of consultants, CEO's, presidents, vice presidents, managers, experts from both supply side and demand side, executives and so on.
The data validation involves the primary research from the industry experts belonging to:
- Leading Companies
- Suppliers & Distributors
- Manufacturers
- Consumers
- Industry/Strategic Consultants
Apart from the data validation the primary research also helps in performing the fill gap research, i.e. providing solutions for the unmet needs of the research which helps in enhancing the reports quality.
For more details about research methodology, kindly write to us at info@strategymrc.com
Frequently Asked Questions
In case of any queries regarding this report, you can contact the customer service by filing the “Inquiry Before Buy” form available on the right hand side. You may also contact us through email: info@strategymrc.com or phone: +1-301-202-5929
Yes, the samples are available for all the published reports. You can request them by filling the “Request Sample” option available in this page.
Yes, you can request a sample with your specific requirements. All the customized samples will be provided as per the requirement with the real data masked.
All our reports are available in Digital PDF format. In case if you require them in any other formats, such as PPT, Excel etc you can submit a request through “Inquiry Before Buy” form available on the right hand side. You may also contact us through email: info@strategymrc.com or phone: +1-301-202-5929
We offer a free 15% customization with every purchase. This requirement can be fulfilled for both pre and post sale. You may send your customization requirements through email at info@strategymrc.com or call us on +1-301-202-5929.
We have 3 different licensing options available in electronic format.
- Single User Licence: Allows one person, typically the buyer, to have access to the ordered product. The ordered product cannot be distributed to anyone else.
- 2-5 User Licence: Allows the ordered product to be shared among a maximum of 5 people within your organisation.
- Corporate License: Allows the product to be shared among all employees of your organisation regardless of their geographical location.
All our reports are typically be emailed to you as an attachment.
To order any available report you need to register on our website. The payment can be made either through CCAvenue or PayPal payments gateways which accept all international cards.
We extend our support to 6 months post sale. A post sale customization is also provided to cover your unmet needs in the report.
Request Customization
We offer complimentary customization of up to 15% with every purchase. To share your customization requirements, feel free to email us at info@strategymrc.com or call us on +1-301-202-5929. .
Please Note: Customization within the 15% threshold is entirely free of charge. If your request exceeds this limit, we will conduct a feasibility assessment. Following that, a detailed quote and timeline will be provided.
WHY CHOOSE US ?

Assured Quality
Best in class reports with high standard of research integrity

24X7 Research Support
Continuous support to ensure the best customer experience.

Free Customization
Adding more values to your product of interest.

Safe & Secure Access
Providing a secured environment for all online transactions.

Trusted by 600+ Brands
Serving the most reputed brands across the world.